The $\ppiMinus$ experimental correlation function is shown in black as a function of the pair relative momentum $k^*$ for several intervals of the pair \mtText: (a) $[0.54, 0.75)\text{ GeV}/c^2$, (b) $[0.75, 0.95)\text{ GeV}/c^2$, (c) $[0.95, 1.2)\text{ GeV}/c^2$, (d) $[1.2, 1.5)\text{ GeV}/c^2$, (e) $[1.5, 2.0)\text{ GeV}/c^2$, and (f) $[2.0, 2.5)\text{ GeV}/c^2$. The lines and boxes show the statistical and systematic uncertainties of the experimental data, respectively. The fit results according to Eq. (???) are depicted by the red bands. Contributions of correlated background, final-state interaction, and $\Delta^{0}(1232)$ are shown as the green, blue, and yellow bands, respectively. The width of the bands represents the uncertainty from the fitting procedure. | 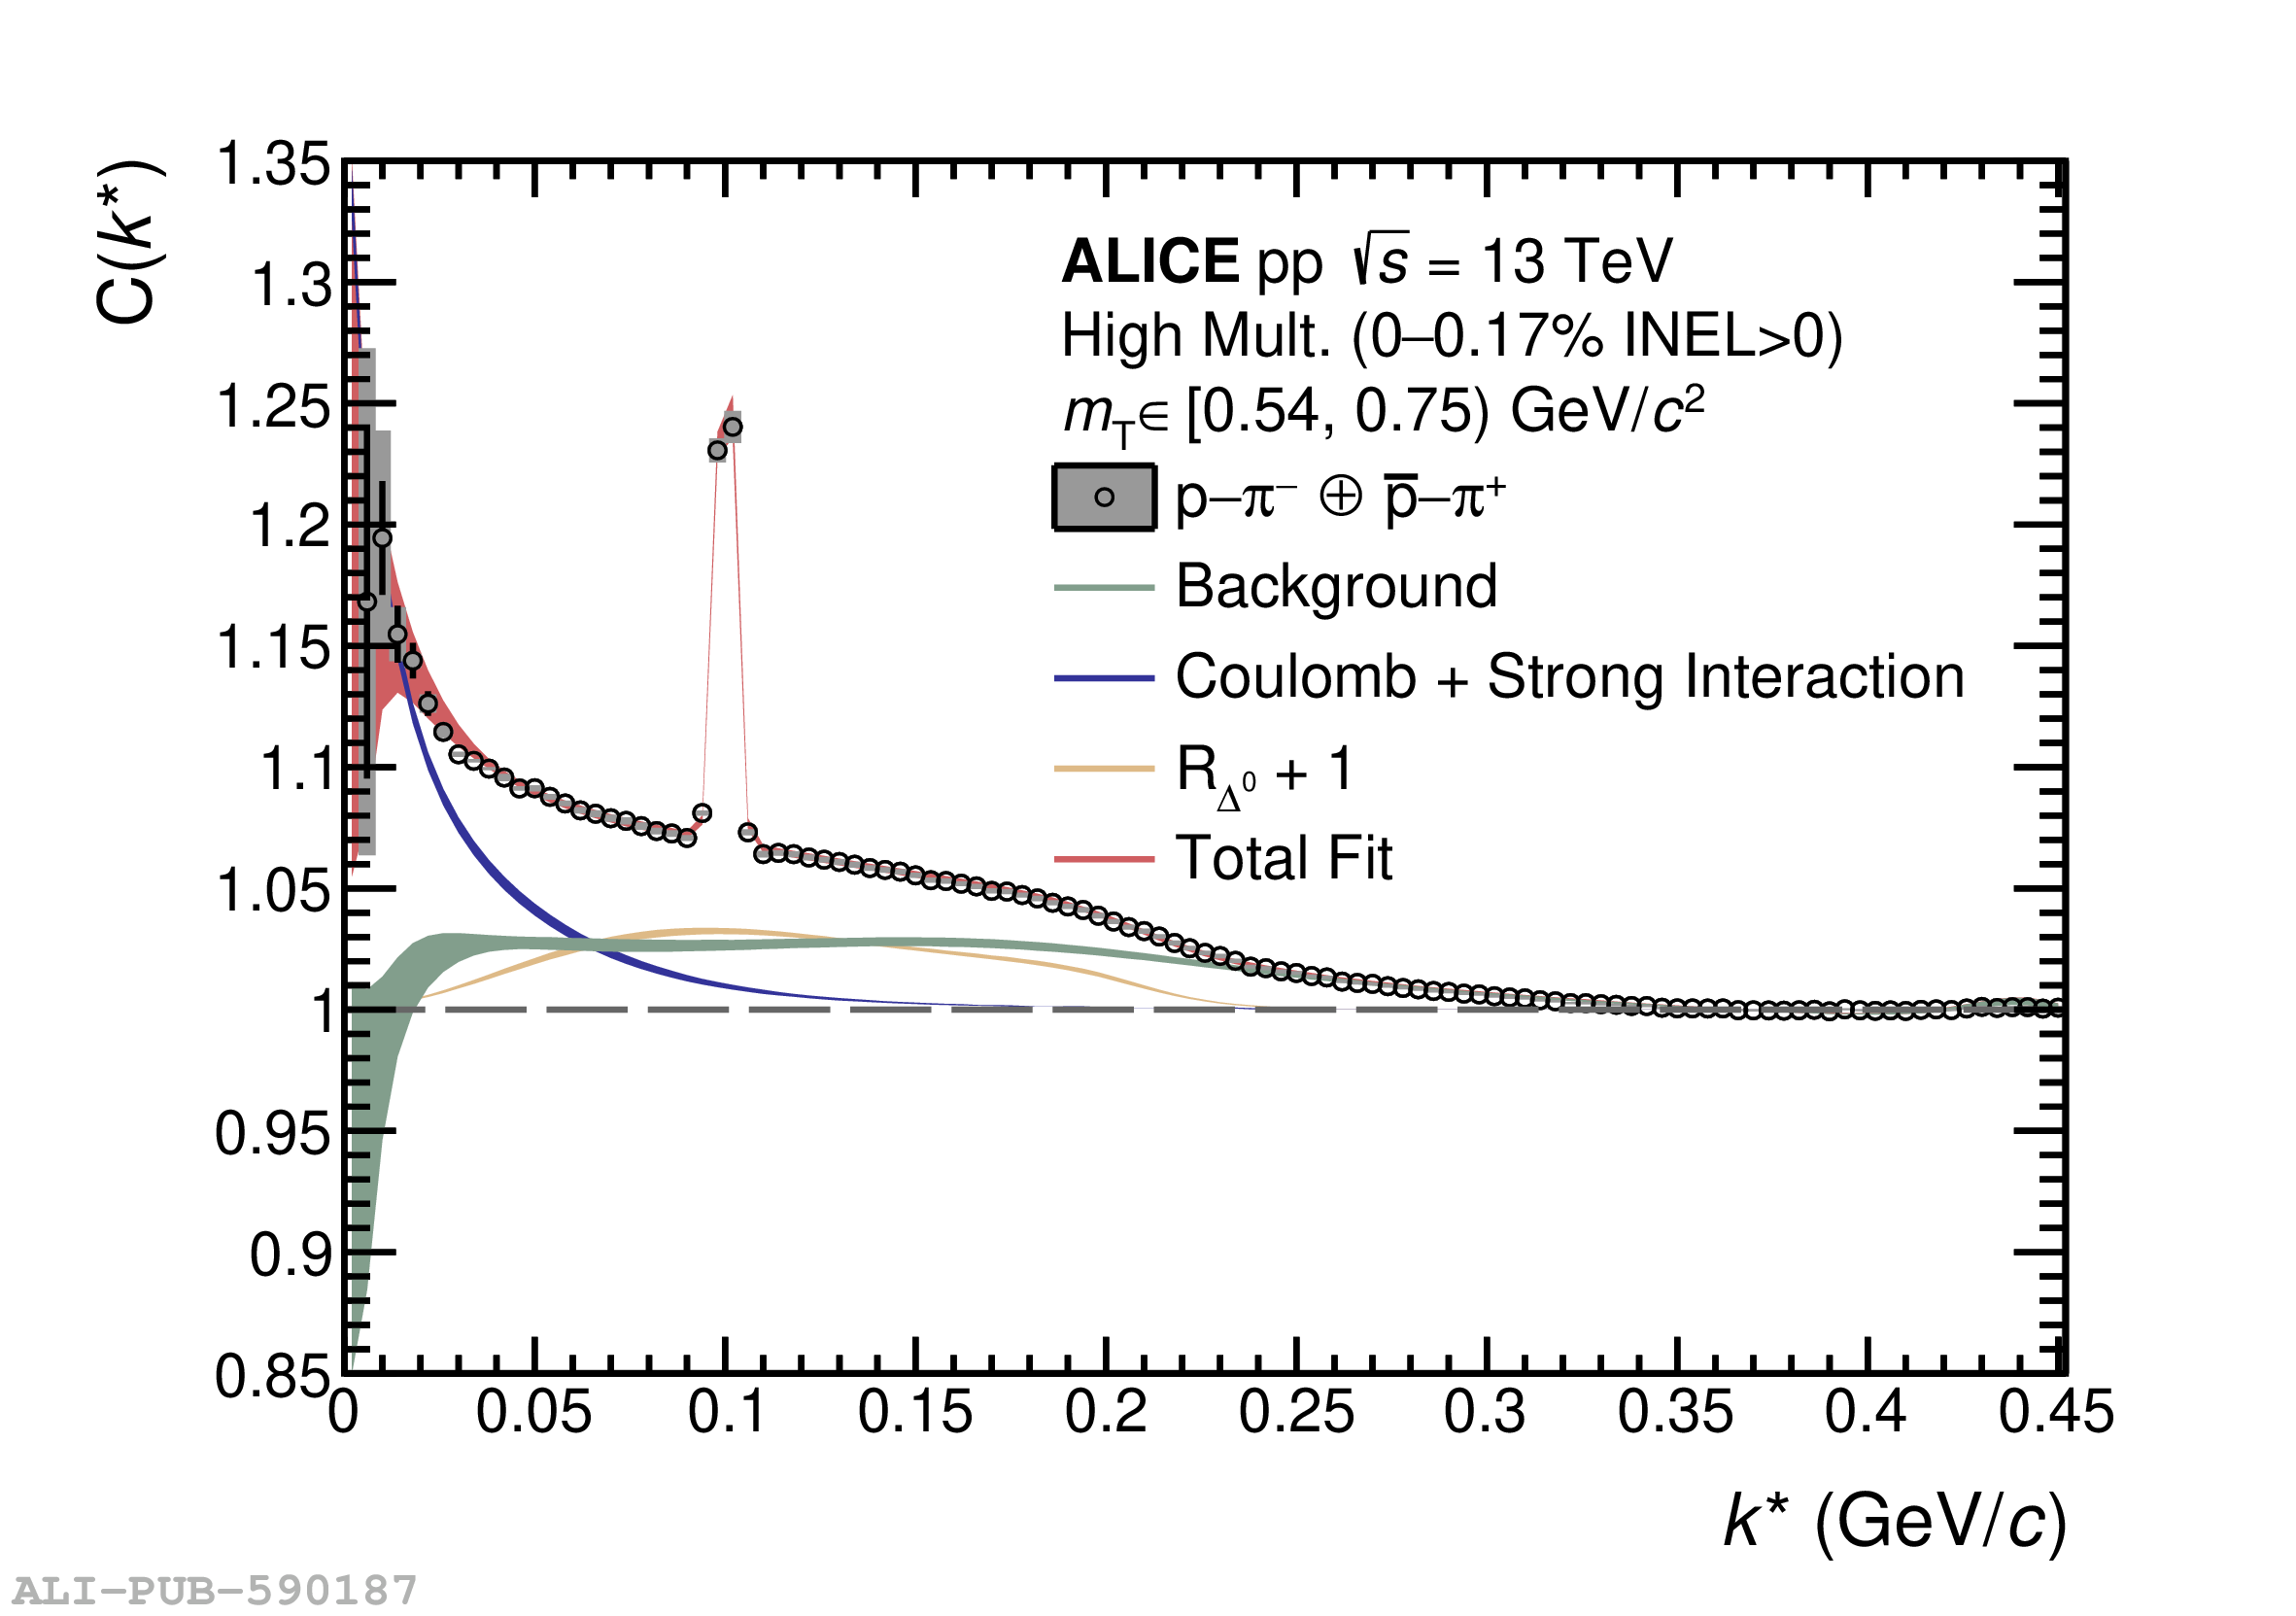  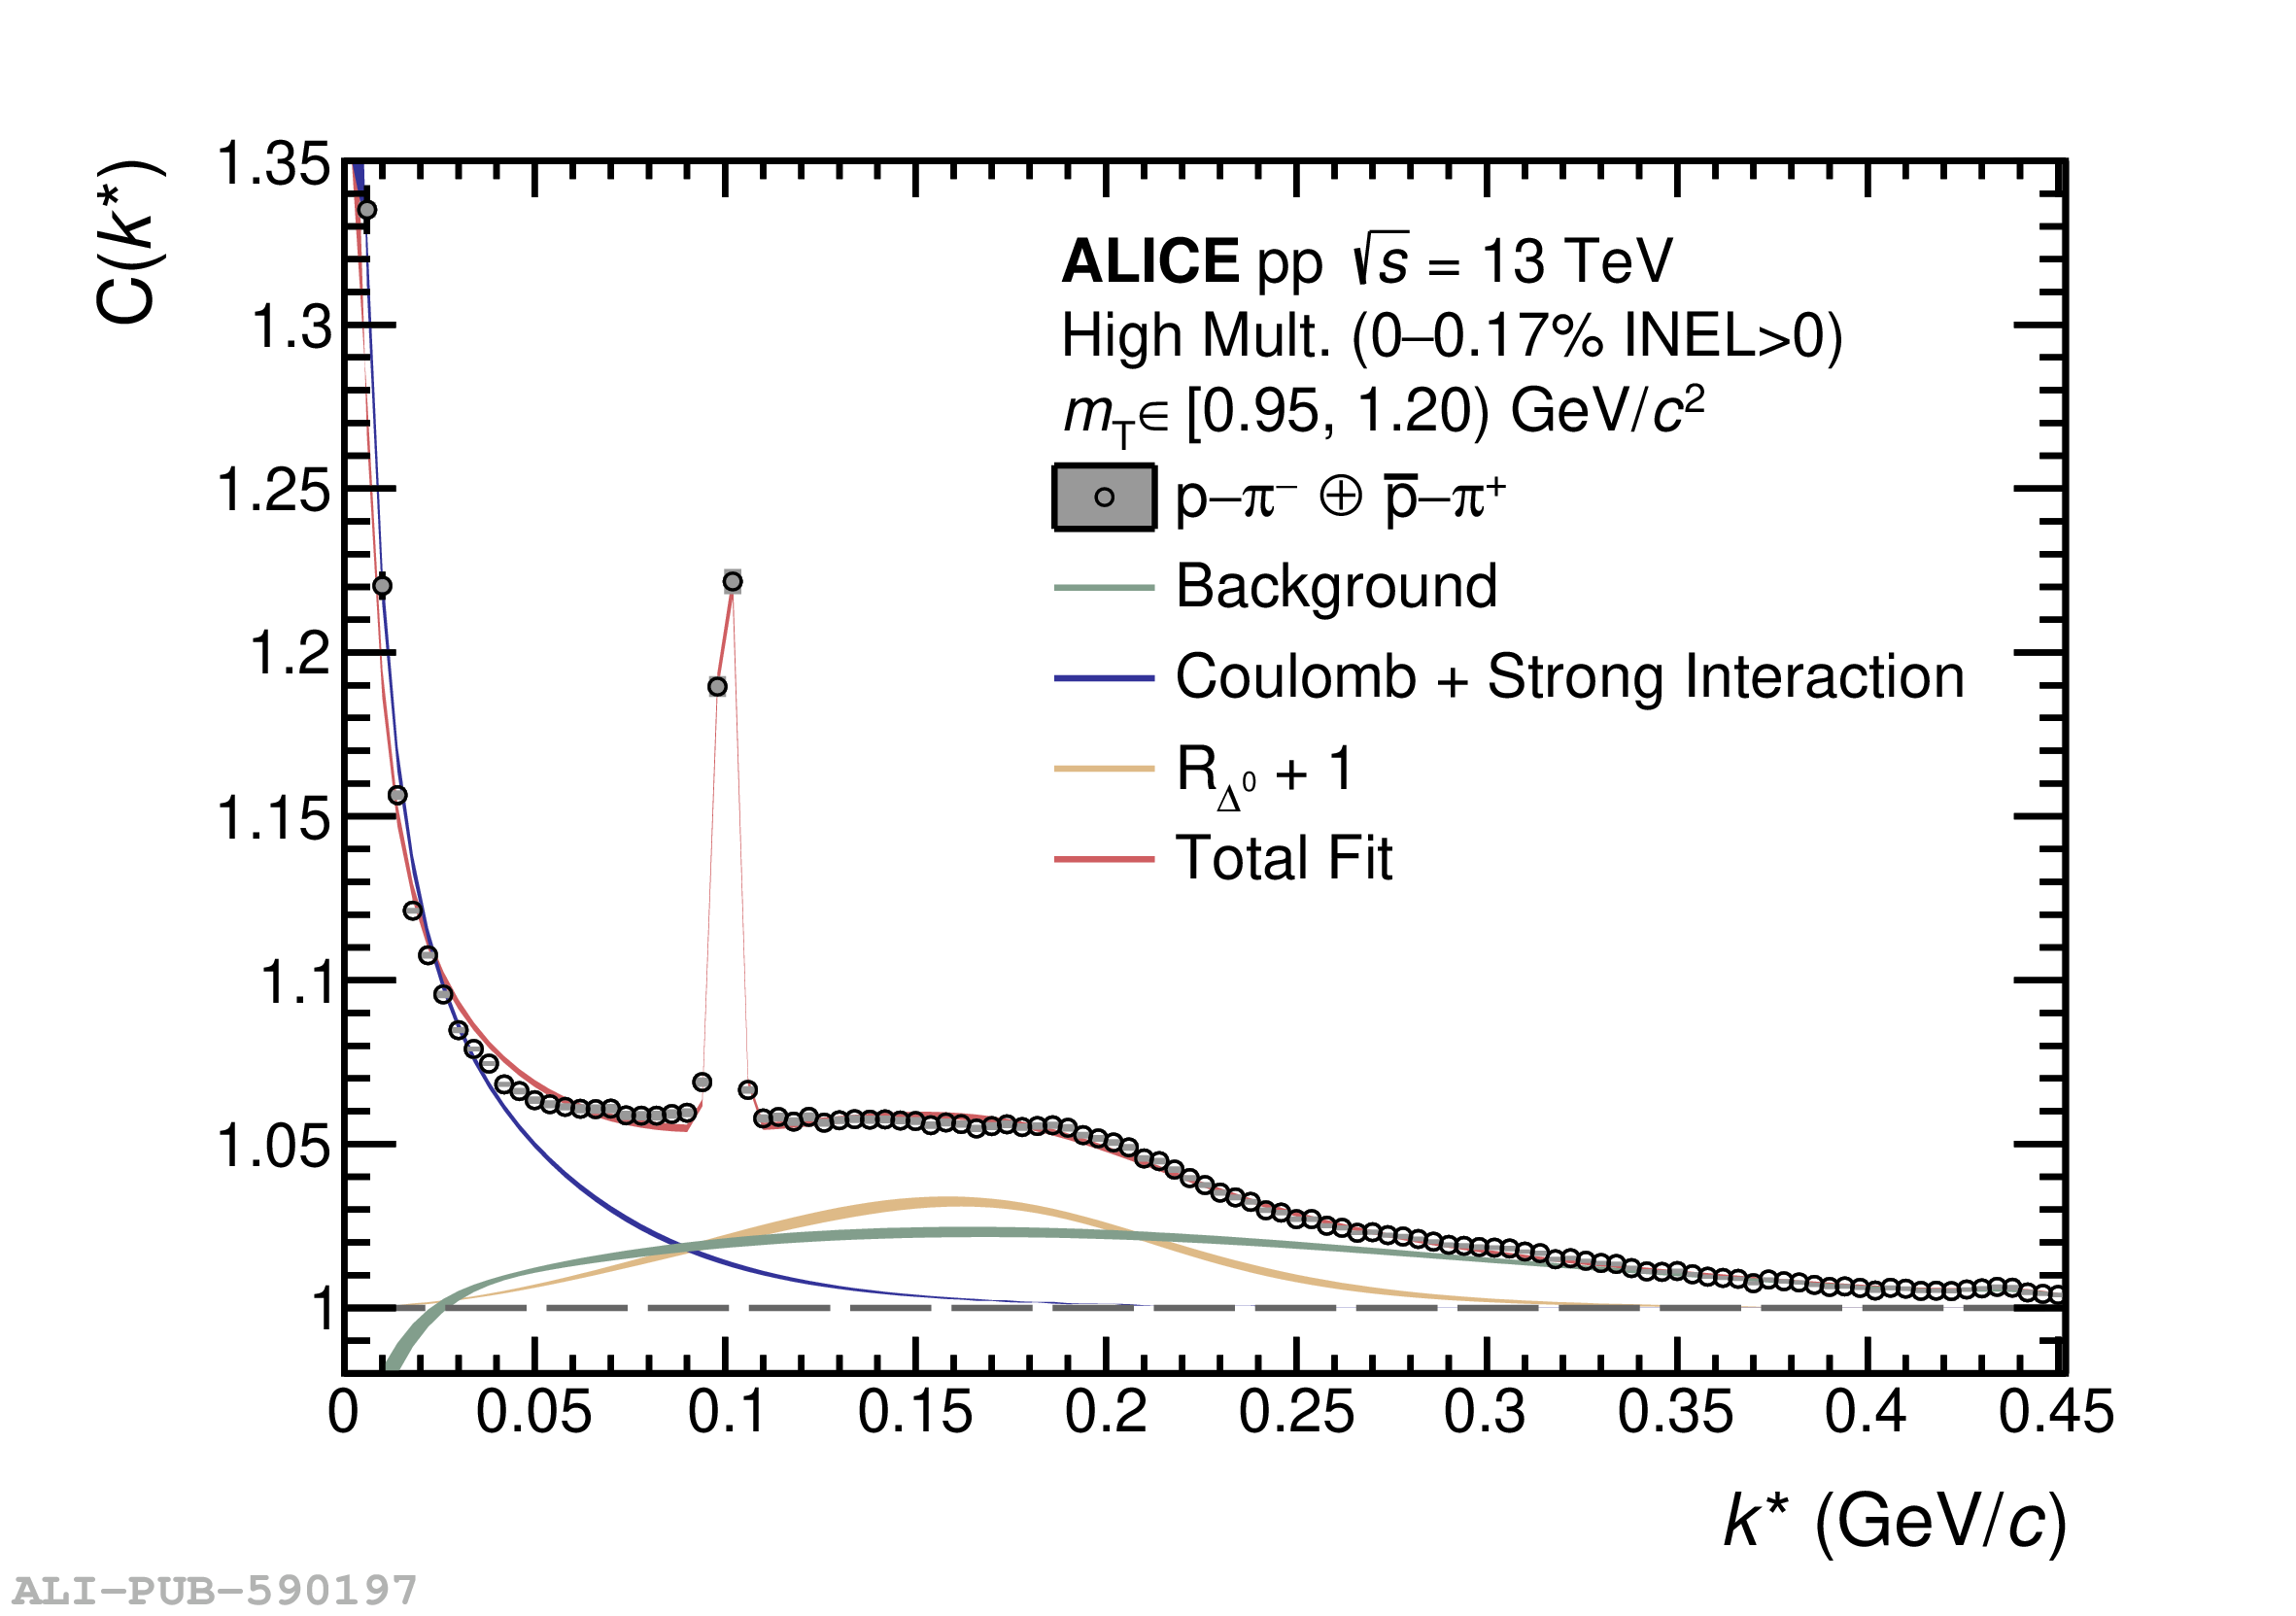   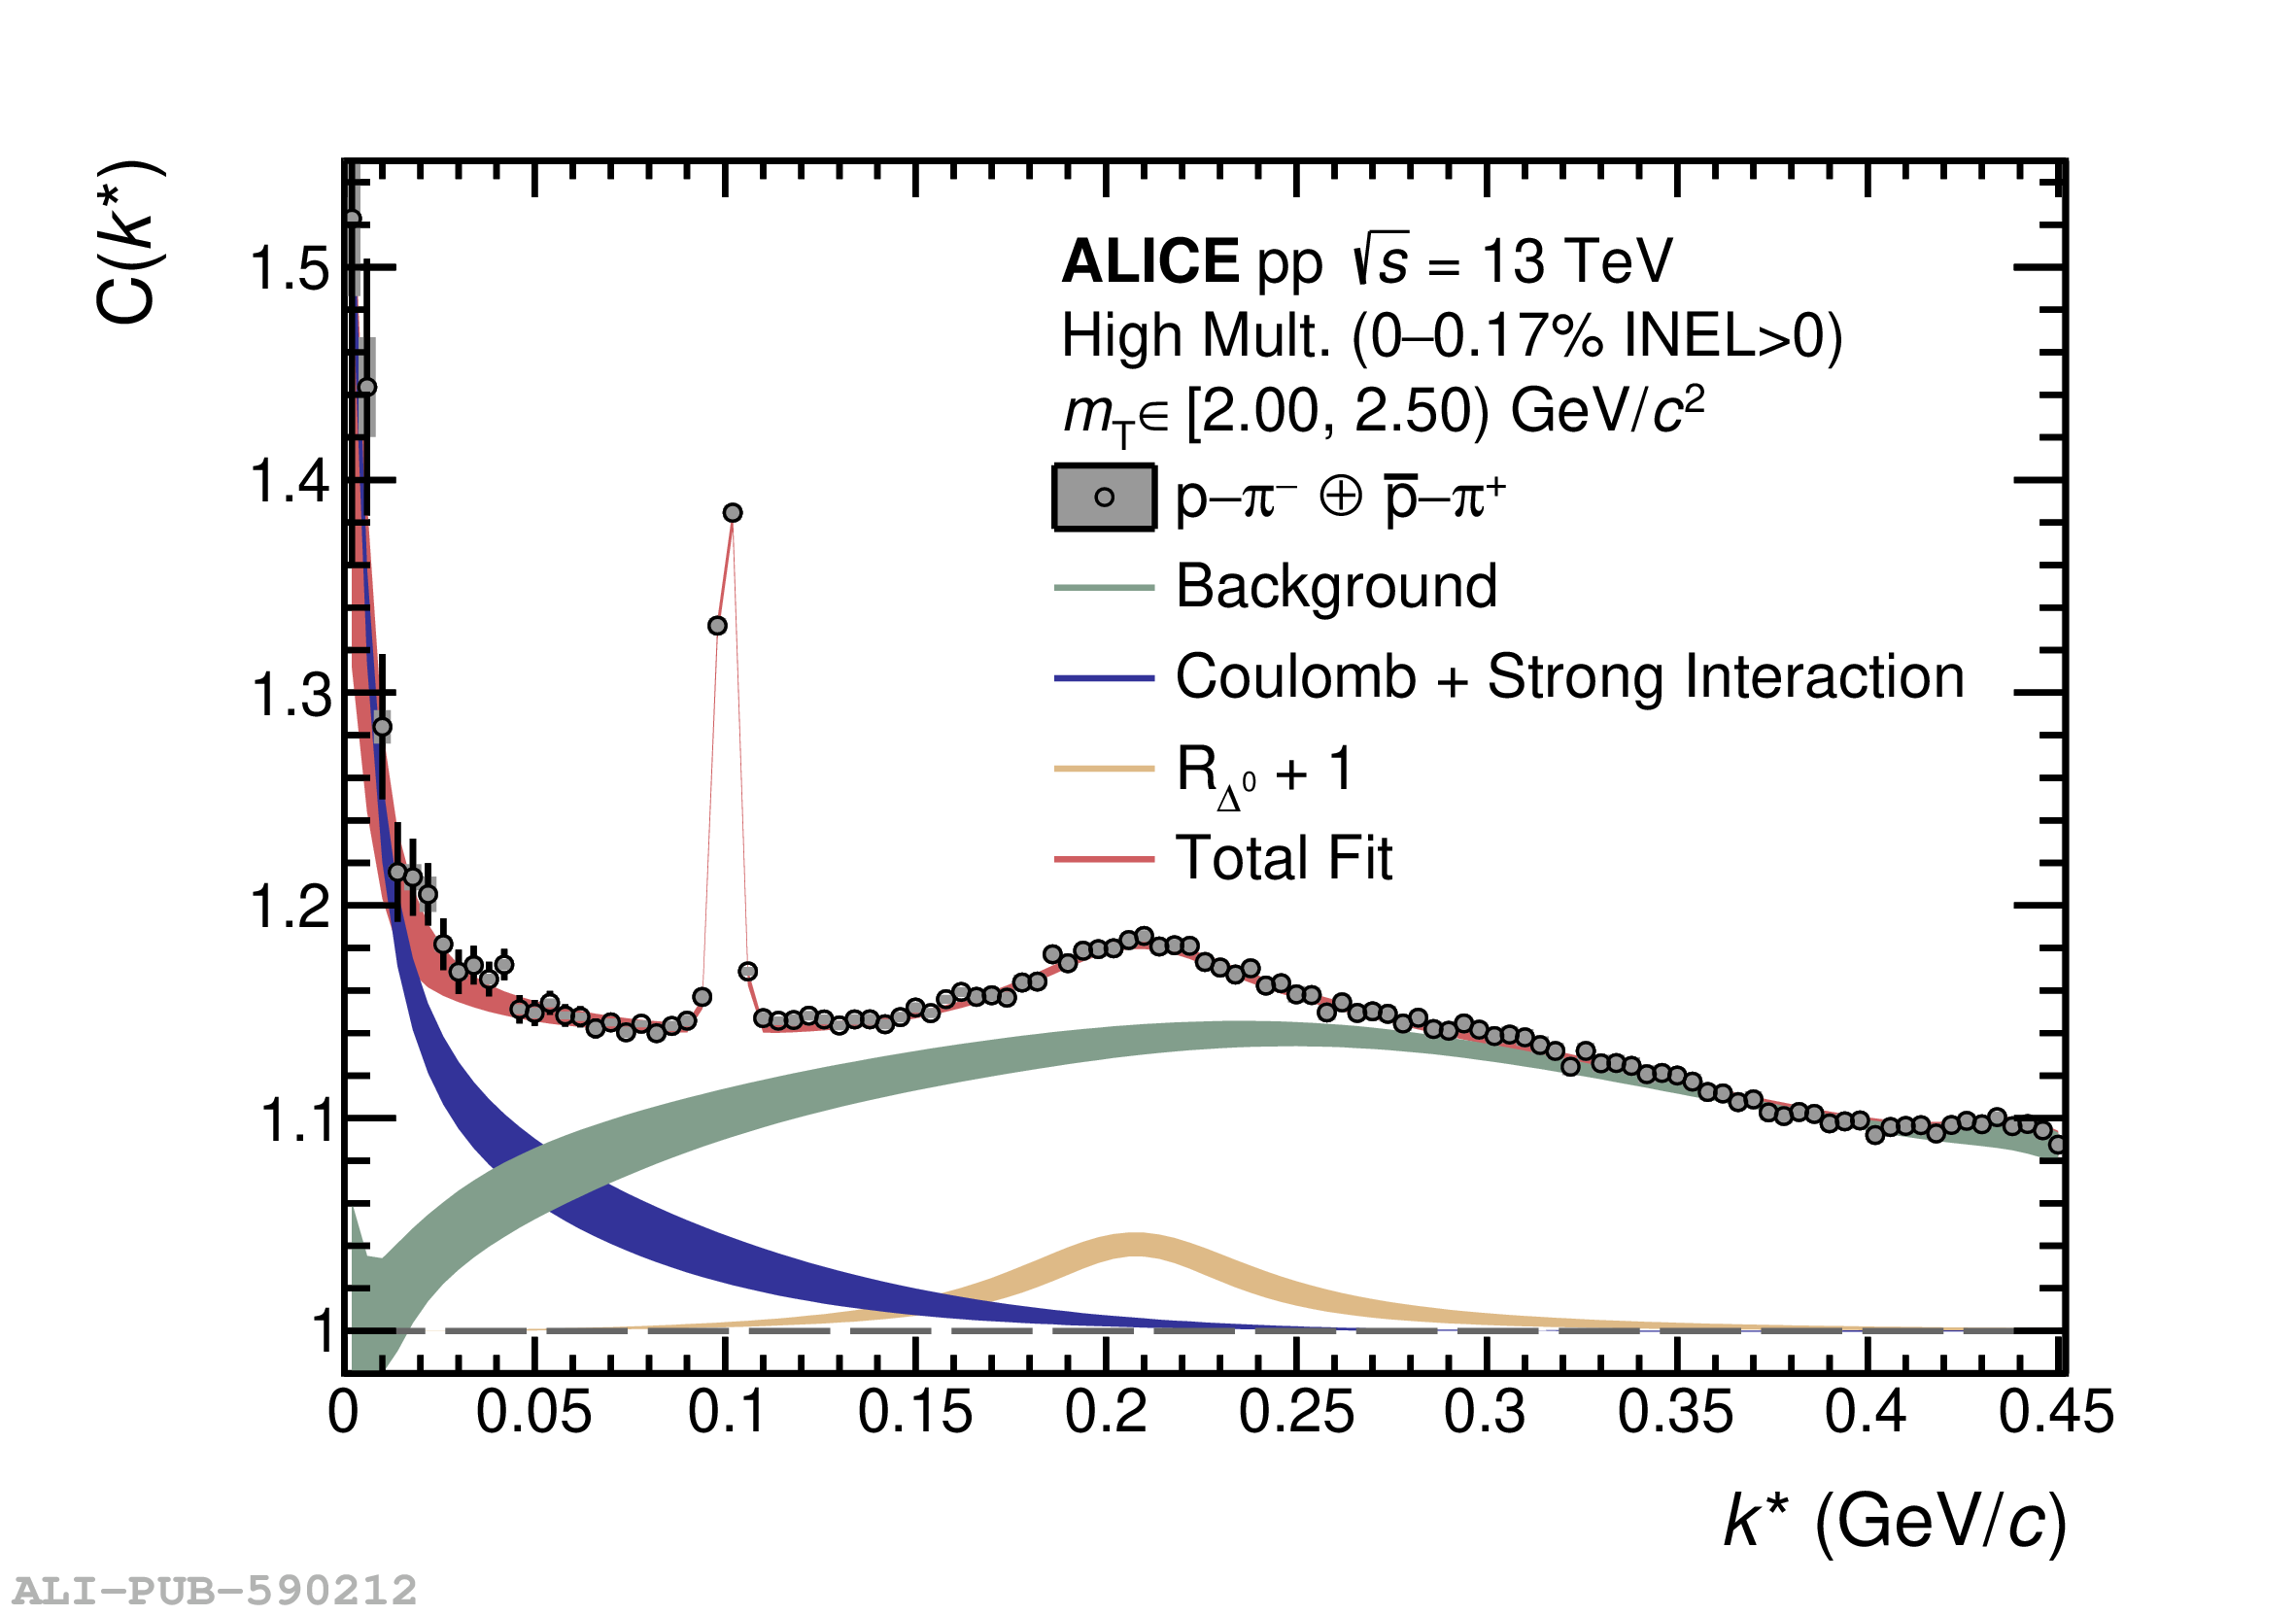 |