The experimental correlation function of $\ppiPlus$ pairs (black) as a function of the pair relative momentum $k^*$ in several intervals of the pair \mtText: (a) $[0.54, 0.75)\text{ GeV}/c^2$, (b) $[0.75, 0.95)\text{ GeV}/c^2$, (c) $[0.95, 1.2)\text{ GeV}/c^2$, (d) $[1.2, 1.5)\text{ GeV}/c^2$, (e) $[1.5, 2.0)\text{ GeV}/c^2$, and (f) $[2.0, 2.5)\text{ GeV}/c^2$. The lines (boxes) show the statistical (systematic) uncertainties of the experimental data. The red bands show the fit result according to Eq. \eqref{Eq. ProtonPion Exp Fit}. The single contributions of correlated background (green), final-state interaction (blue), and $\Delta^{++}(1232)$ (yellow) are presented by the respective colored bands. The width of the bands represents the uncertainty from the fitting procedure. | 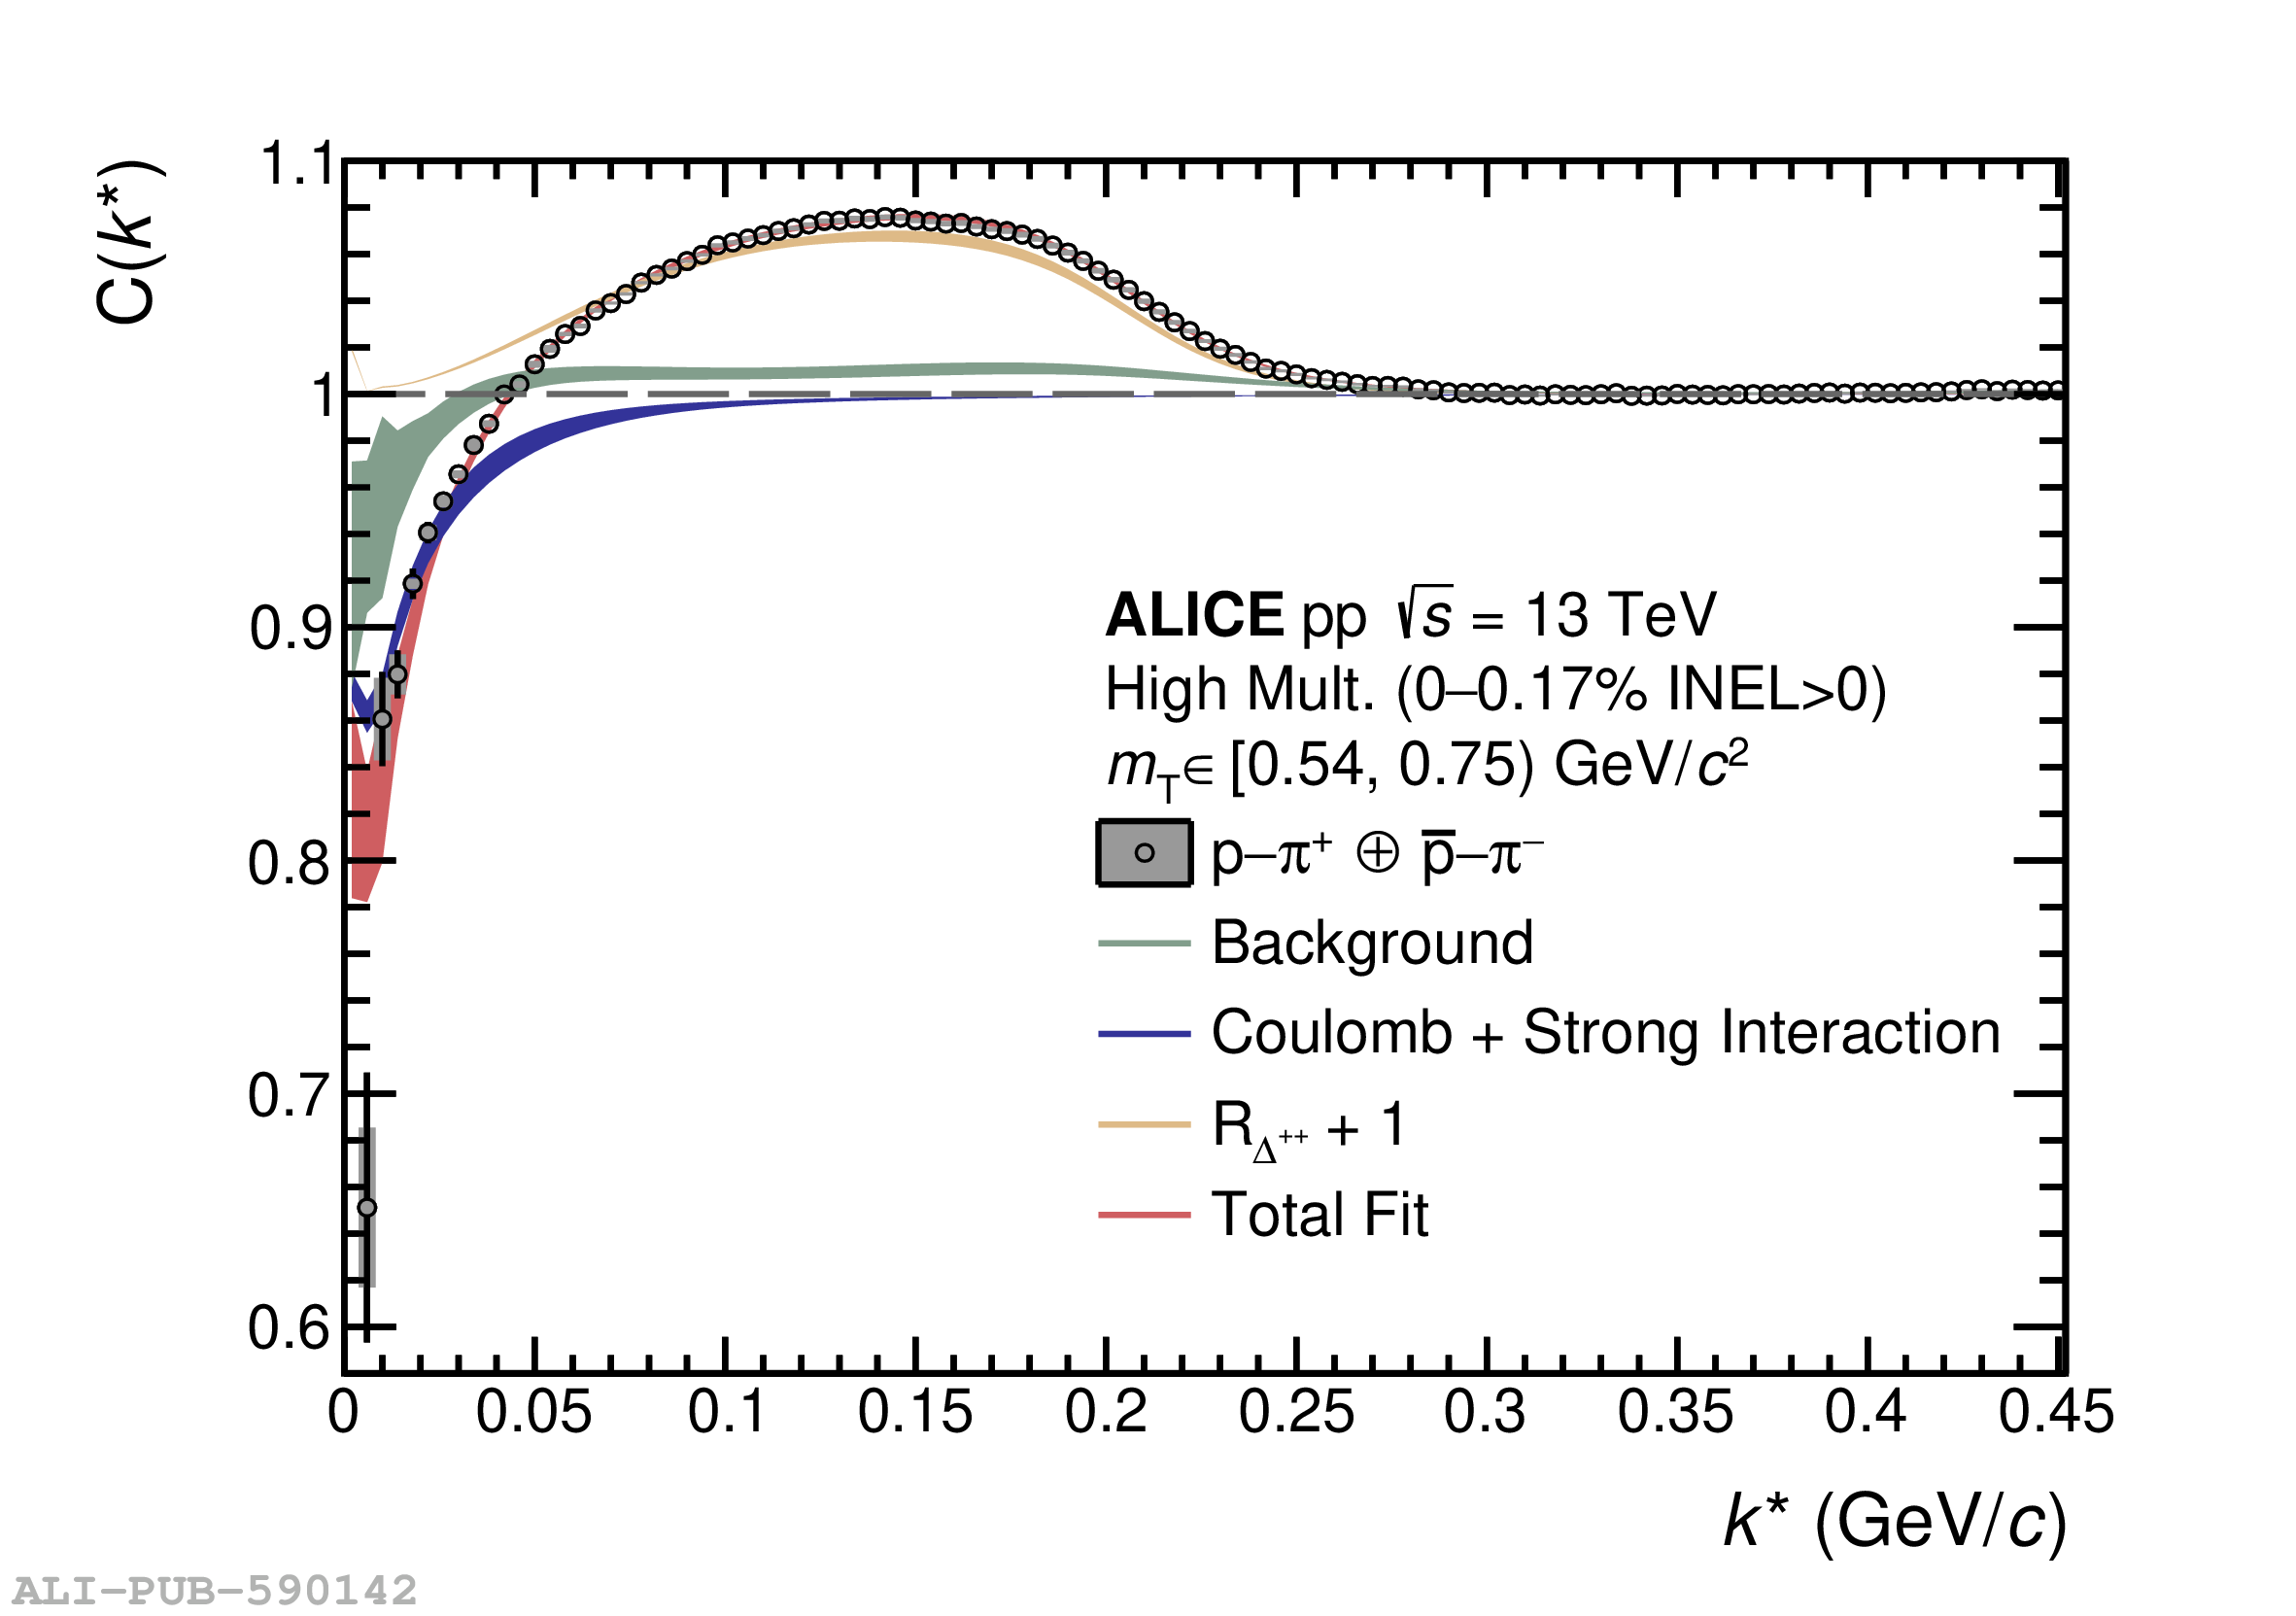 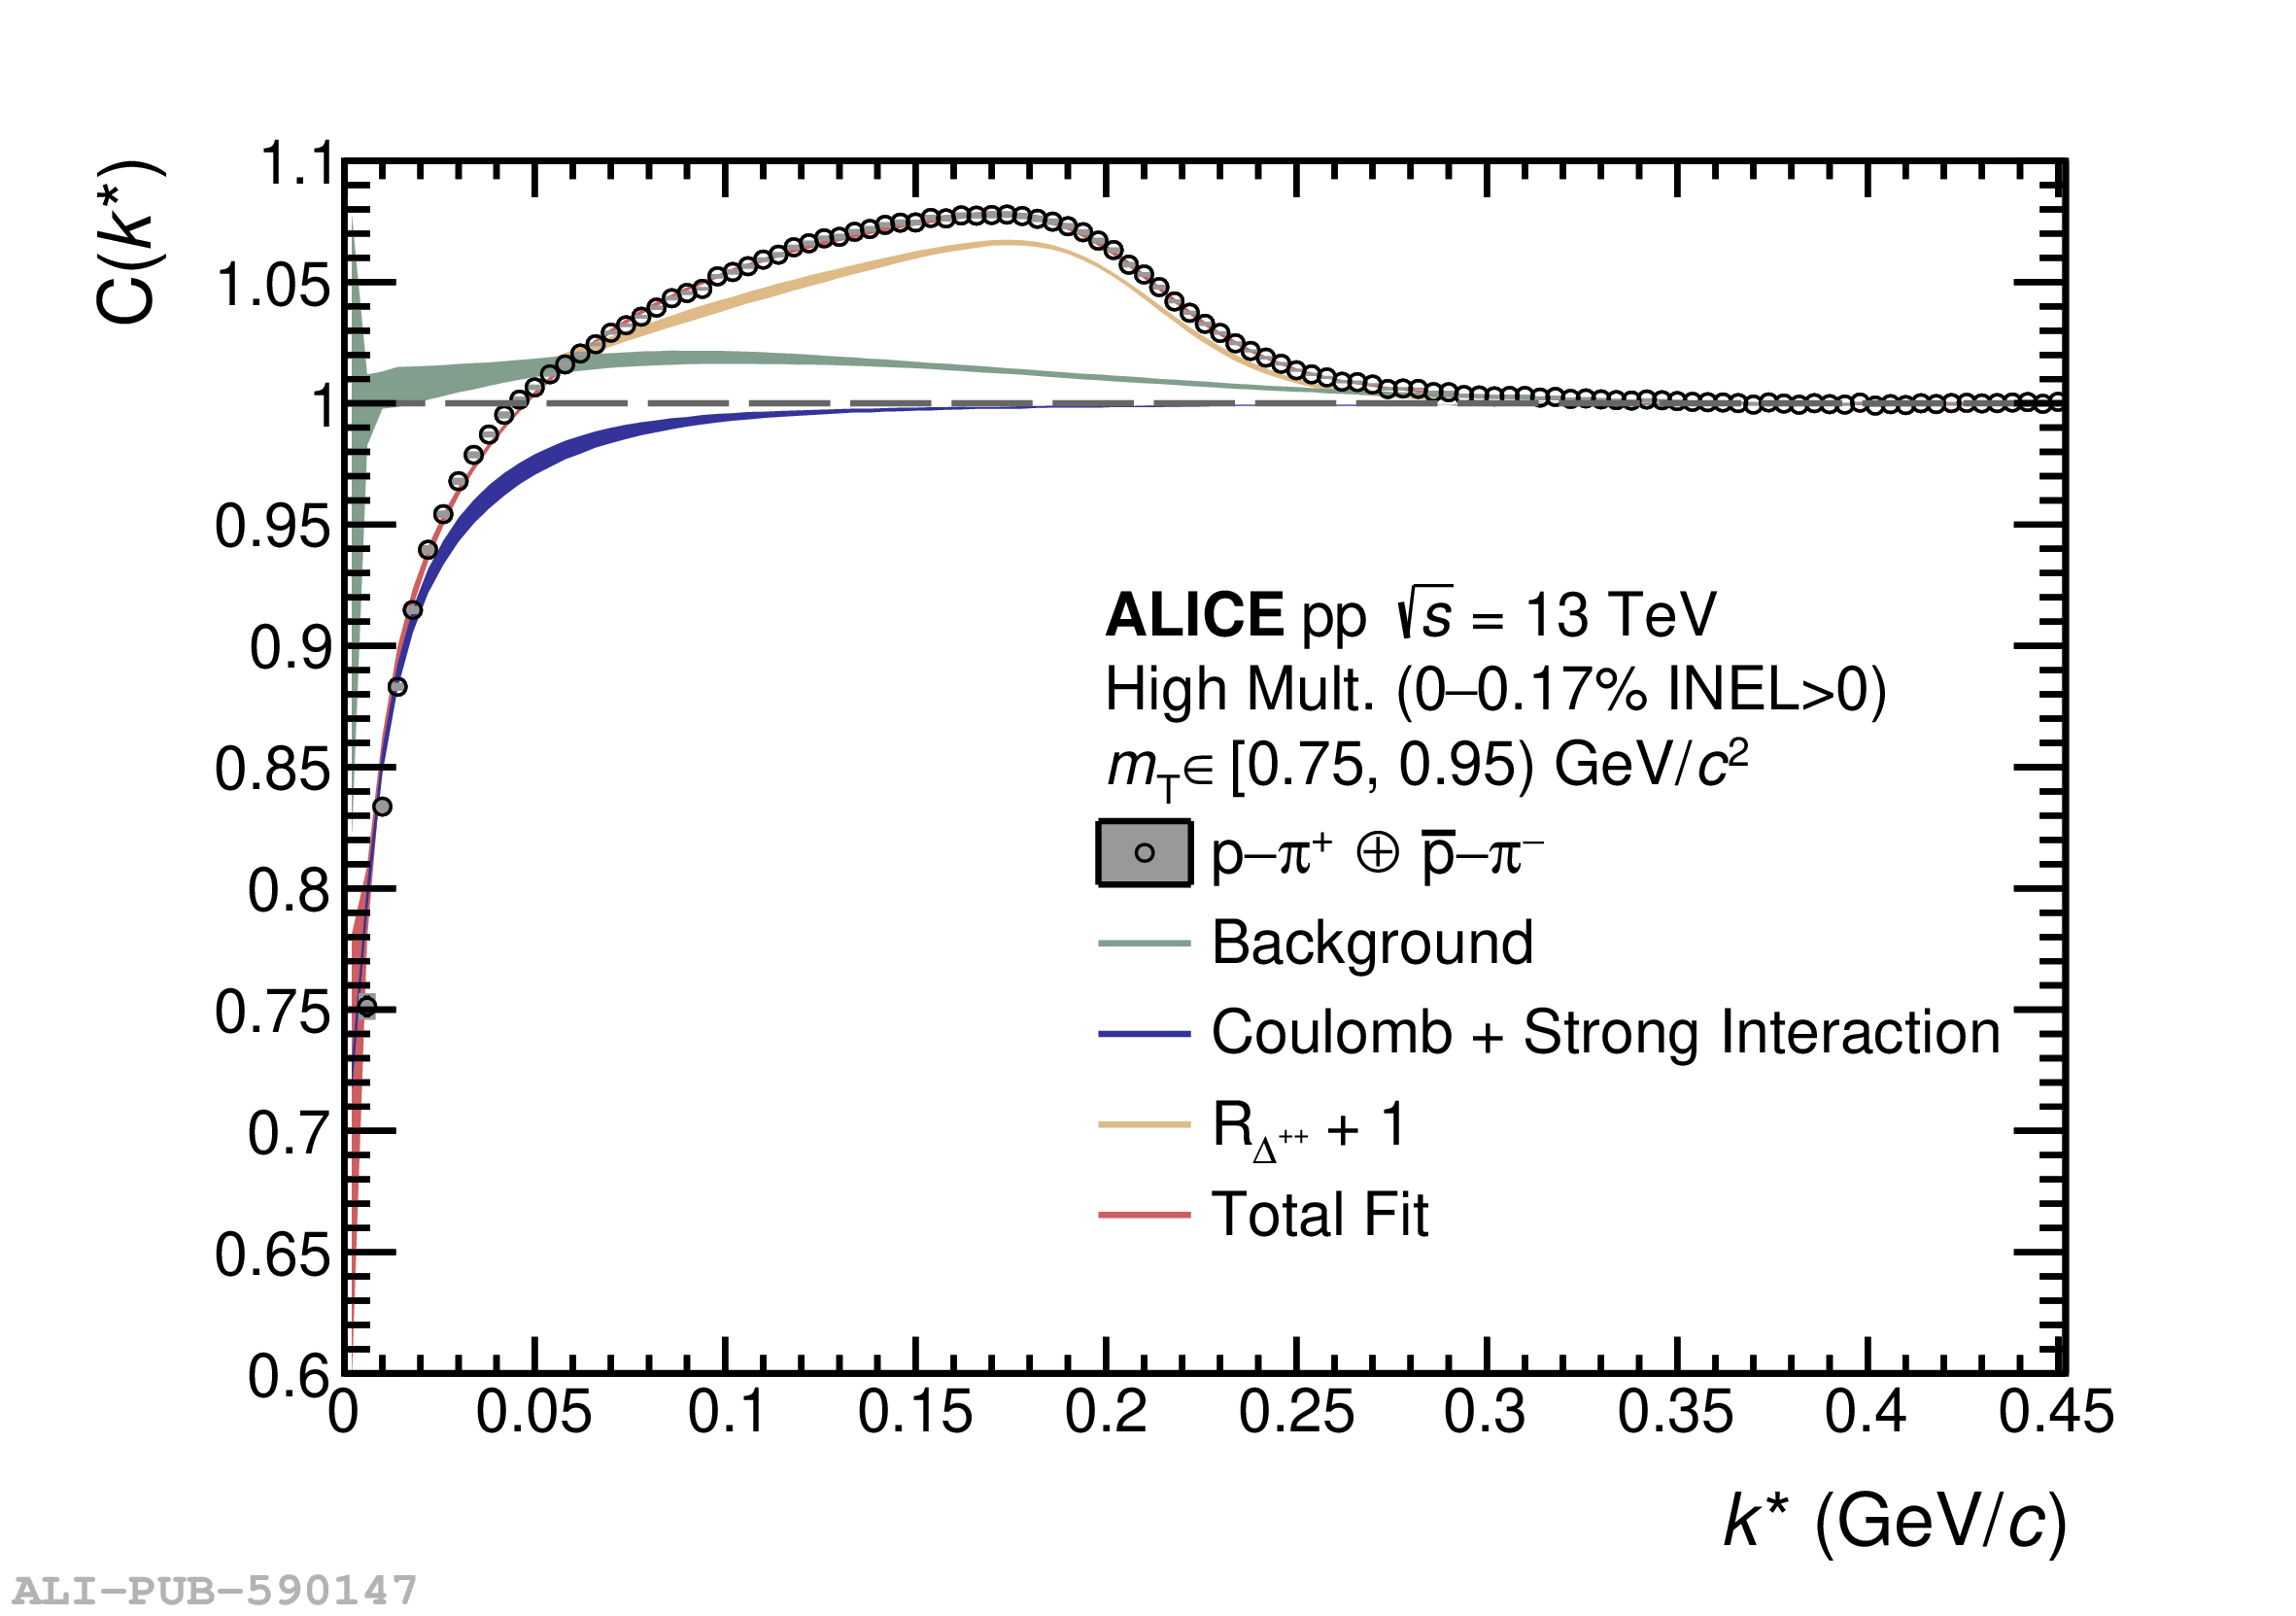   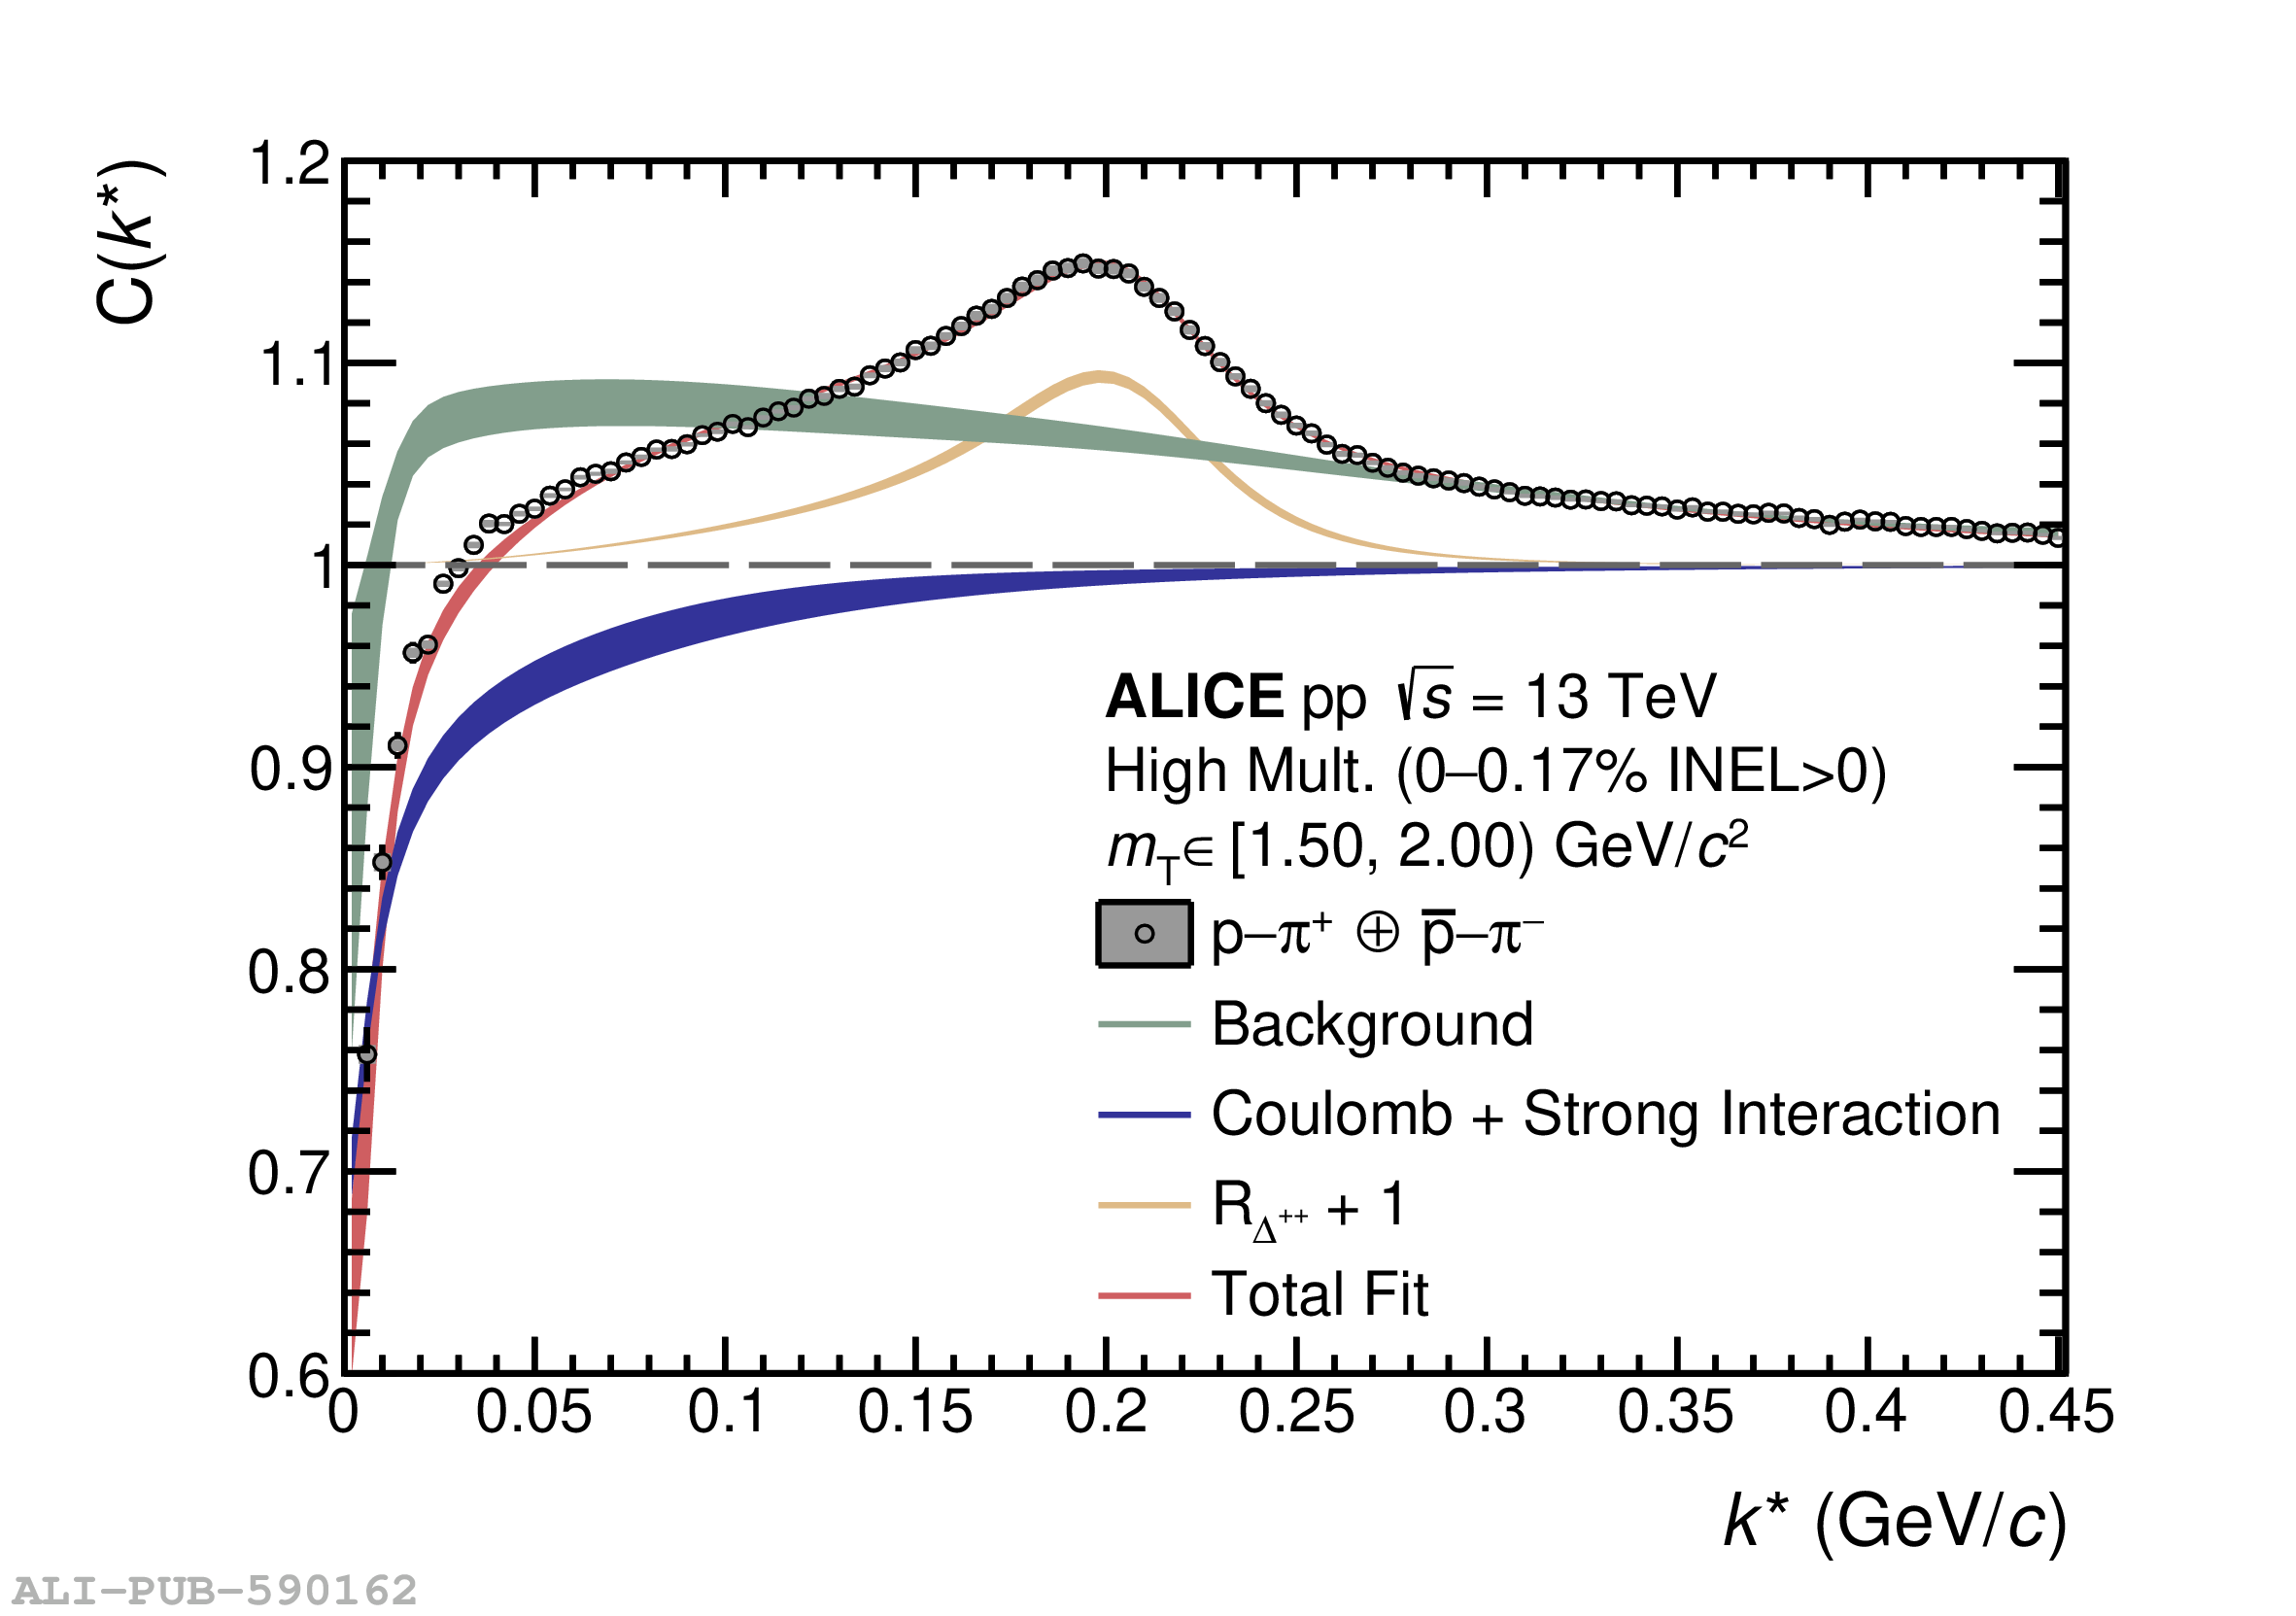 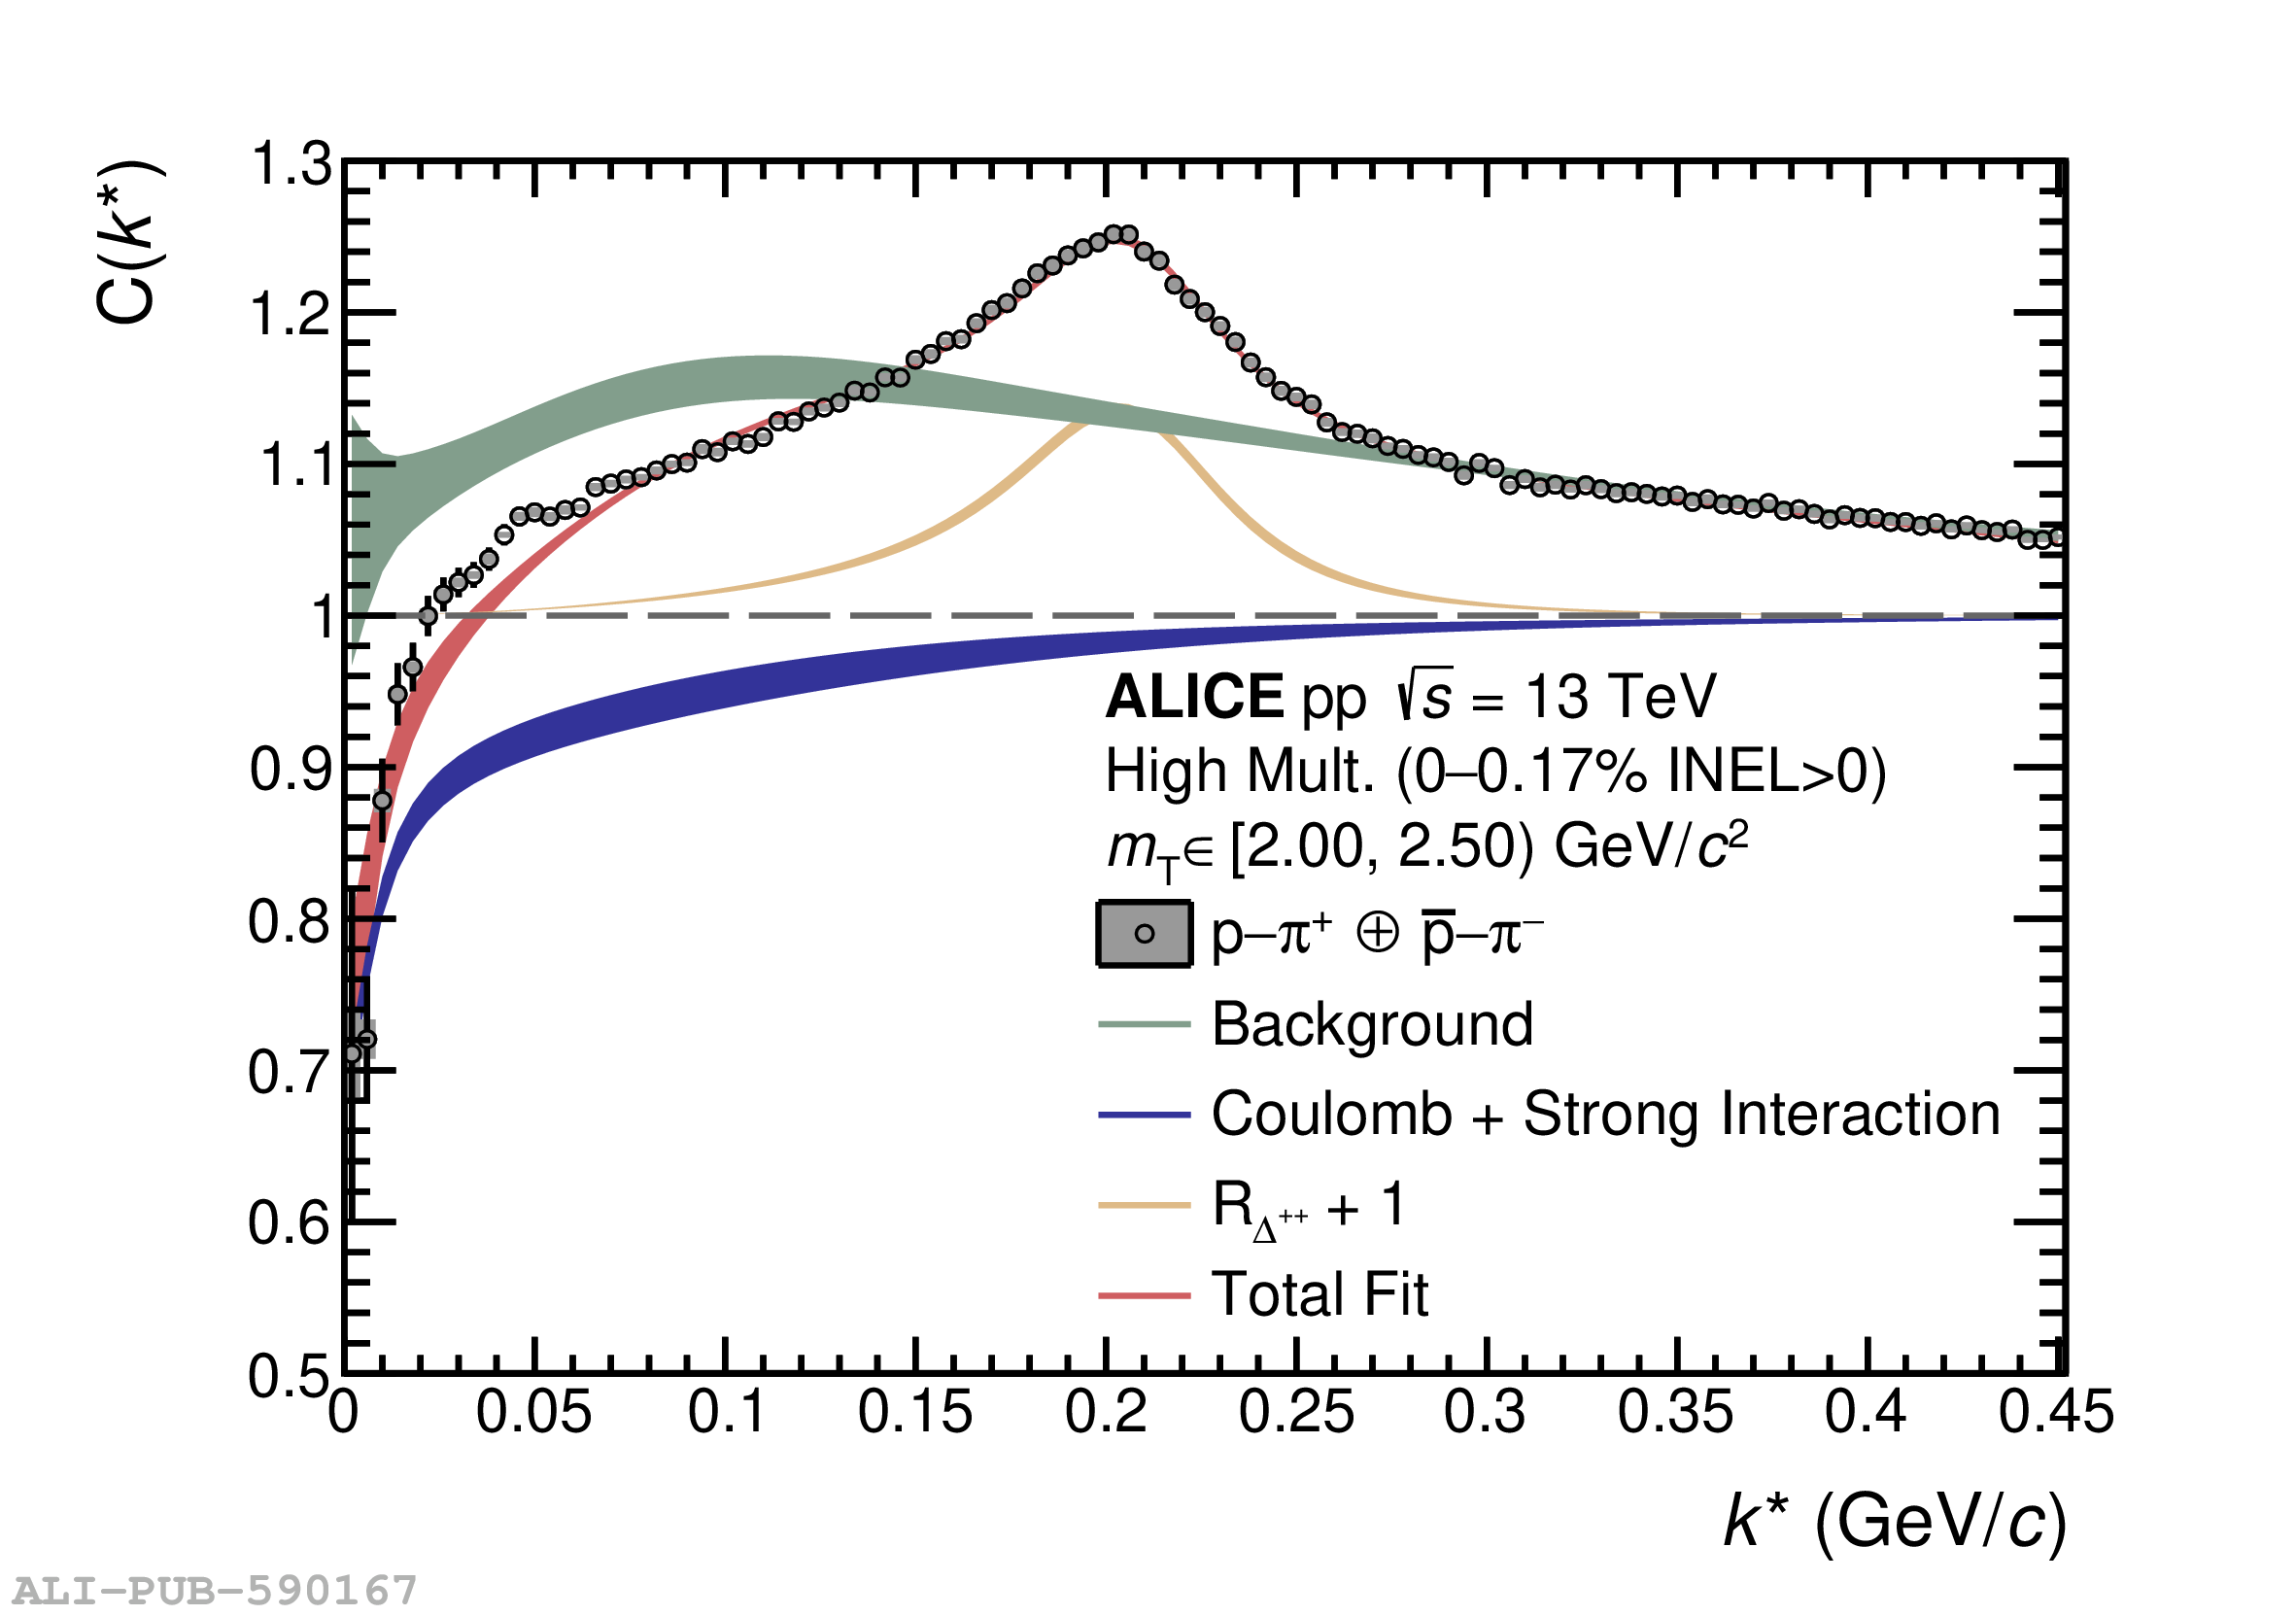 |