J/$ψ$-hadron correlations at midrapidity in pp collisions at $\sqrt{s}$ = 13 TeV

We report on the measurement of inclusive, non-prompt, and prompt J/$\psi$-hadron correlations by the ALICE Collaboration at the CERN Large Hadron Collider in pp collisions at a center-of-mass energy of 13 TeV. The correlations are studied at midrapidity ($|y| <~ 0.9$) in the transverse momentum ranges $p_{\rm T} <~ 40~\text{GeV}/c$ for the J/$\psi$ and $0.15 <~ p_{\rm T} <~ 10$ GeV/$c$ and $|\eta|<~0.9$ for the associated hadrons. The measurement is based on minimum bias and high multiplicity data samples corresponding to integrated luminosities of $L_{\text{int}} = 34~\text{nb}^{-1}$ and $L_{\text{int}} = 6.9~\text{pb}^{-1}$, respectively. In addition, two more data samples are employed, requiring, on top of the minimum bias condition, a threshold on the tower energy of $E = 4$ and $9~\text{GeV}$ in the ALICE electromagnetic calorimeters, which correspond to integrated luminosities of $L_{\text{int}} = 0.9~\text{pb}^{-1}$ and $L_{\text{int}} = 8.4~\text{pb}^{-1}$, respectively. The results are presented as associated hadron yields per J/$\psi$ trigger as a function of the azimuthal angle difference between the associated hadrons and J/$\psi$ mesons. The integrated near-side and away-side correlated yields are also extracted as a function of the J/$\psi$ transverse momentum. The measurements are discussed in comparison to PYTHIA calculations.


Submitted to: JHEP
e-Print: arXiv:2409.04364 | PDF | inSPIRE
CERN-EP-2024-227
Figure group

Figure 1

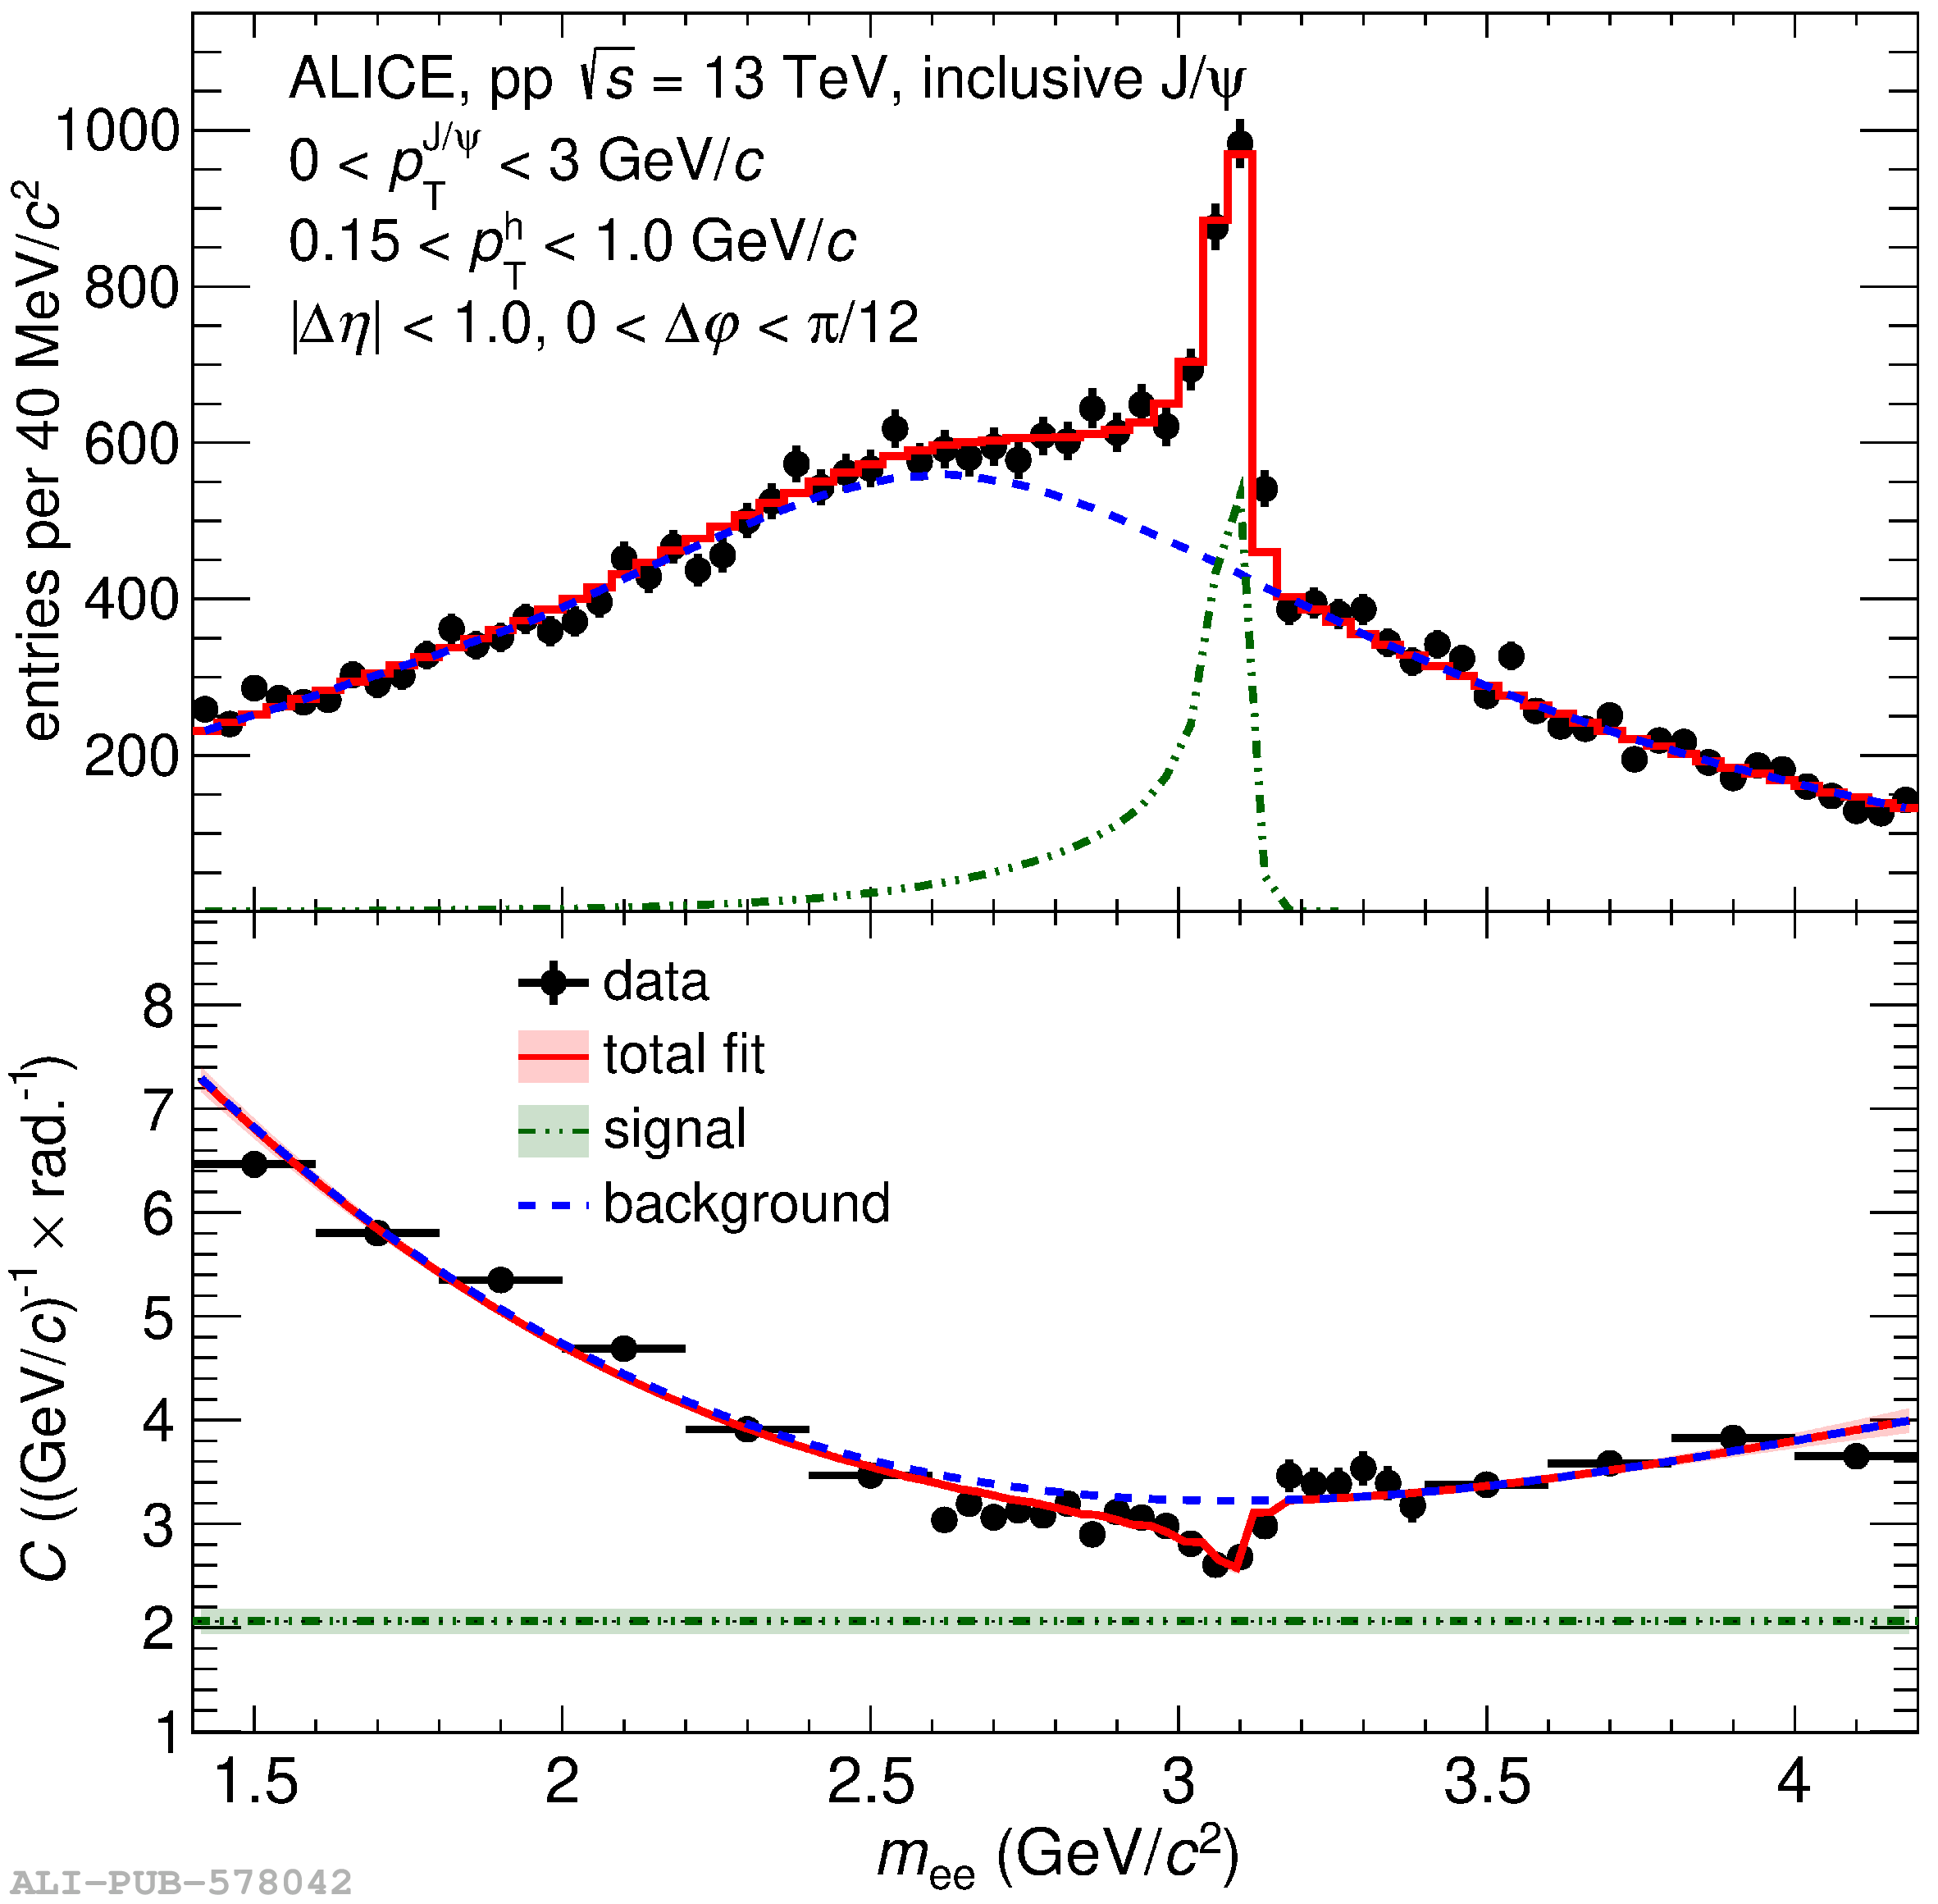
Examples of the extraction of the per trigger correlated charged hadron yield ($0.15< p_{\rm T}^{\rm h} < 1.0$ GeV/c) for inclusive J/$\psi$ in the $p_{\rm T}$ ranges $0 < p_{\rm T}^{J/\psi} < 3$ GeV/c (left) and $8 < p_{\rm T}^{\rm J/\psi} < 15$ GeV/c (right) for $|\Delta\eta|< 1$ and $0 < \Delta\varphi < \pi/12$. The top panels show the invariant mass distribution of the dielectrons with the signal and background components as described in Sec. 3.2. The bottom panels show the invariant mass dependence of the charged hadrons correlated yield. The total fit function ($C_{m_{ee}}$), the signal ($C_{\rm J/\psi}$) and the total background ($C_{\rm bkg}(m_{ee})$) components as defined in Eq.2 are also shown. The band around the total fit function in the bottom panels shows the 1$\sigma$ confidence interval.

Figure 2

Simultaneous fit of the dielectron invariant mass and pseudo-proper decay length two-dimensional distribution in the $8 < p_{\rm T}^{\rm J/\psi} < 15$ GeV/c interval. Left: projection on the invariant mass axis. Right: Projection on the pseudo-proper decay length axis. The various components of the fit are also shown. The vertical black line at $x\approx$100 ${\mu}$m shows the lower cut value selecting a non-prompt J/$\psi$ sample with less than 10% contamination from prompt J/$\psi$.

Figure 3

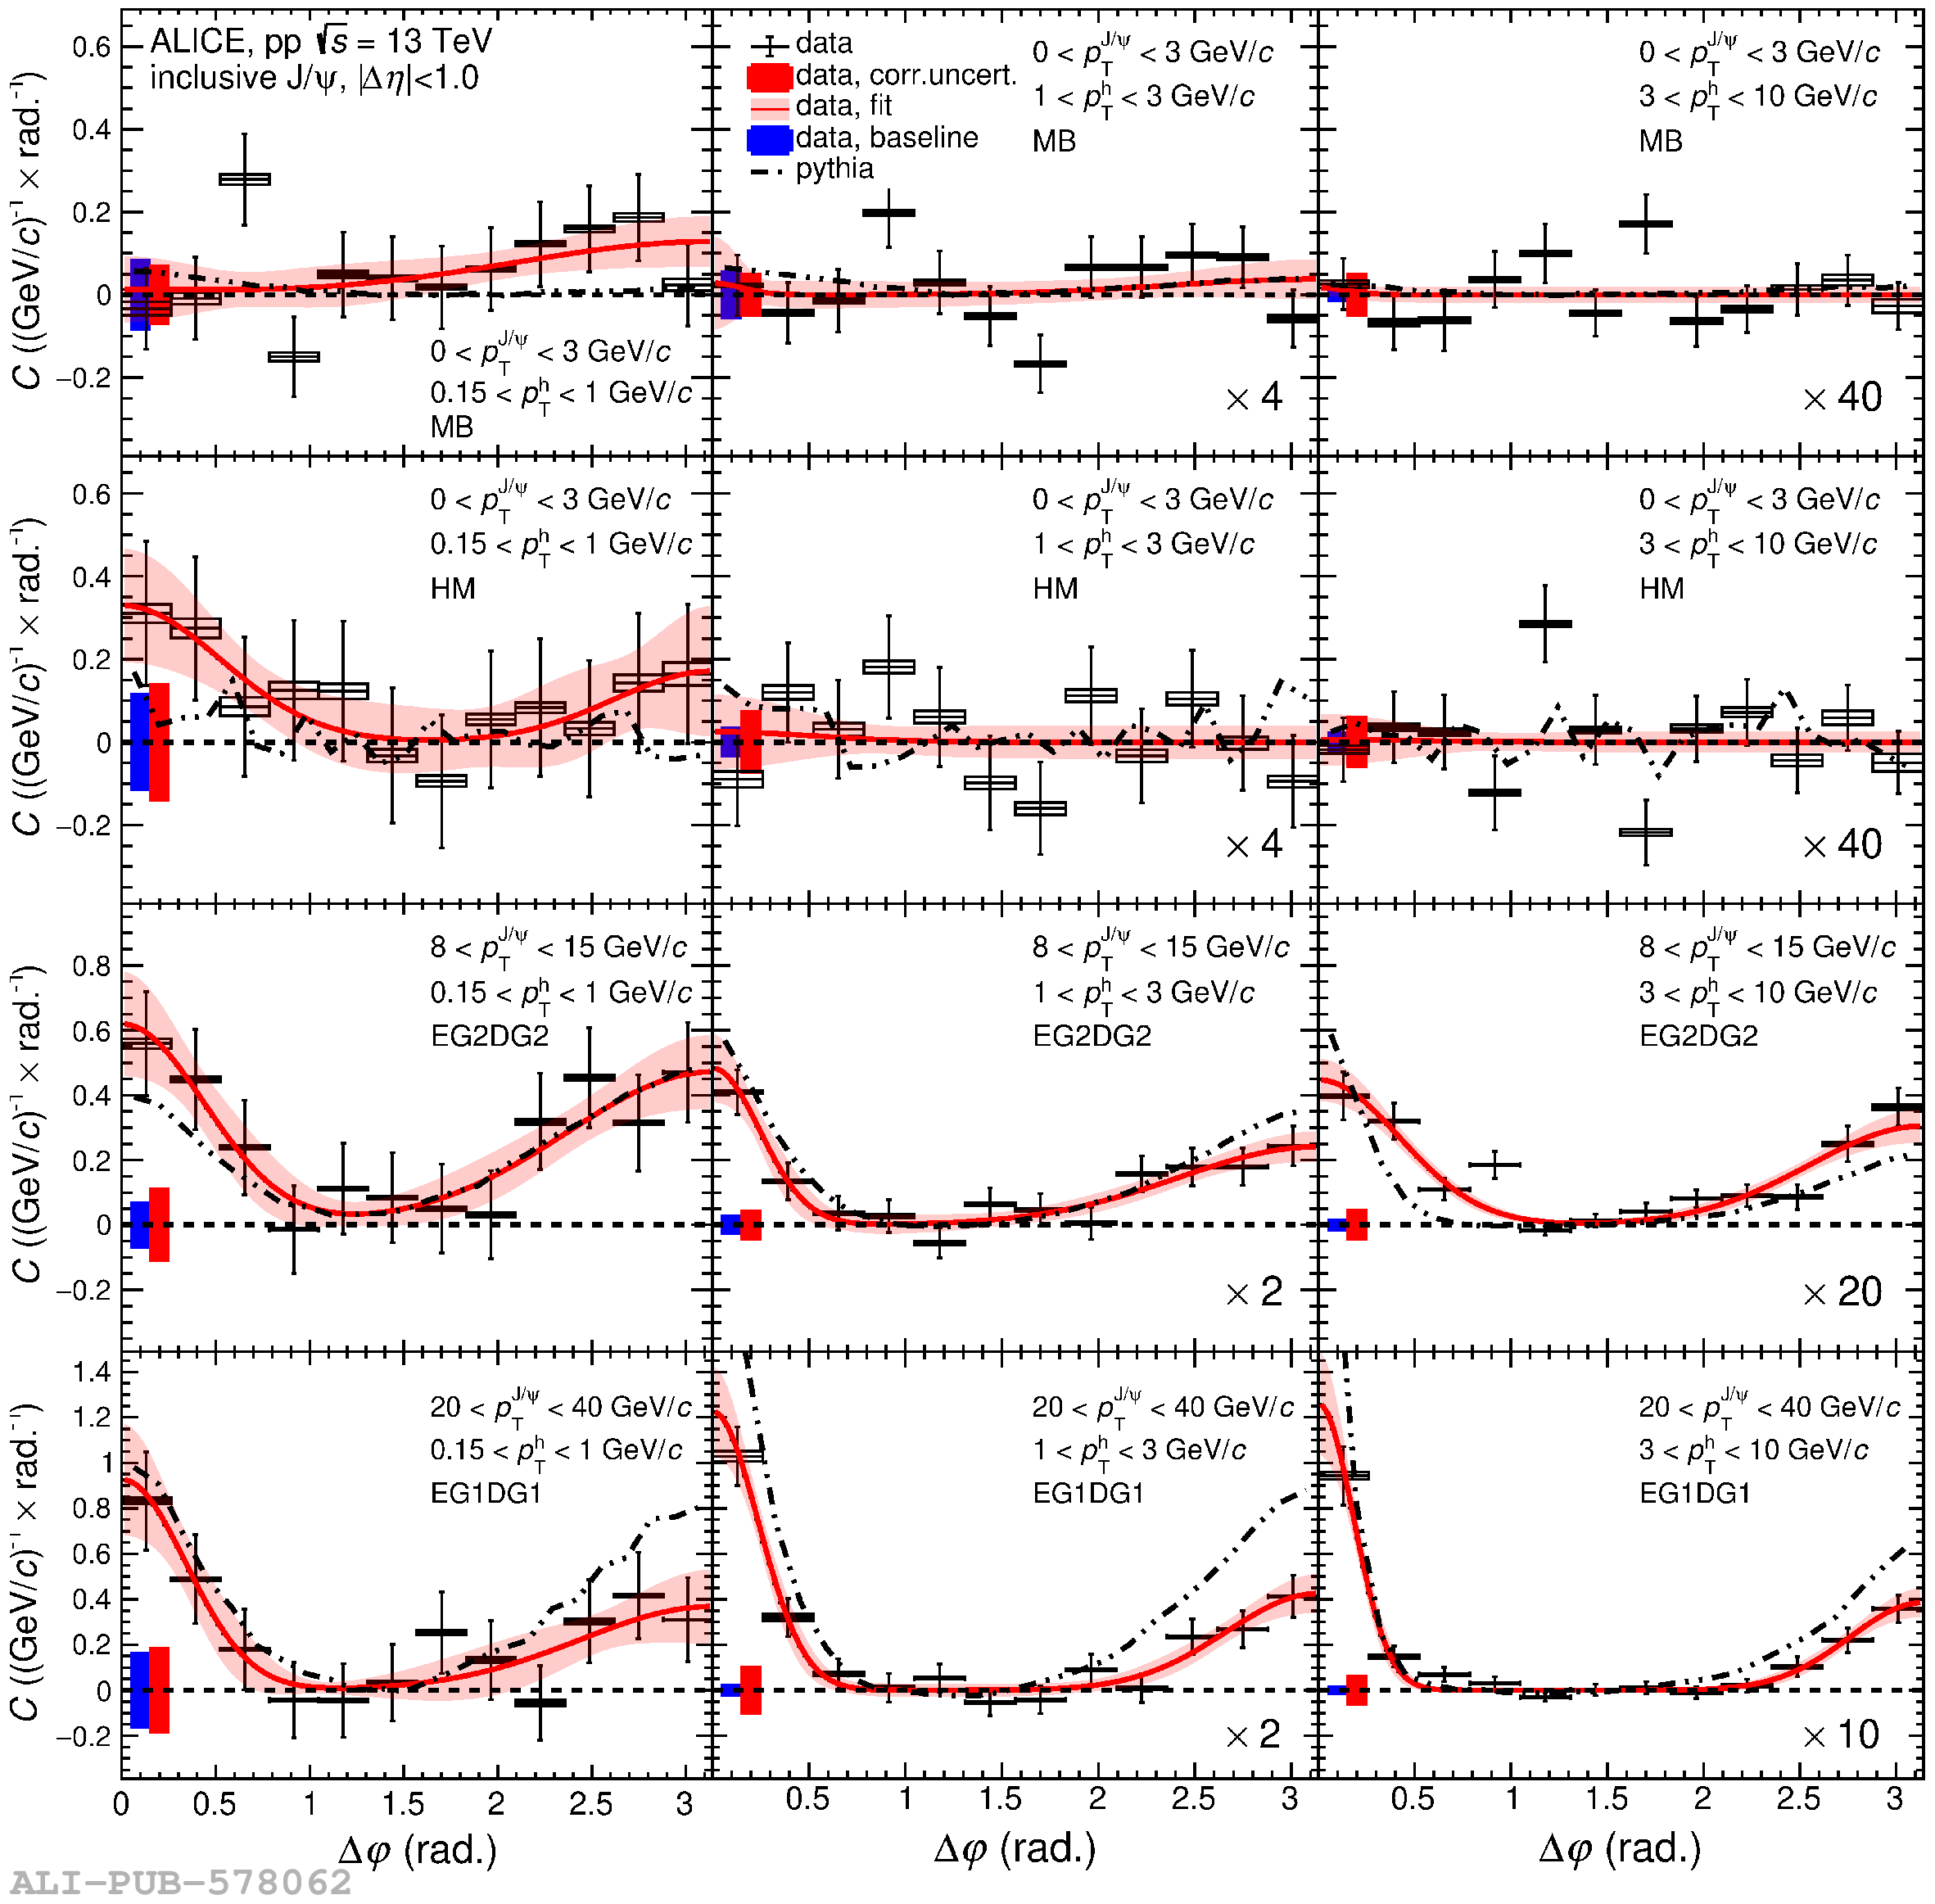
Baseline-subtracted inclusive J/$\psi$-hadron correlation functions corresponding, from top to bottom, to the MB, HM, EG2DG2, and EG1DG1 event triggers. The differential correlated yields are normalized per radian and per GeV/c. From left to right, the associated-hadron $p_{\rm T}$ intervals are $0.15 < p_{\rm T}^{\rm h} < 1$ GeV/c, $1 < p_{\rm T}^{\rm h} < 3$ GeV/c and $3 < p_{\rm T}^{\rm h} < 10$ GeV/c. For better visibility, the middle and right panel correlation functions are scaled by a factor, given in the lower right corner of each panel. The error bars on the data points indicate statistical uncertainties while the boxes show the uncorrelated systematic uncertainties. The correlated systematic and the baseline uncertainties are shown as filled boxes around 0. The fit of the data using Eq.5 is indicated by the red solid line while the band around the fit shows the 1$\sigma$ confidence interval. Calculations using PYTHIA are shown as black dash-dotted lines.

Figure 4

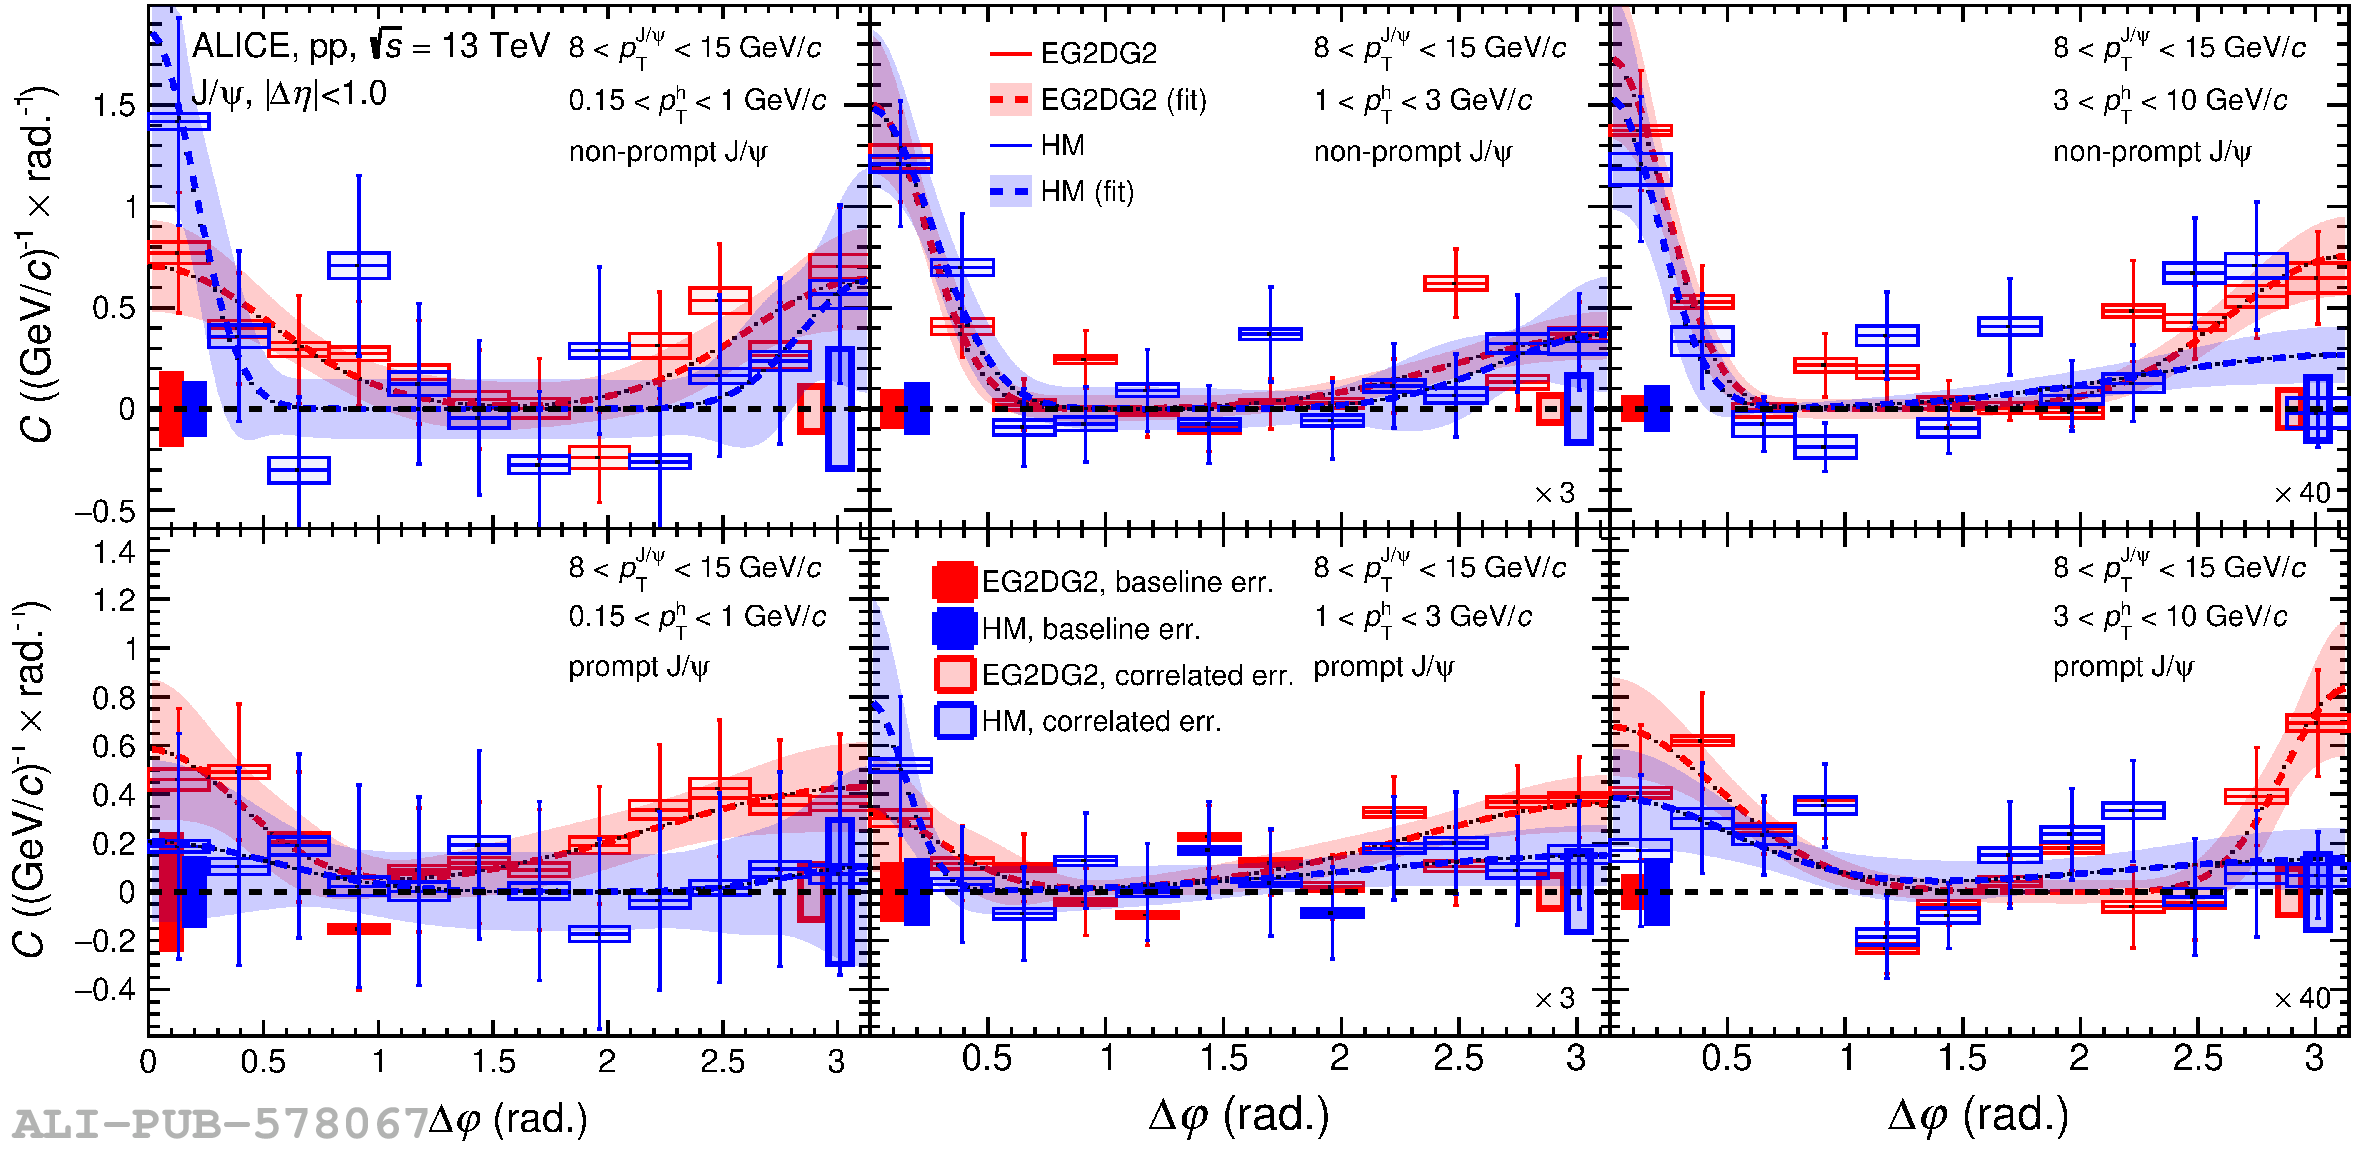
Baseline subtracted non-prompt (top panels) and prompt (bottom panels) J/$\psi$-hadron correlation functions obtained using the EG2DG2 (red), and HM (blue) triggers for J/$\psi$ in the $p_{\rm T}$ interval $8 < p_{\rm T}^{\rm J/\psi} < 15$ GeV/c and associated hadrons in the $p_{\rm T}$ intervals $0.15 < p_{\rm T}^{\rm h} < 1$, $1 < p_{\rm T}^{\rm h} < 3$ and $3 < p_{\rm T}^{\rm h} < 10$ GeV/c. The differential correlated yields are normalized per radian and per GeV/c. Baseline and correlated uncertainties are shown as boxes around 0, while fits of the correlation functions with Eq.5 are shown as a dashed line with a colored band, which represent the 1$\sigma$ fit uncertainties.

Figure 5

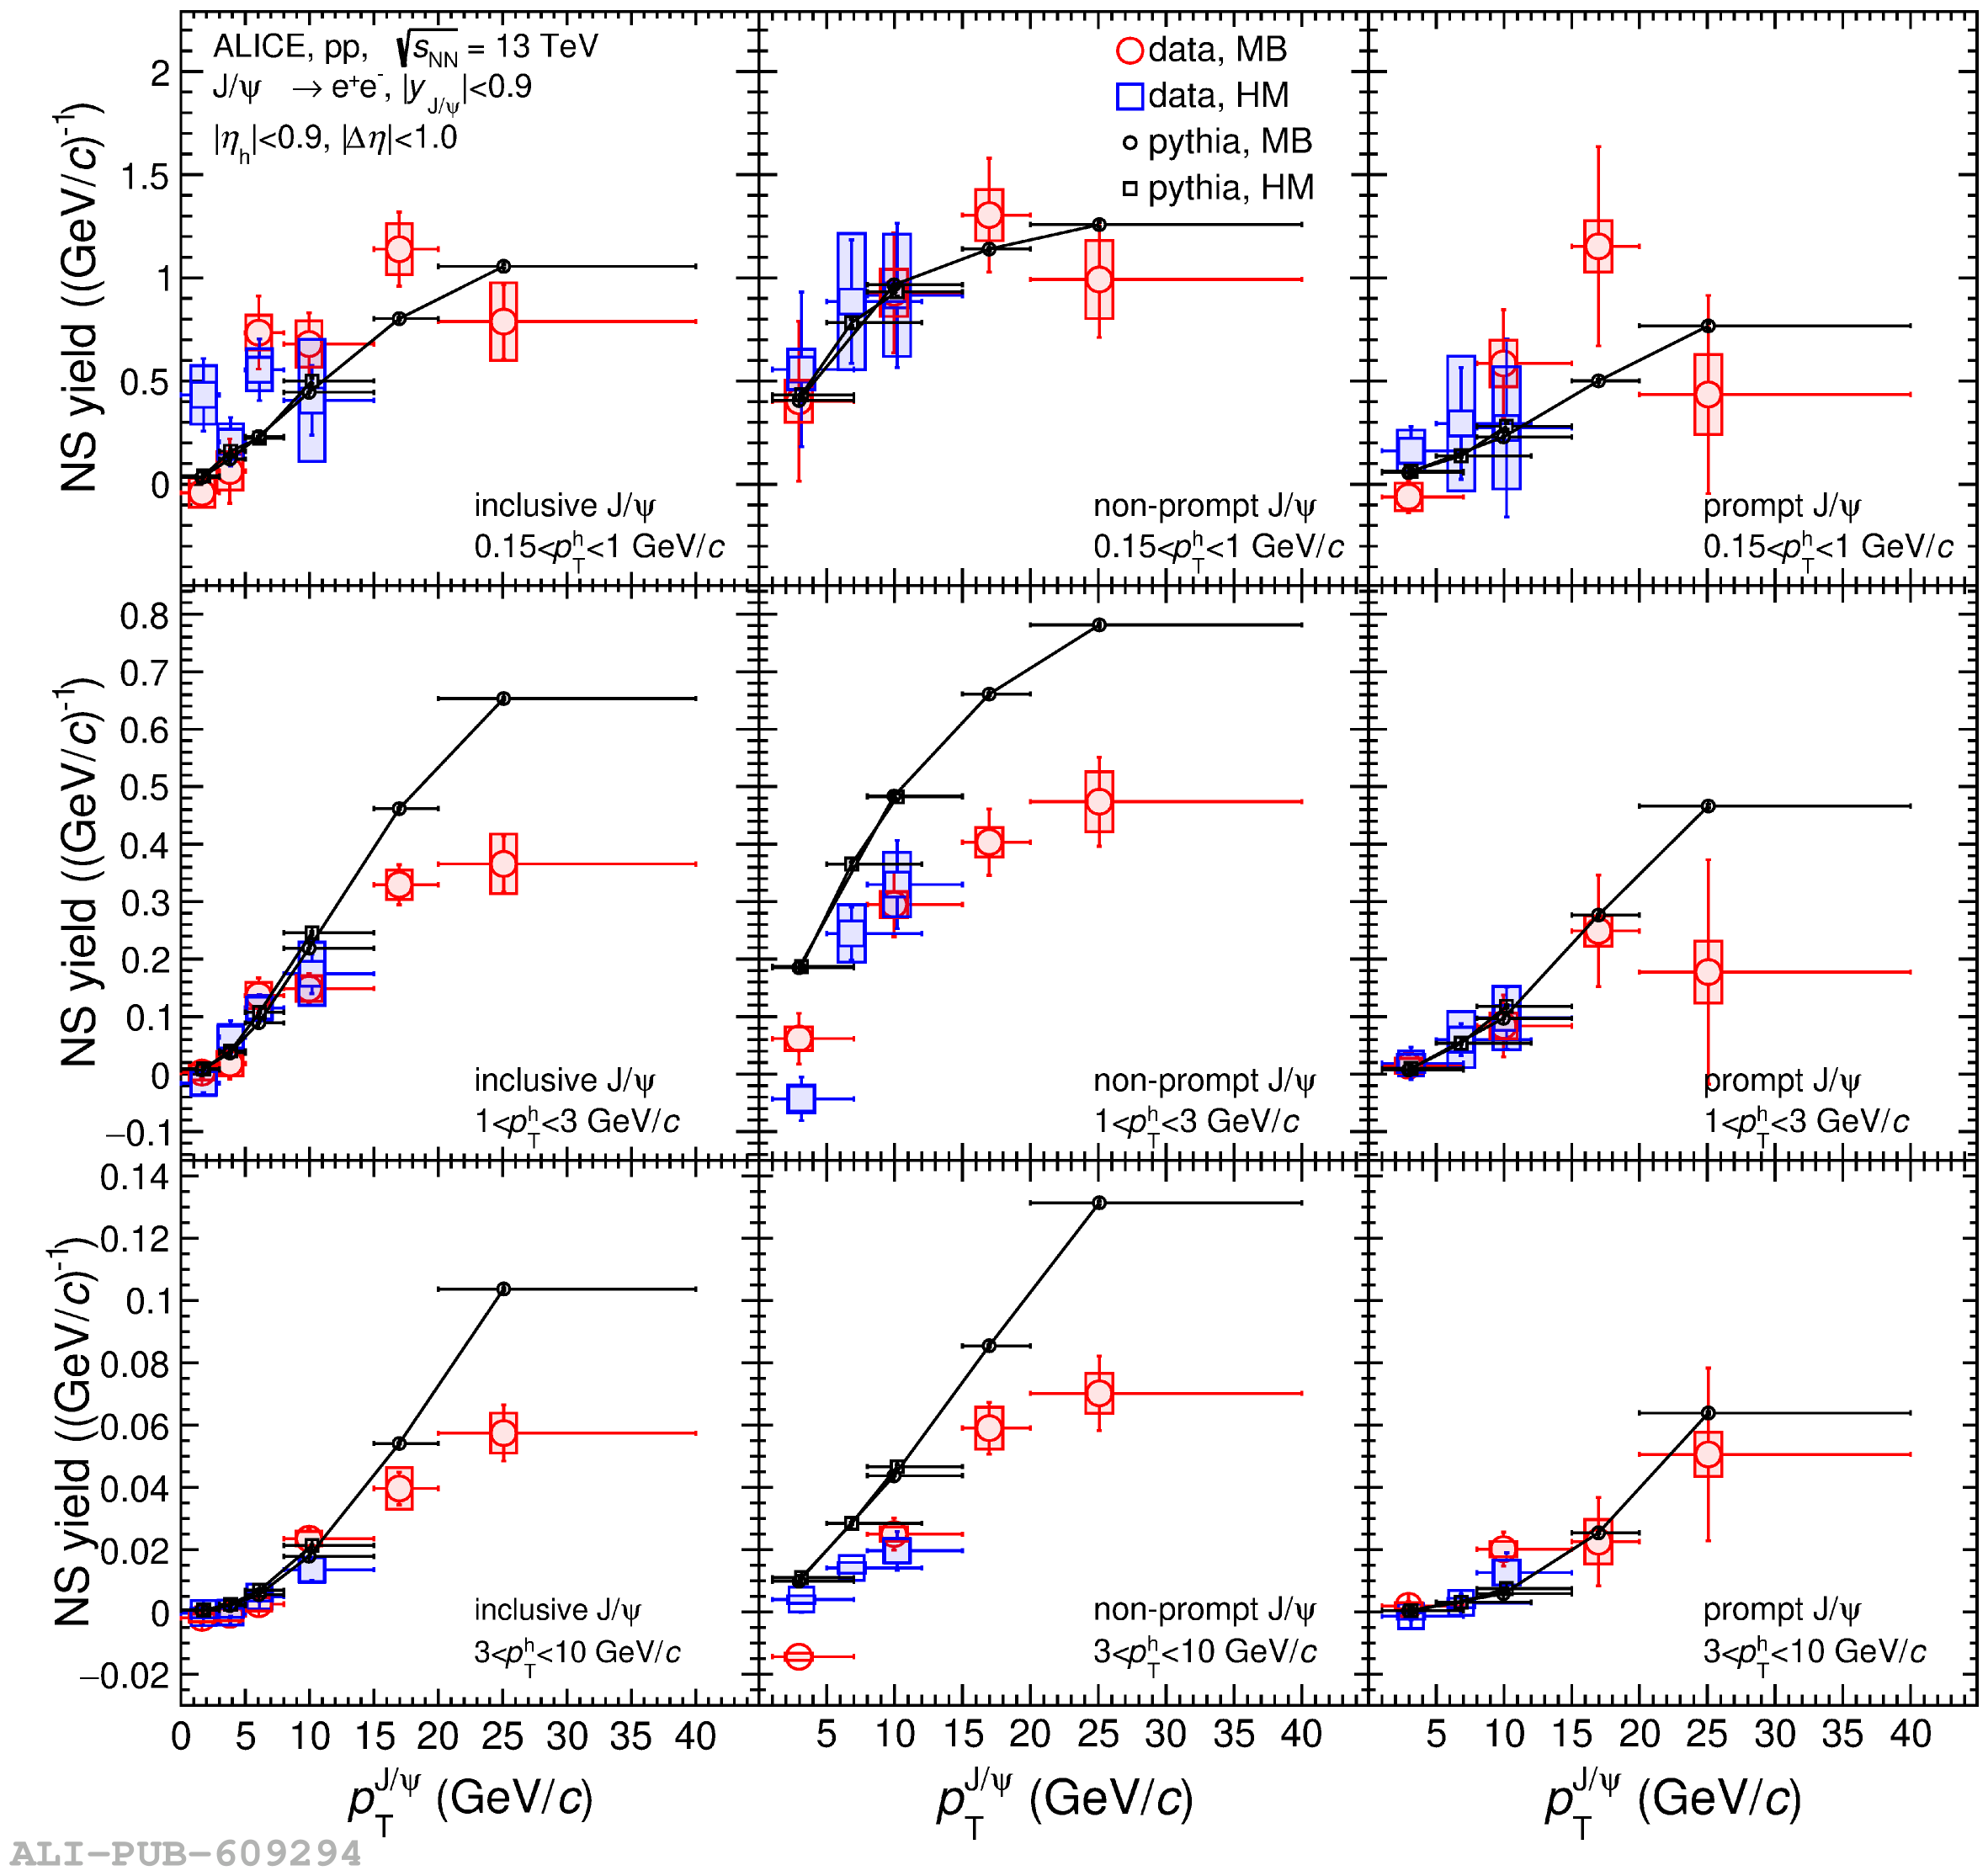
Near-side correlated particle yields as a function of the J/$\psi$ trigger $p_{\rm T}$. The left, middle, and right panels correspond to the inclusive, non-prompt, and prompt J/$\psi$, respectively. The top, middle, and bottom panels correspond to the three associated $p_{\rm T}$ intervals. Error bars on the data points represent statistical uncertainties, while the boxes represent systematic uncertainties. The data points are plotted at the average J/$\psi$ $p_{\rm T}$ in each particular trigger \pt range, while the horizontal extent of the error bars indicate the $p_{\rm T}$ interval width. The red data points include the combination of the MB, EG2DG2, and EG1DG1 triggered events (named MB in the figure legend), while the blue data points represent the HM-triggered events. The data is compared to yields obtained from PYTHIA simulations, represented with solid red (MB) and dashed-blue (HM) lines.

Figure 6

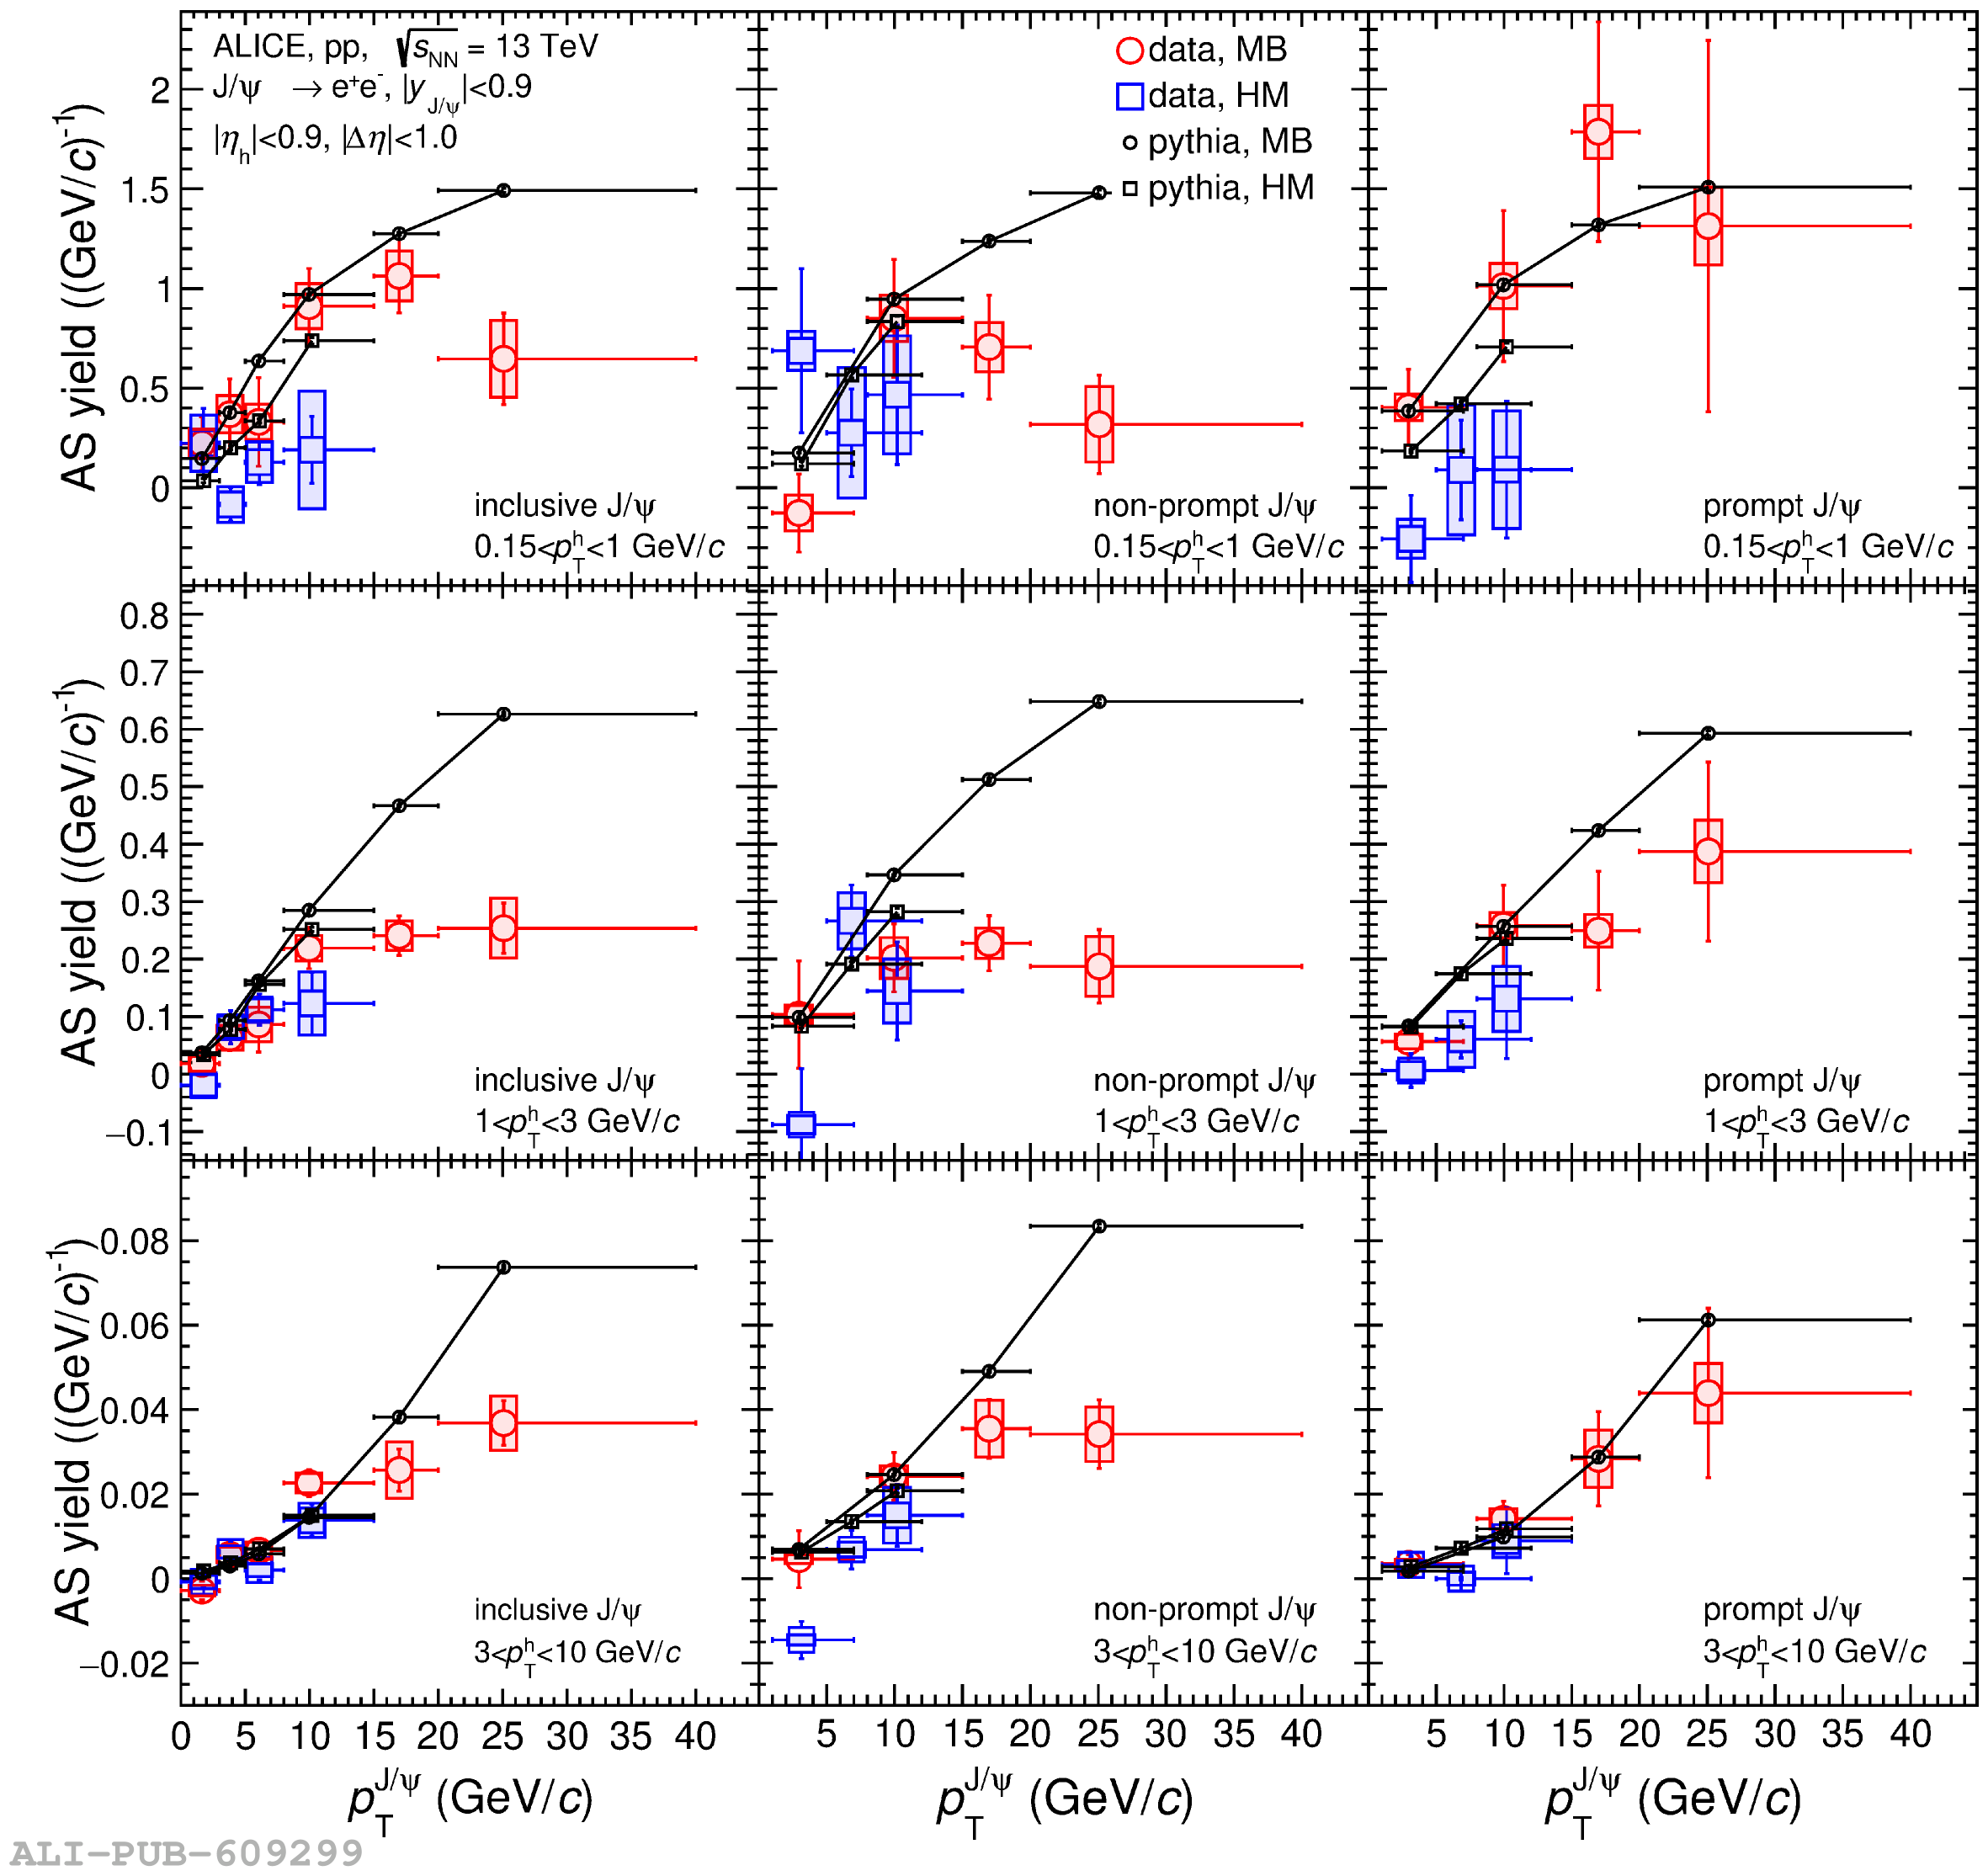
Away-side correlated particle yields as a function of the J/$\psi$ trigger $p_{\rm T}$. The left, middle, and right panels correspond to the inclusive, non-prompt, and prompt J/$\psi$, respectively. The top, middle, and bottom panels correspond to the three associated $p_{\rm T}$ intervals. Error bars on the data points represent statistical uncertainties, while the boxes represent systematic uncertainties. The data points are plotted at the average J/$\psi$ $p_{\rm T}$ in each particular trigger $p_{\rm T}$ range, while the horizontal extent of the error bars indicate the $p_{\rm T}$ interval width. The red data points include the combination of the MB, EG2DG2, and EG1DG1 triggered events (named MB in the figure legend), while the blue data points represent the HM-triggered events. The data is compared to yields obtained from PYTHIA simulations, represented with solid red (MB) and dashed-blue lines (HM).