The femtoscopic study of pairs of identical pions is particularly suited to investigate the effective source function of particle emission, due to the resulting Bose-Einstein correlation signal. In small collision systems at the LHC, pp in particular, the majority of the pions are produced in resonance decays, which significantly affect the profile and size of the source. In this work, we explicitly model this effect in order to extract the primordial source in pp collisions at $\sqrt{s}=13$ TeV from charged $π- π$ correlations measured by ALICE. We demonstrate that the assumption of a Gaussian primordial source is compatible with the data and that the effective source, resulting from modifications due to resonances, is approximately exponential, as found in previous measurements at the LHC. The universality of hadron emission in pp collisions is further investigated by applying the same methodology to characterize the primordial source of K$-$p pairs. The size of the primordial source is evaluated as a function of the transverse mass ($m_{\rm T}$) of the pairs, leading to the observation of a common scaling for both $π- π$ and K$-$p, suggesting a collective effect. Further, the present results are compatible with the $m_{\rm T}$ scaling of the p$-$p and p$-Λ$ primordial source measured by ALICE in high multiplicity pp collisions, providing additional evidence for the presence of a common emission source for all hadrons in small collision systems at the LHC. This will allow the determination of the source function for any hadron-hadron pairs with high precision, granting access to the properties of the possible final-state interaction among pairs of less abundantly produced hadrons, such as strange or charmed particles.
Eur. Phys. J. C 85, 198 (2025) and Eur. Phys. J. C 86, 12 (2026)
HEP Data
e-Print: arXiv:2311.14527 | PDF | inSPIRE
CERN-EP-2023-267
Figure group
Figure 1
Calculation of the source function (left) and corresponding \spipi correlation function (right), performed using CATS employing the RSM. The RSM (full red line) is compared to the usual assumption of an exponential (dash-dotted grey line) source distribution with a radius $r_{\mathrm{exp}}$ of the source and a purely Gaussian (dotted black line) source. | 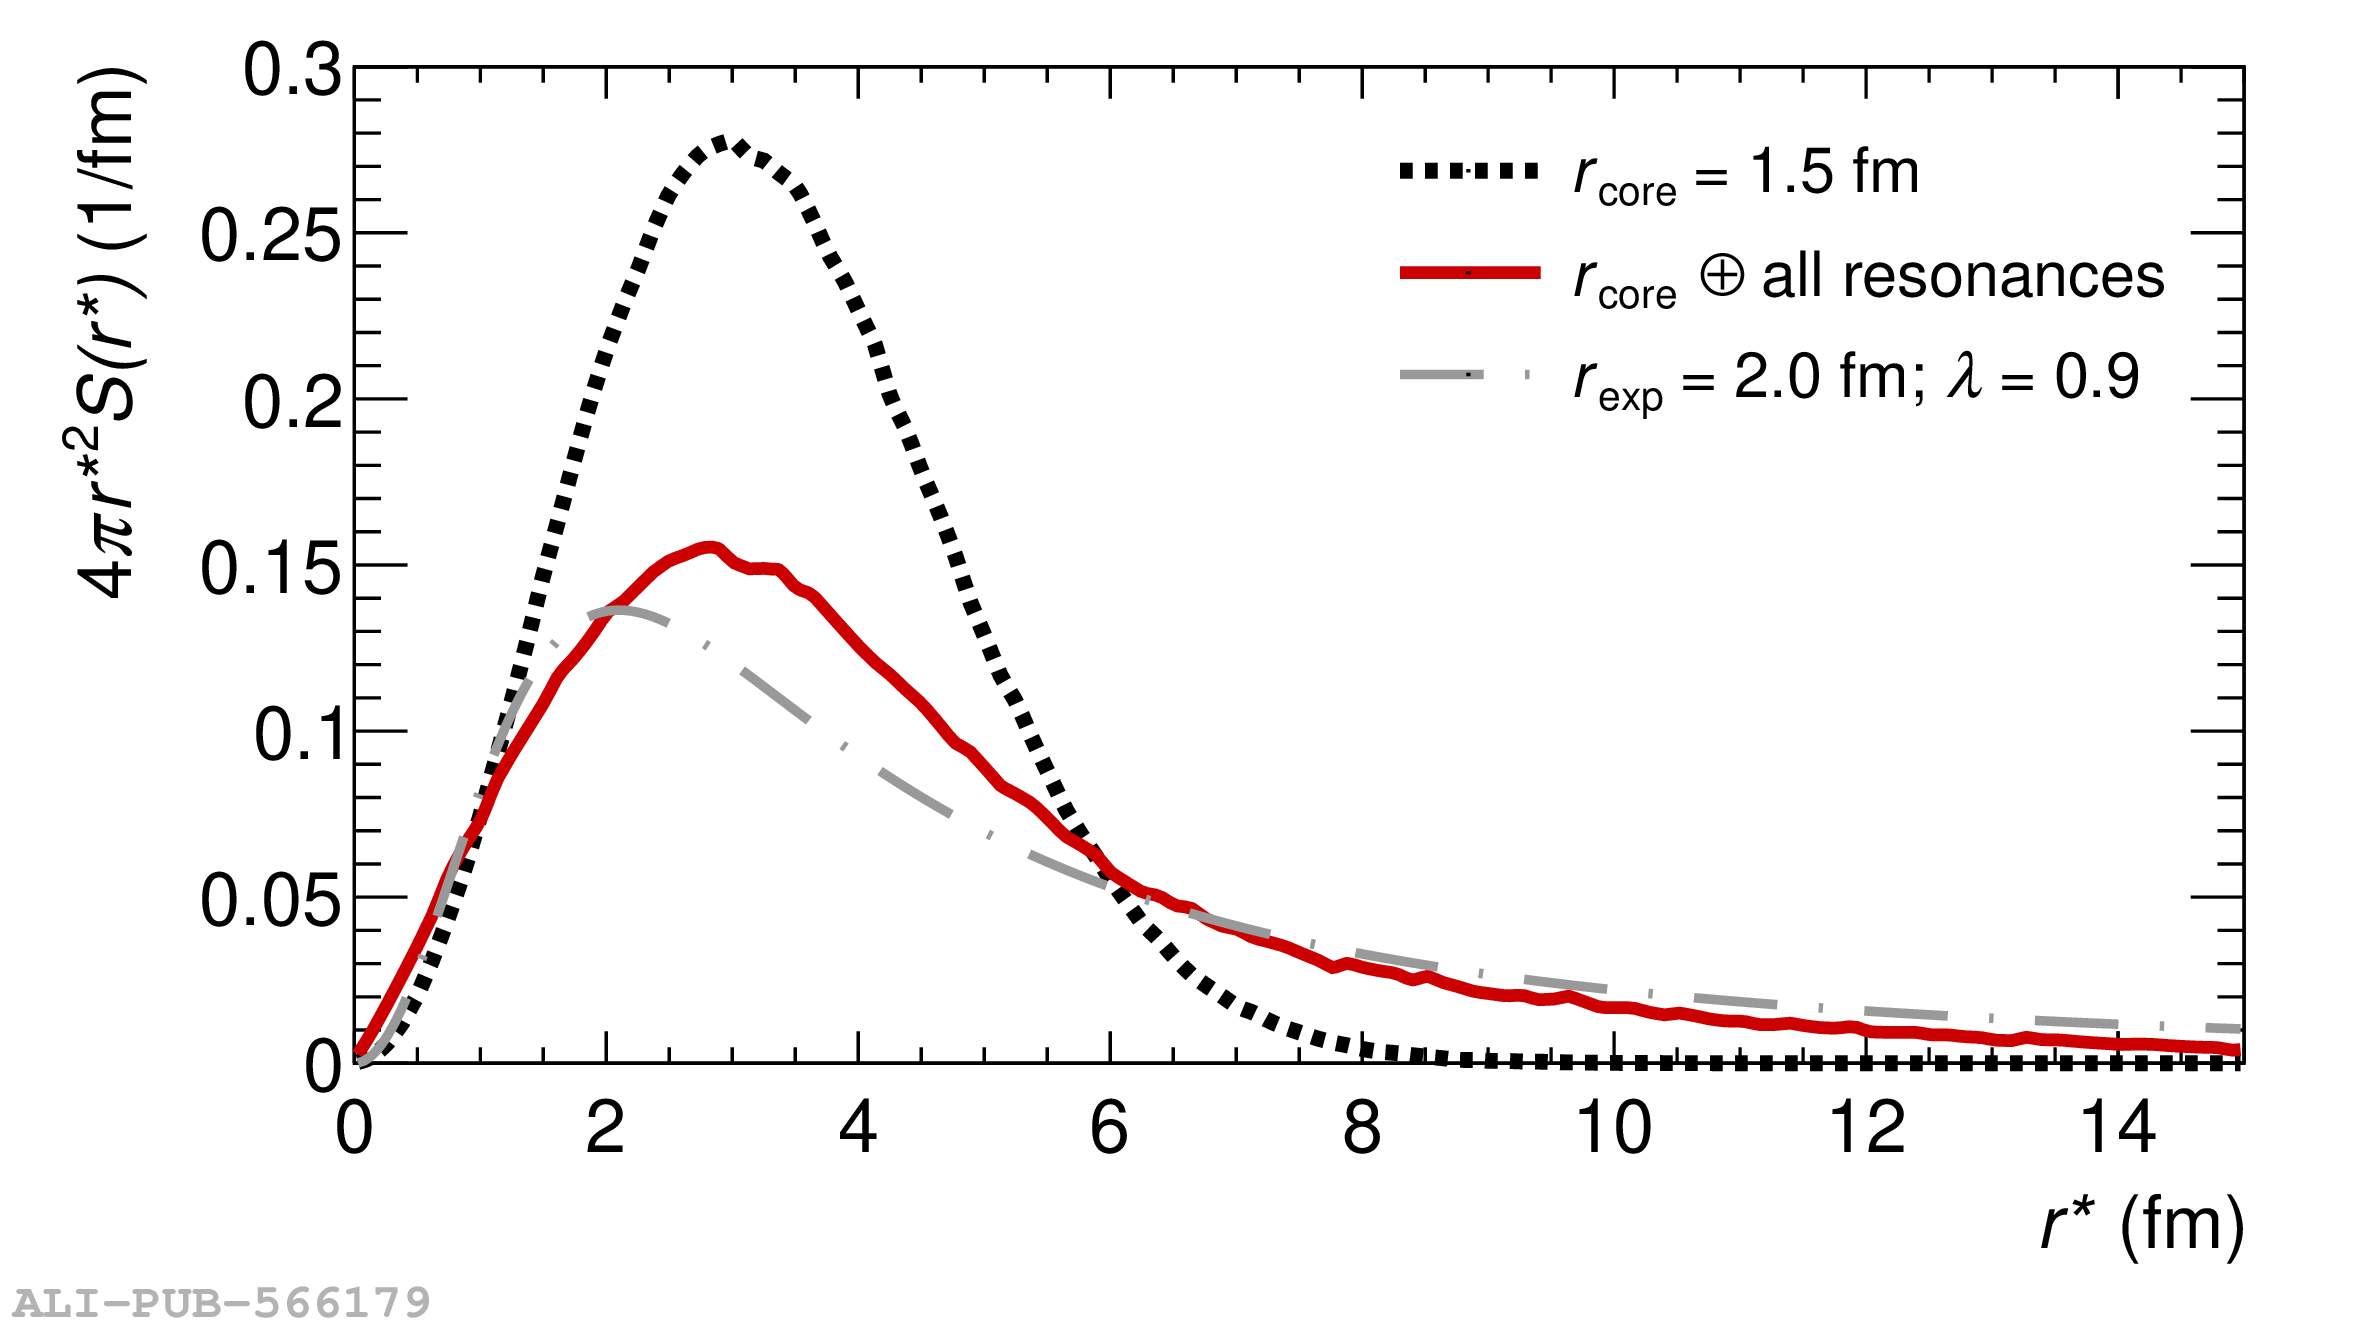 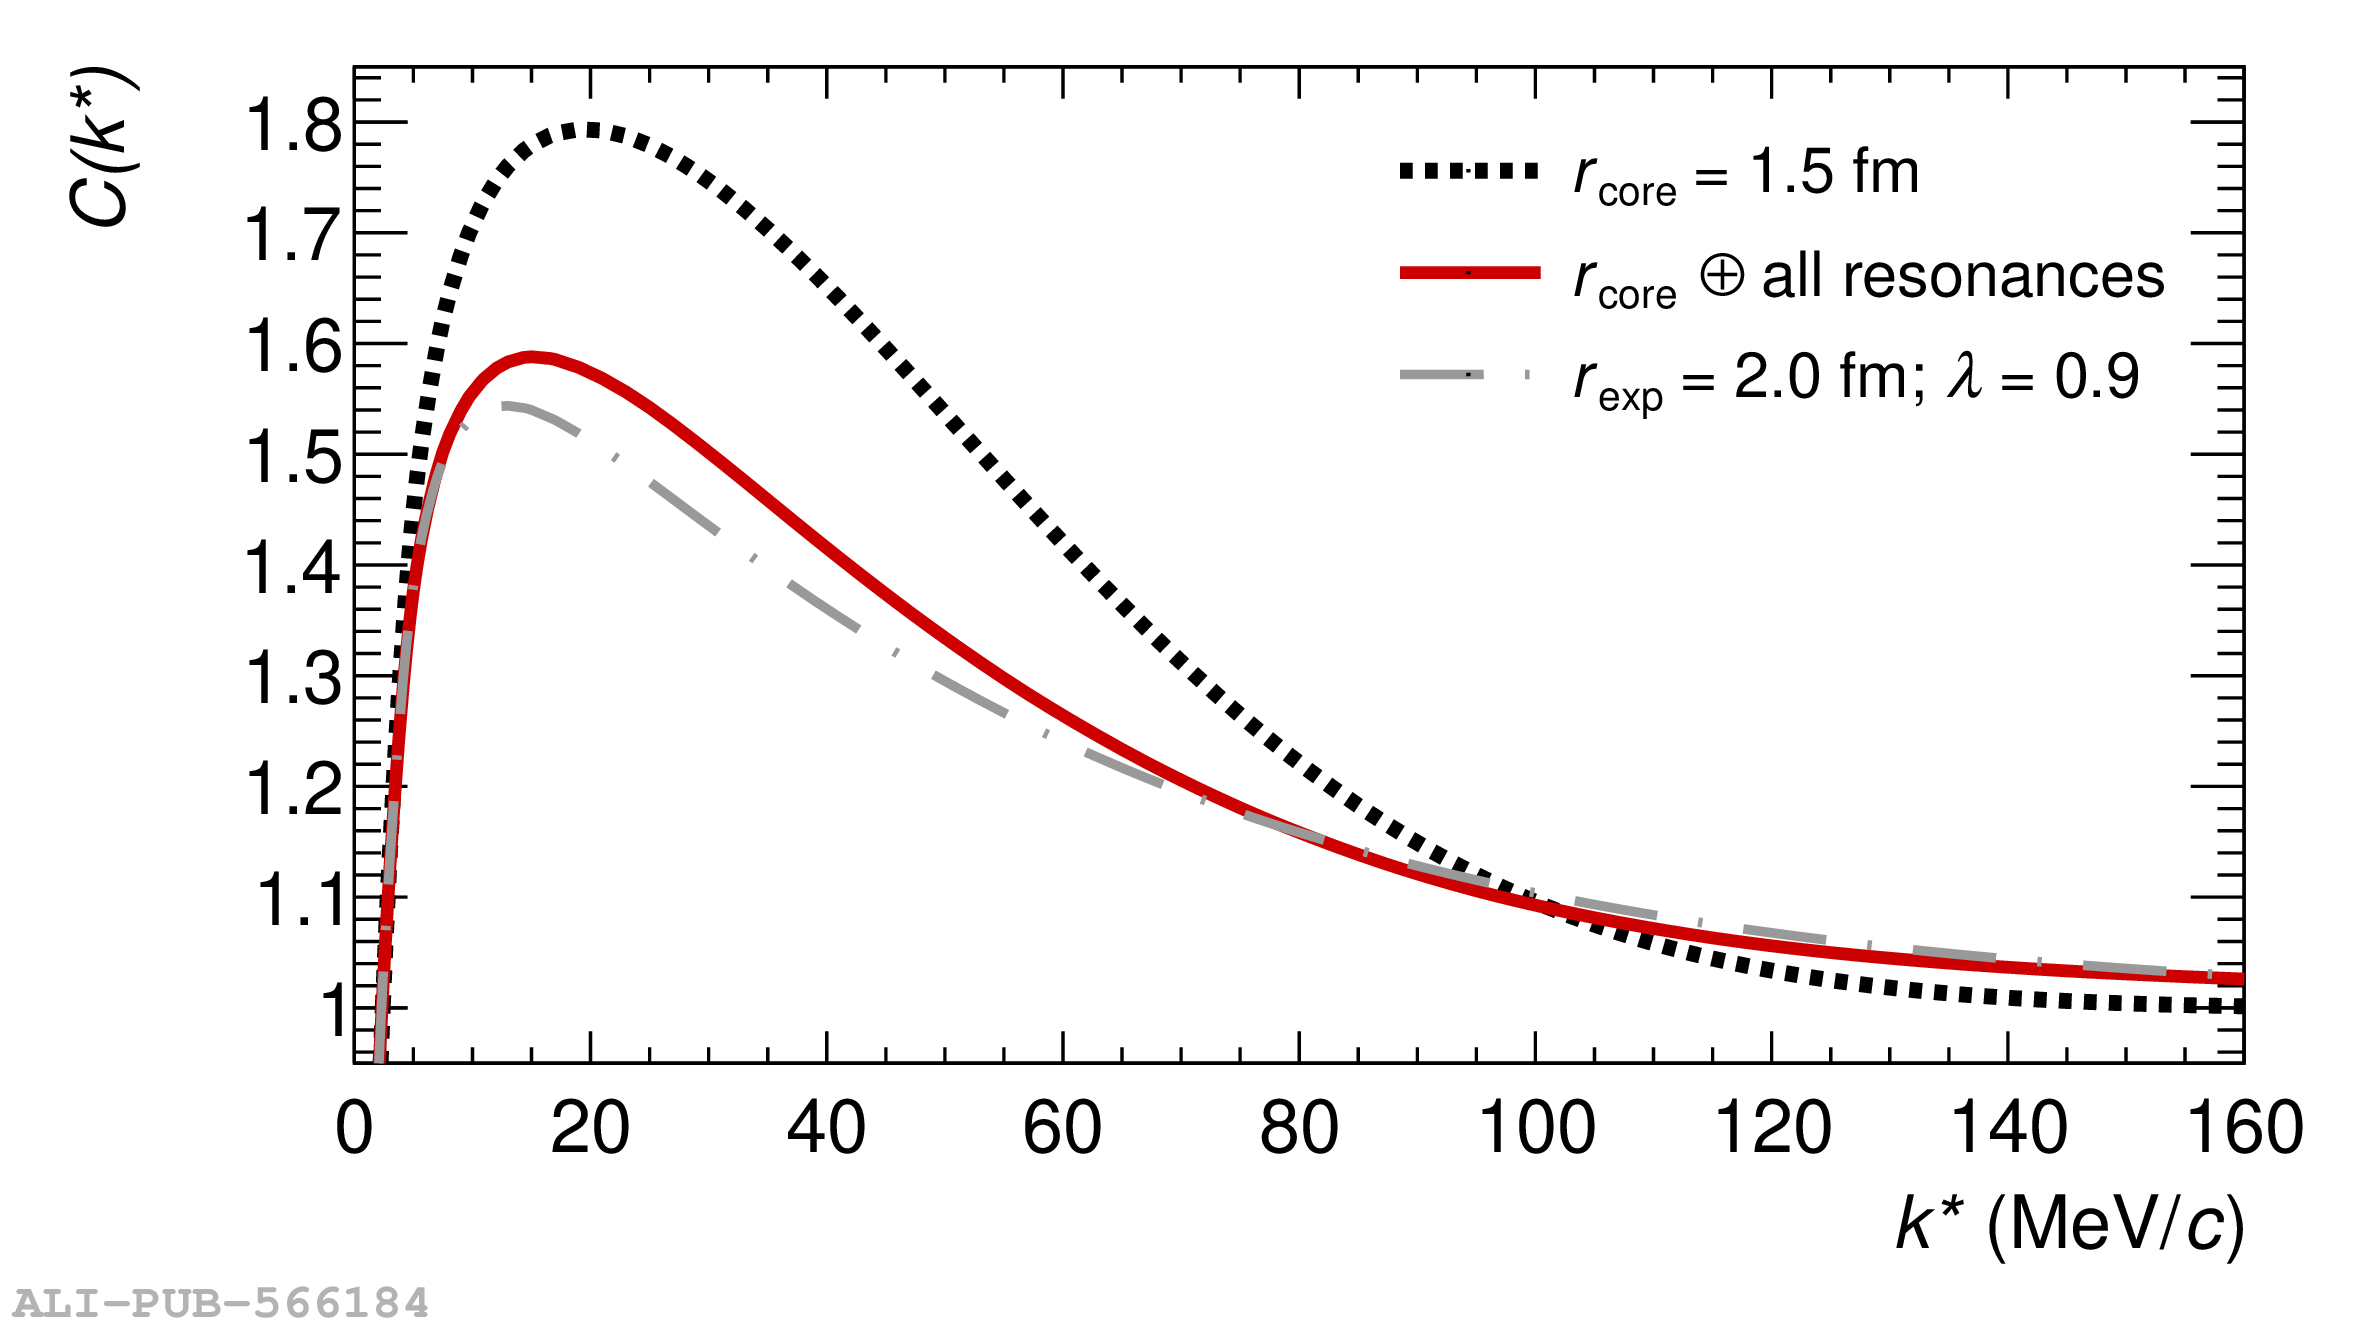 |
Figure 2
Correlation function of \spipi pairs in the third (0.50--0.70 \GeVc) \kt interval for $N_{\mathrm{ch}}> 30$, the fits are performed using CATS employing the RSM. The left (right) panel shows the results assuming a polynomial of first (second) degree as background. The statistical and systematic uncertainties are represented by the bars and rectangles, respectively. The uncertainty bands of the fit function are obtained by employing a bootstrap procedure. | 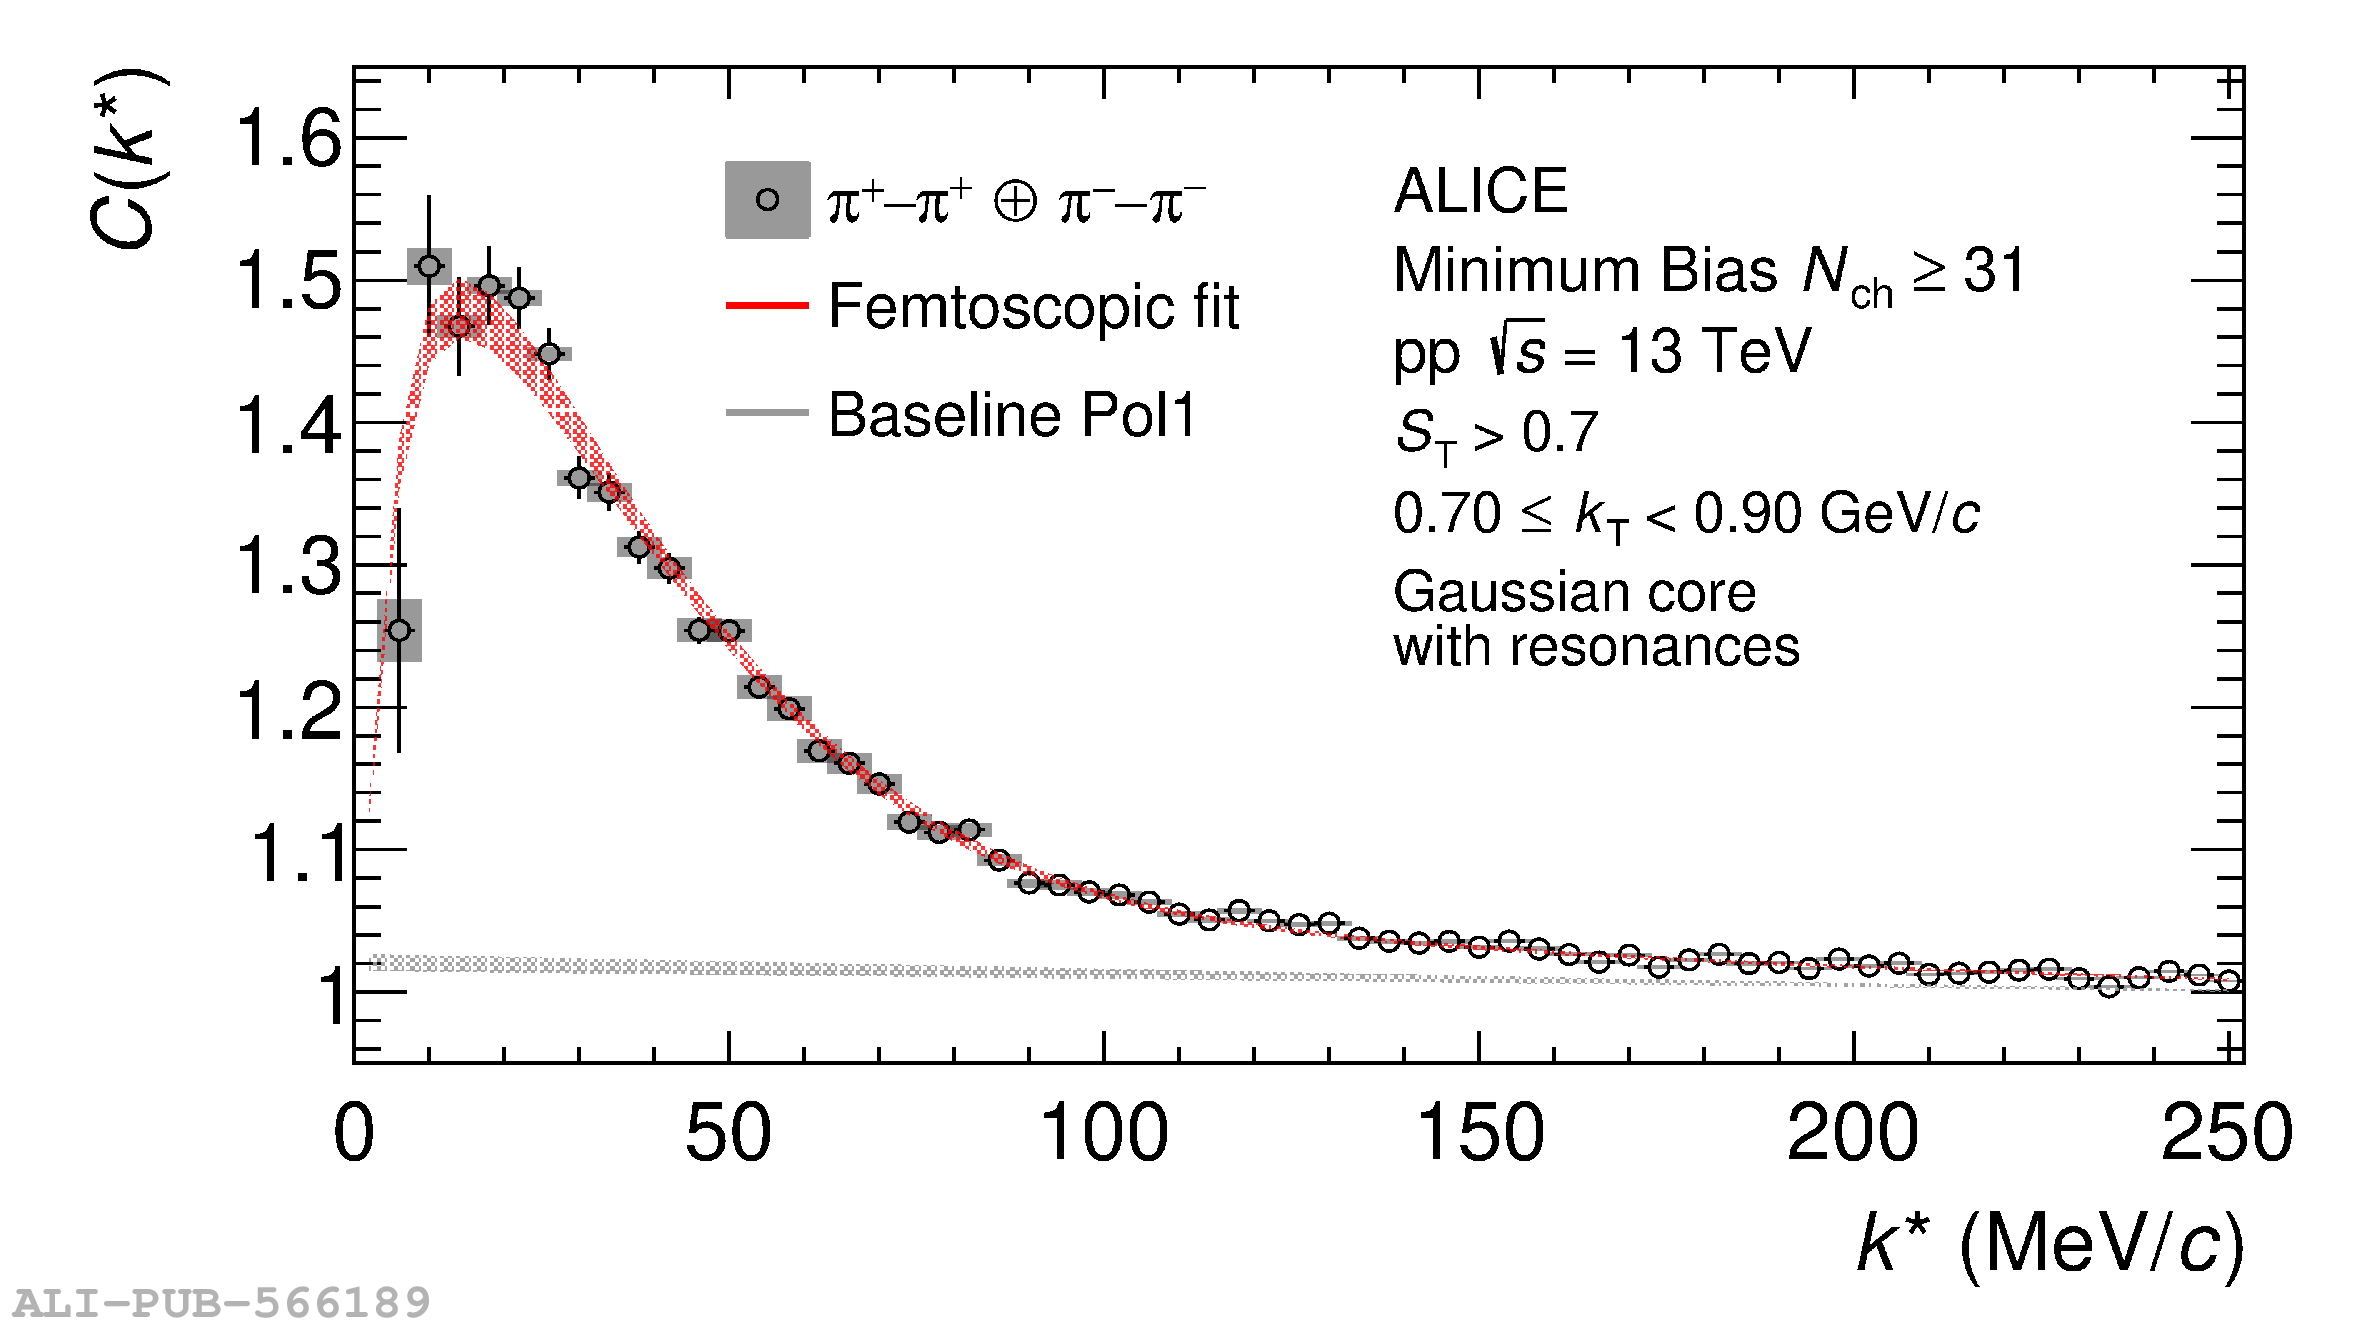 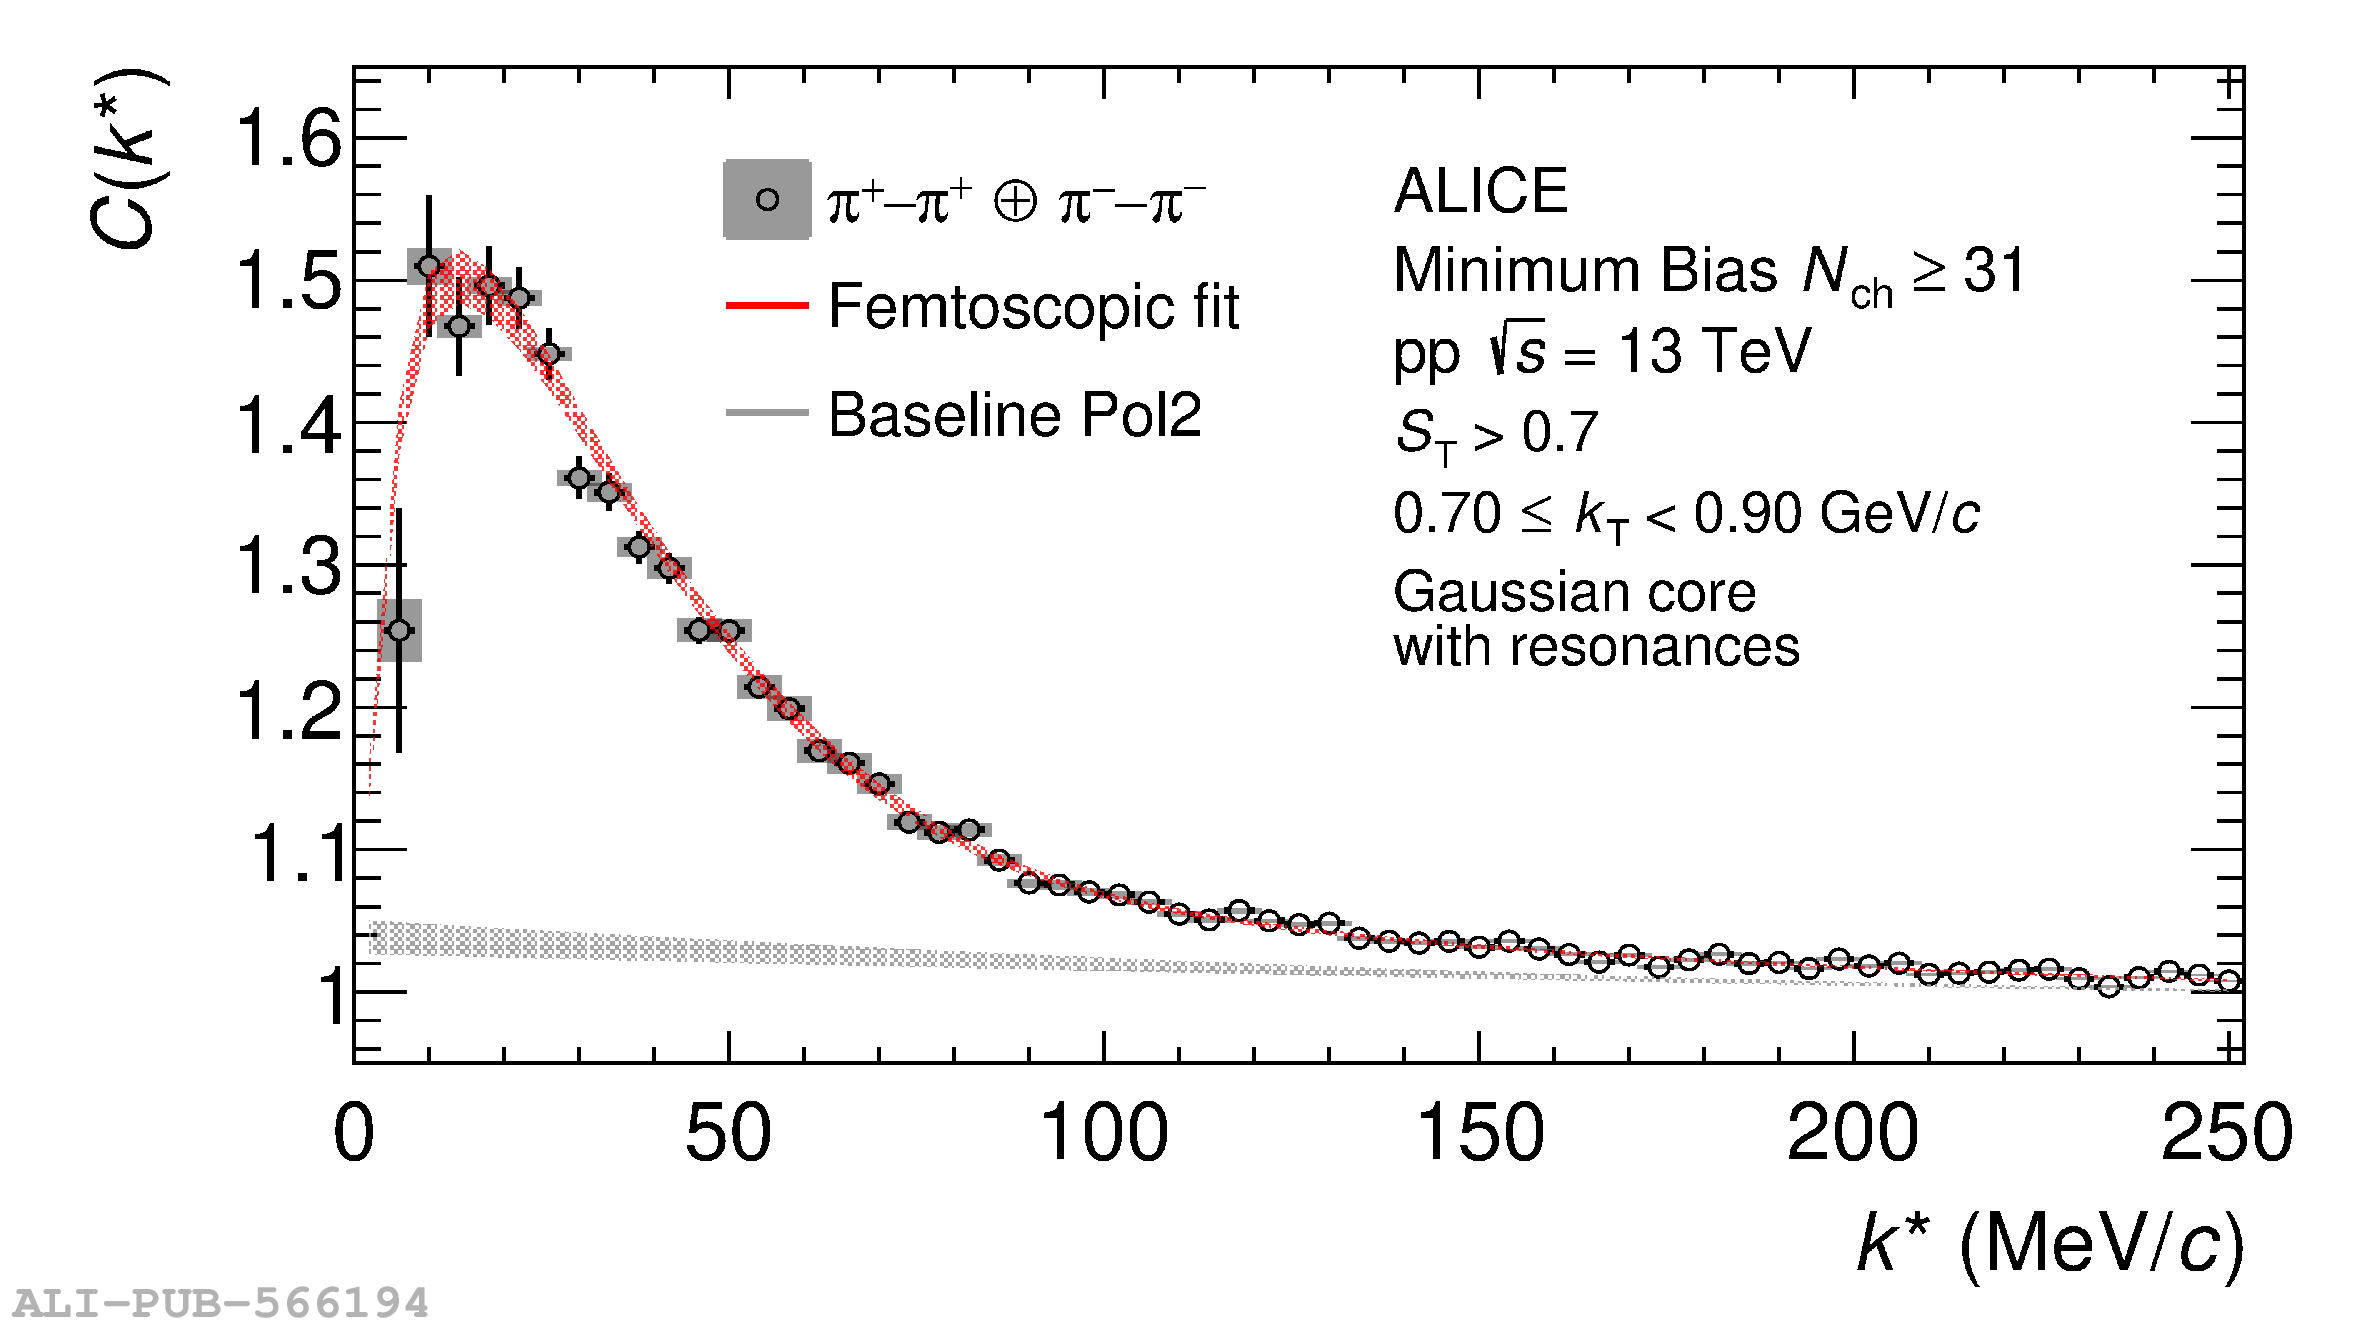 |
Figure 3
Correlation function of $\pi -\pi$ pairs in the fourth (0.70$-$0.90 GeV/$c$) $k_{\rm T}$ interval for HM collisions, the fits on the left (right) are performed using CATS employing the RSM and assuming a polynomial of first (second) degree as background. The statistical and systematic uncertainties are represented by the bars and rectangles, respectively. The uncertainty bands of the fit function are obtained by employing a bootstrap procedure. | 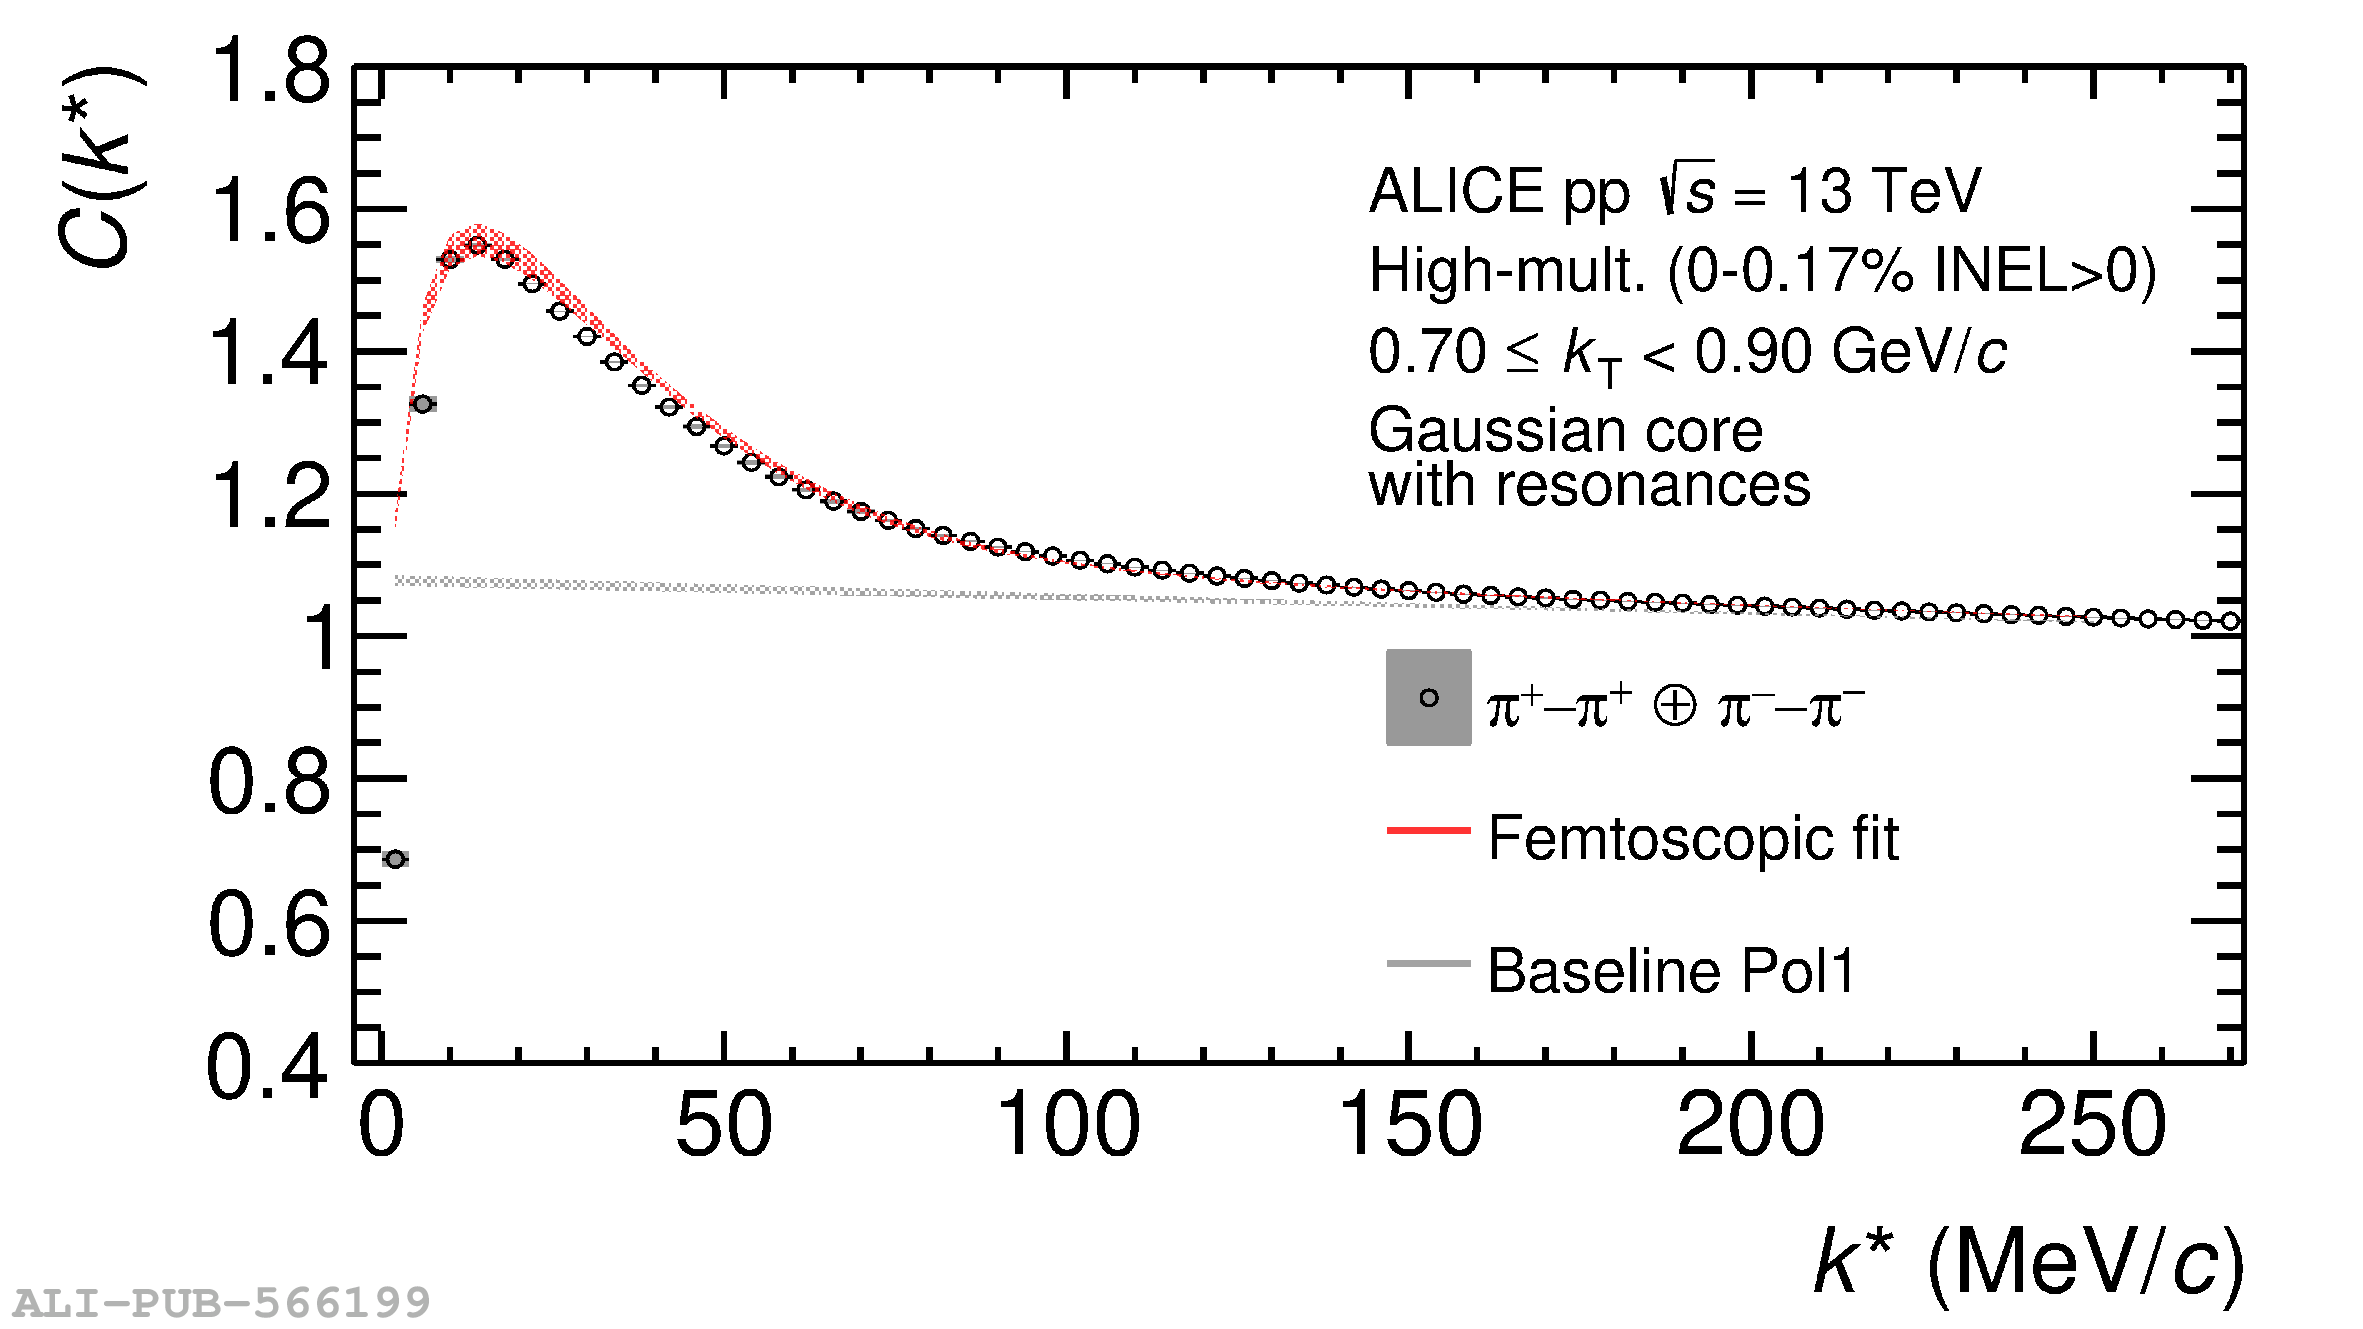 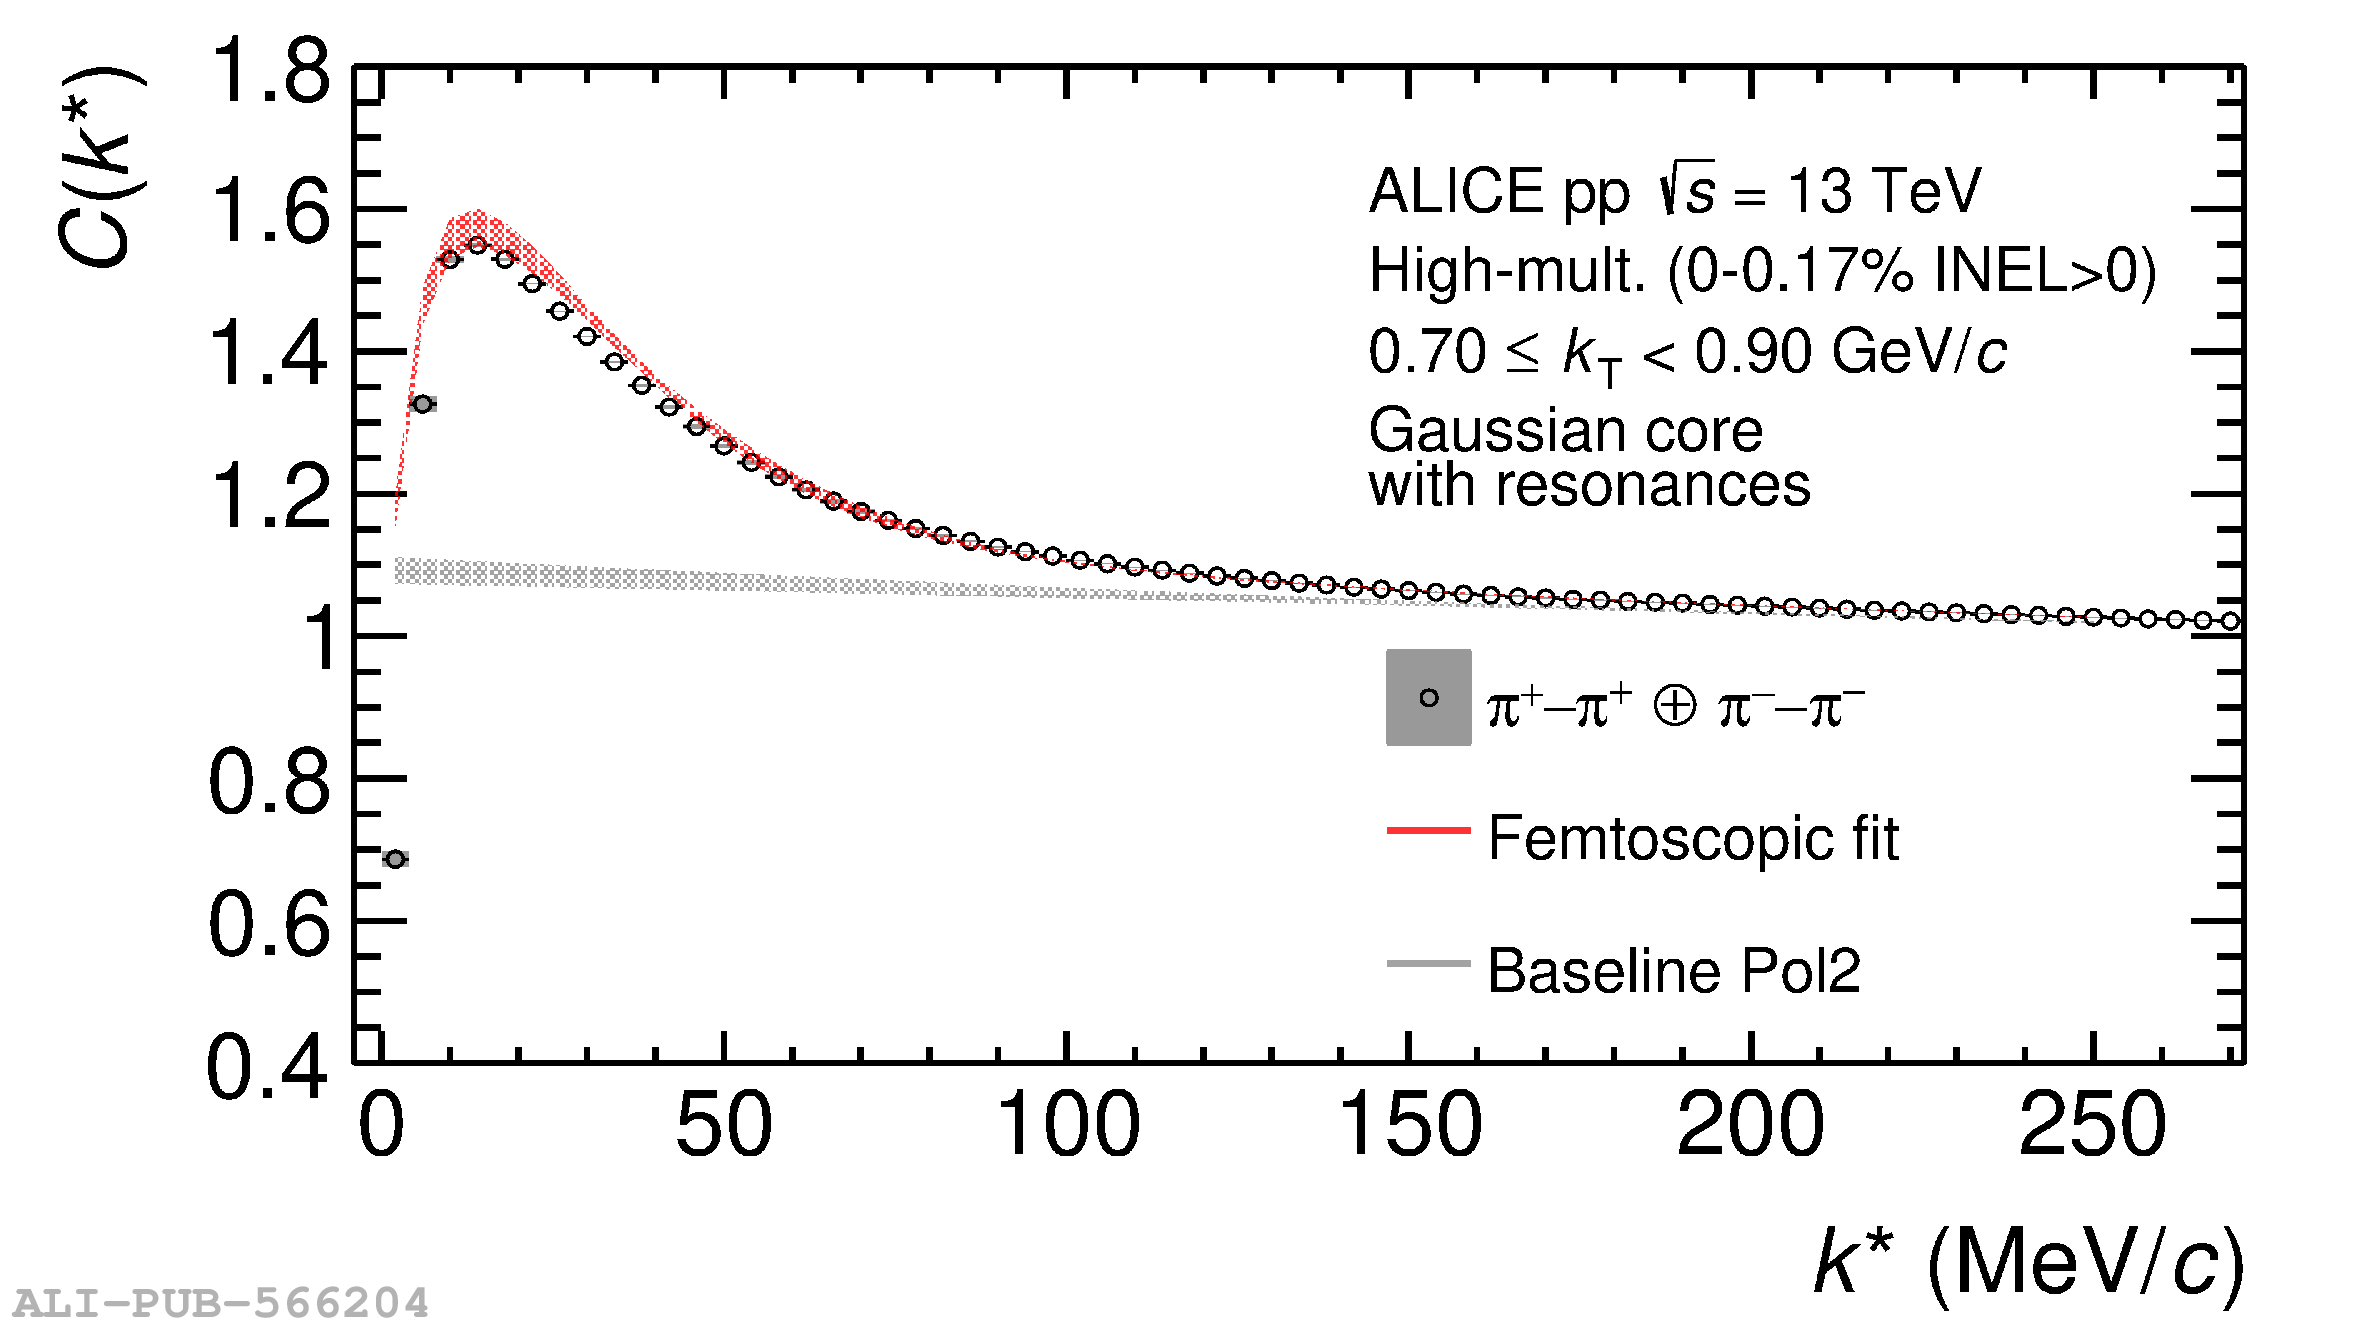 |
Figure 4
Correlation functions of K$-$p pairs in different ranges of $m_{\rm T}$ for HM pp collisions as indicated in each panel. Vertical bars represent statistical uncertainties while boxes systematic uncertainties, respectively. The fits are performed using CATS employing the root mean square deviation for a uniform distribution in each $k^*$ interval. The uncertainty bands of the fit function are obtained by employing a bootstrap procedure. | 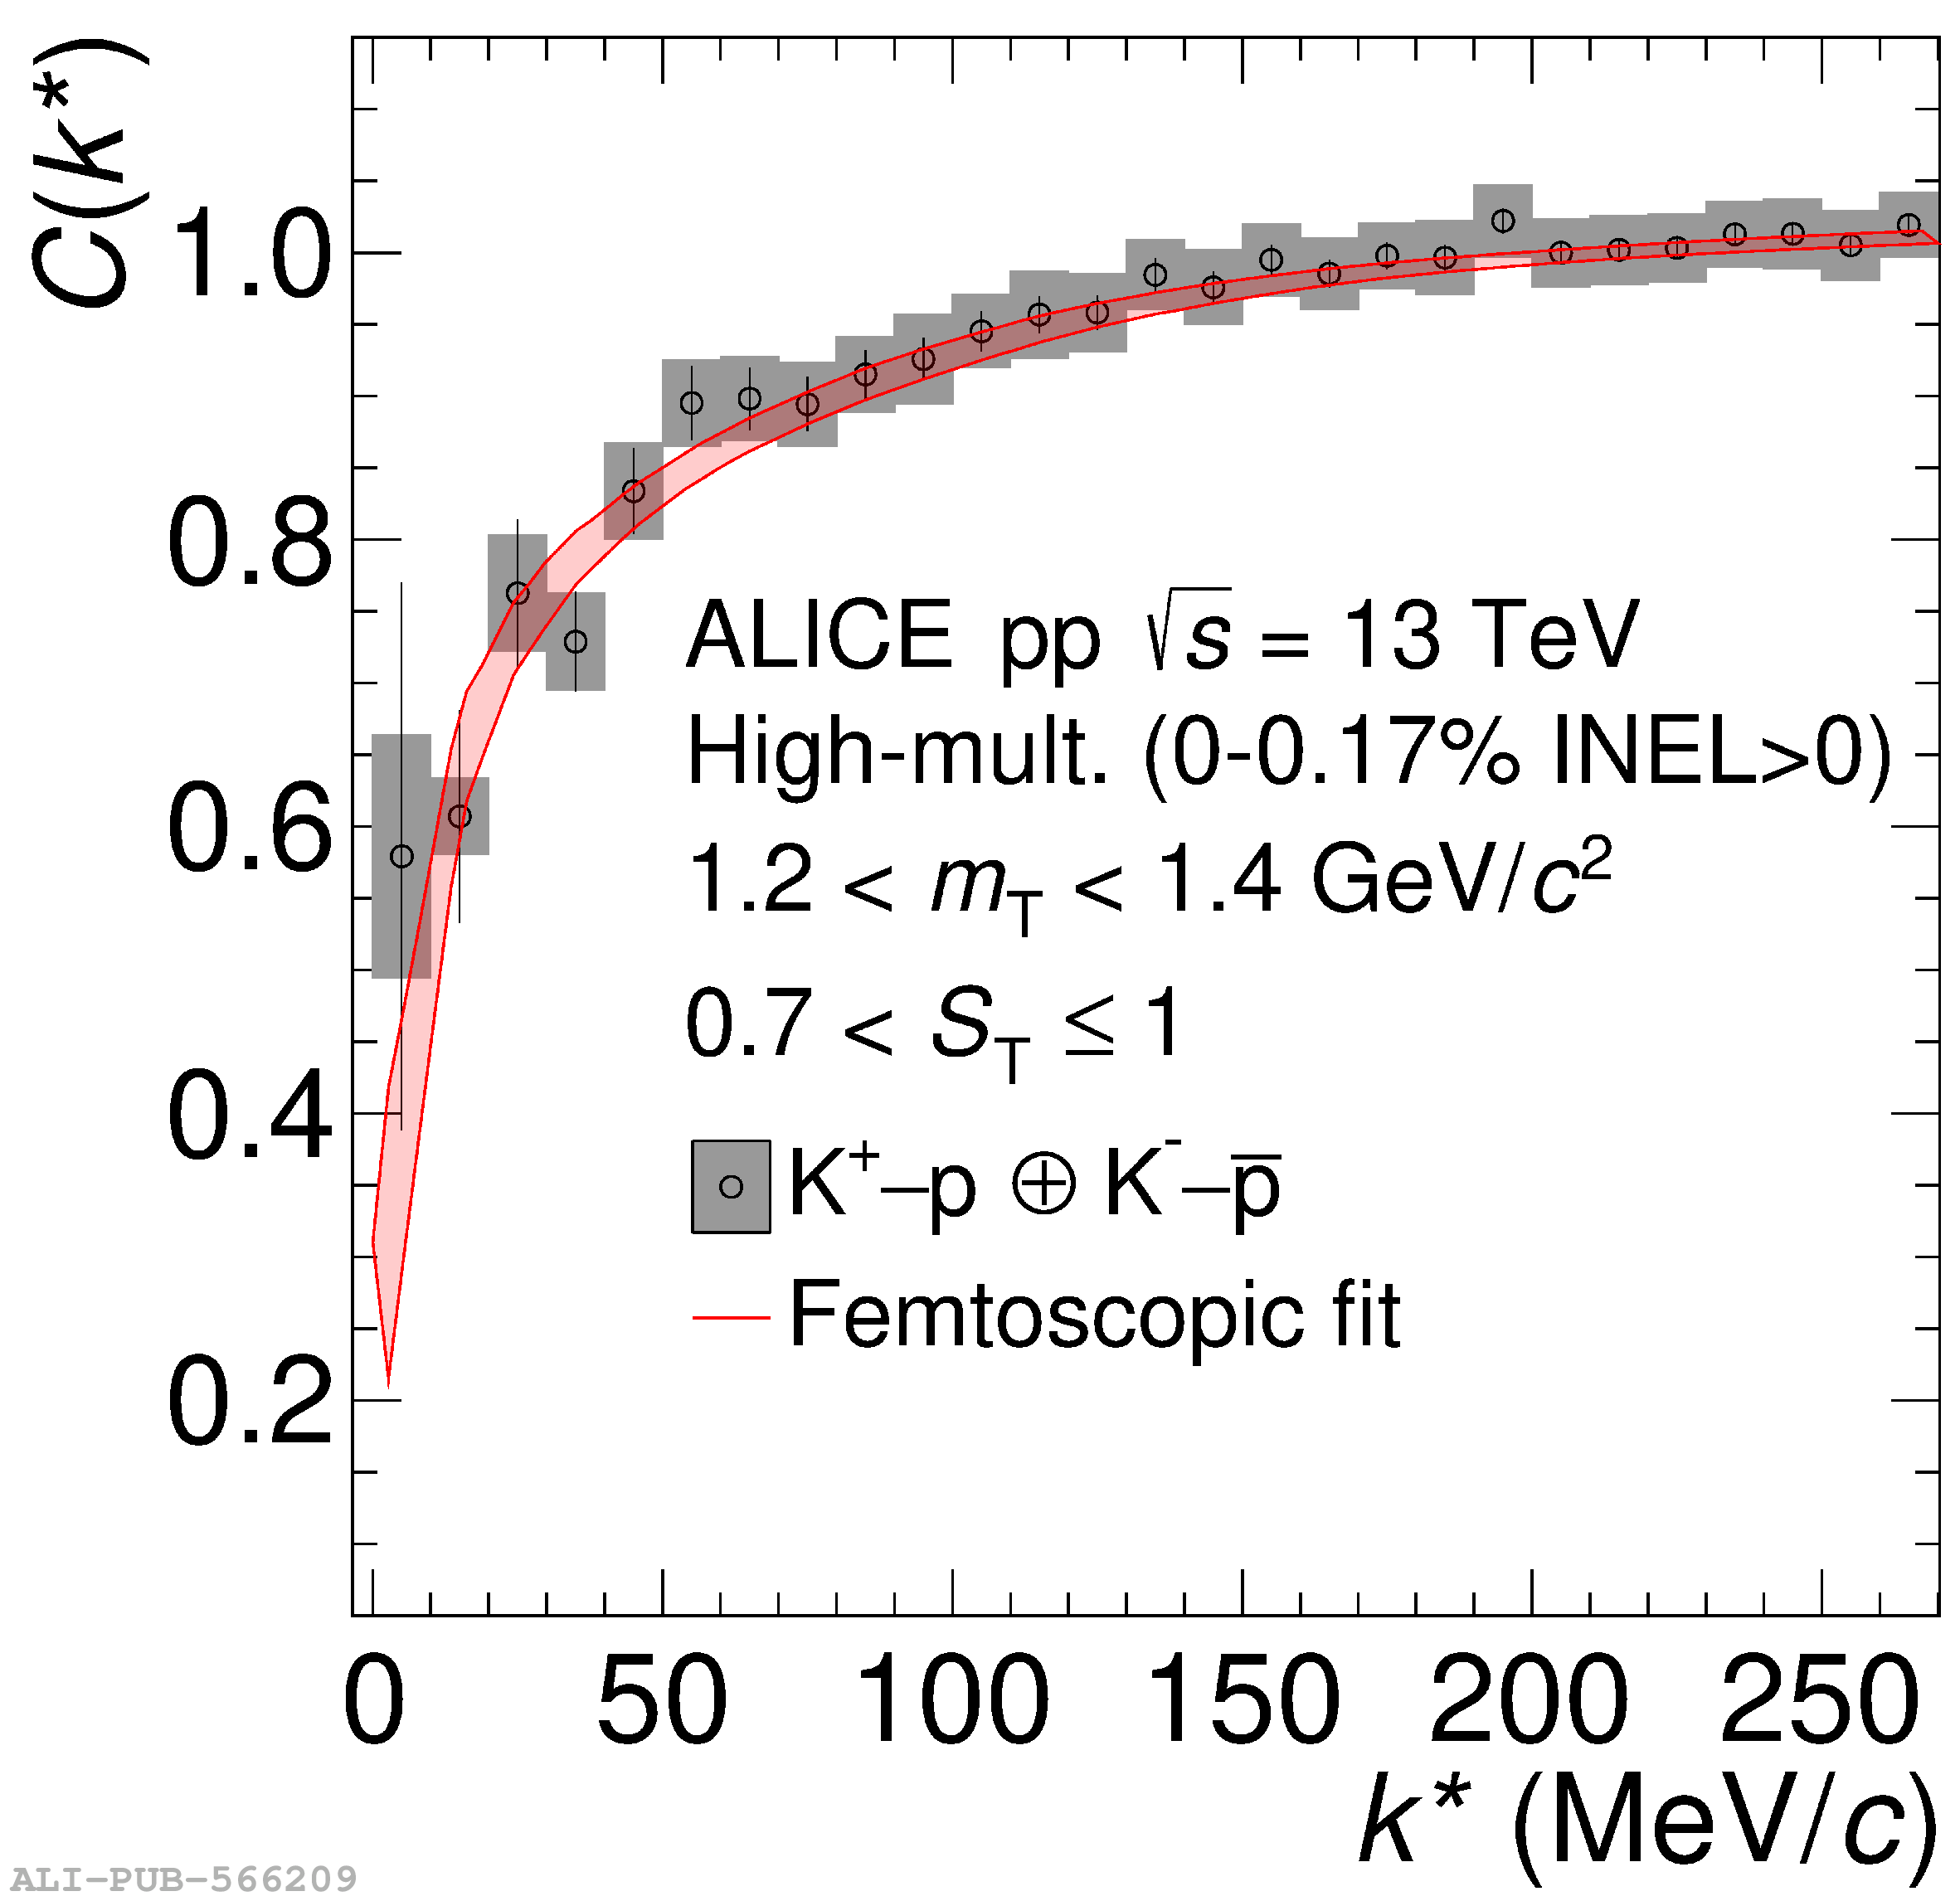 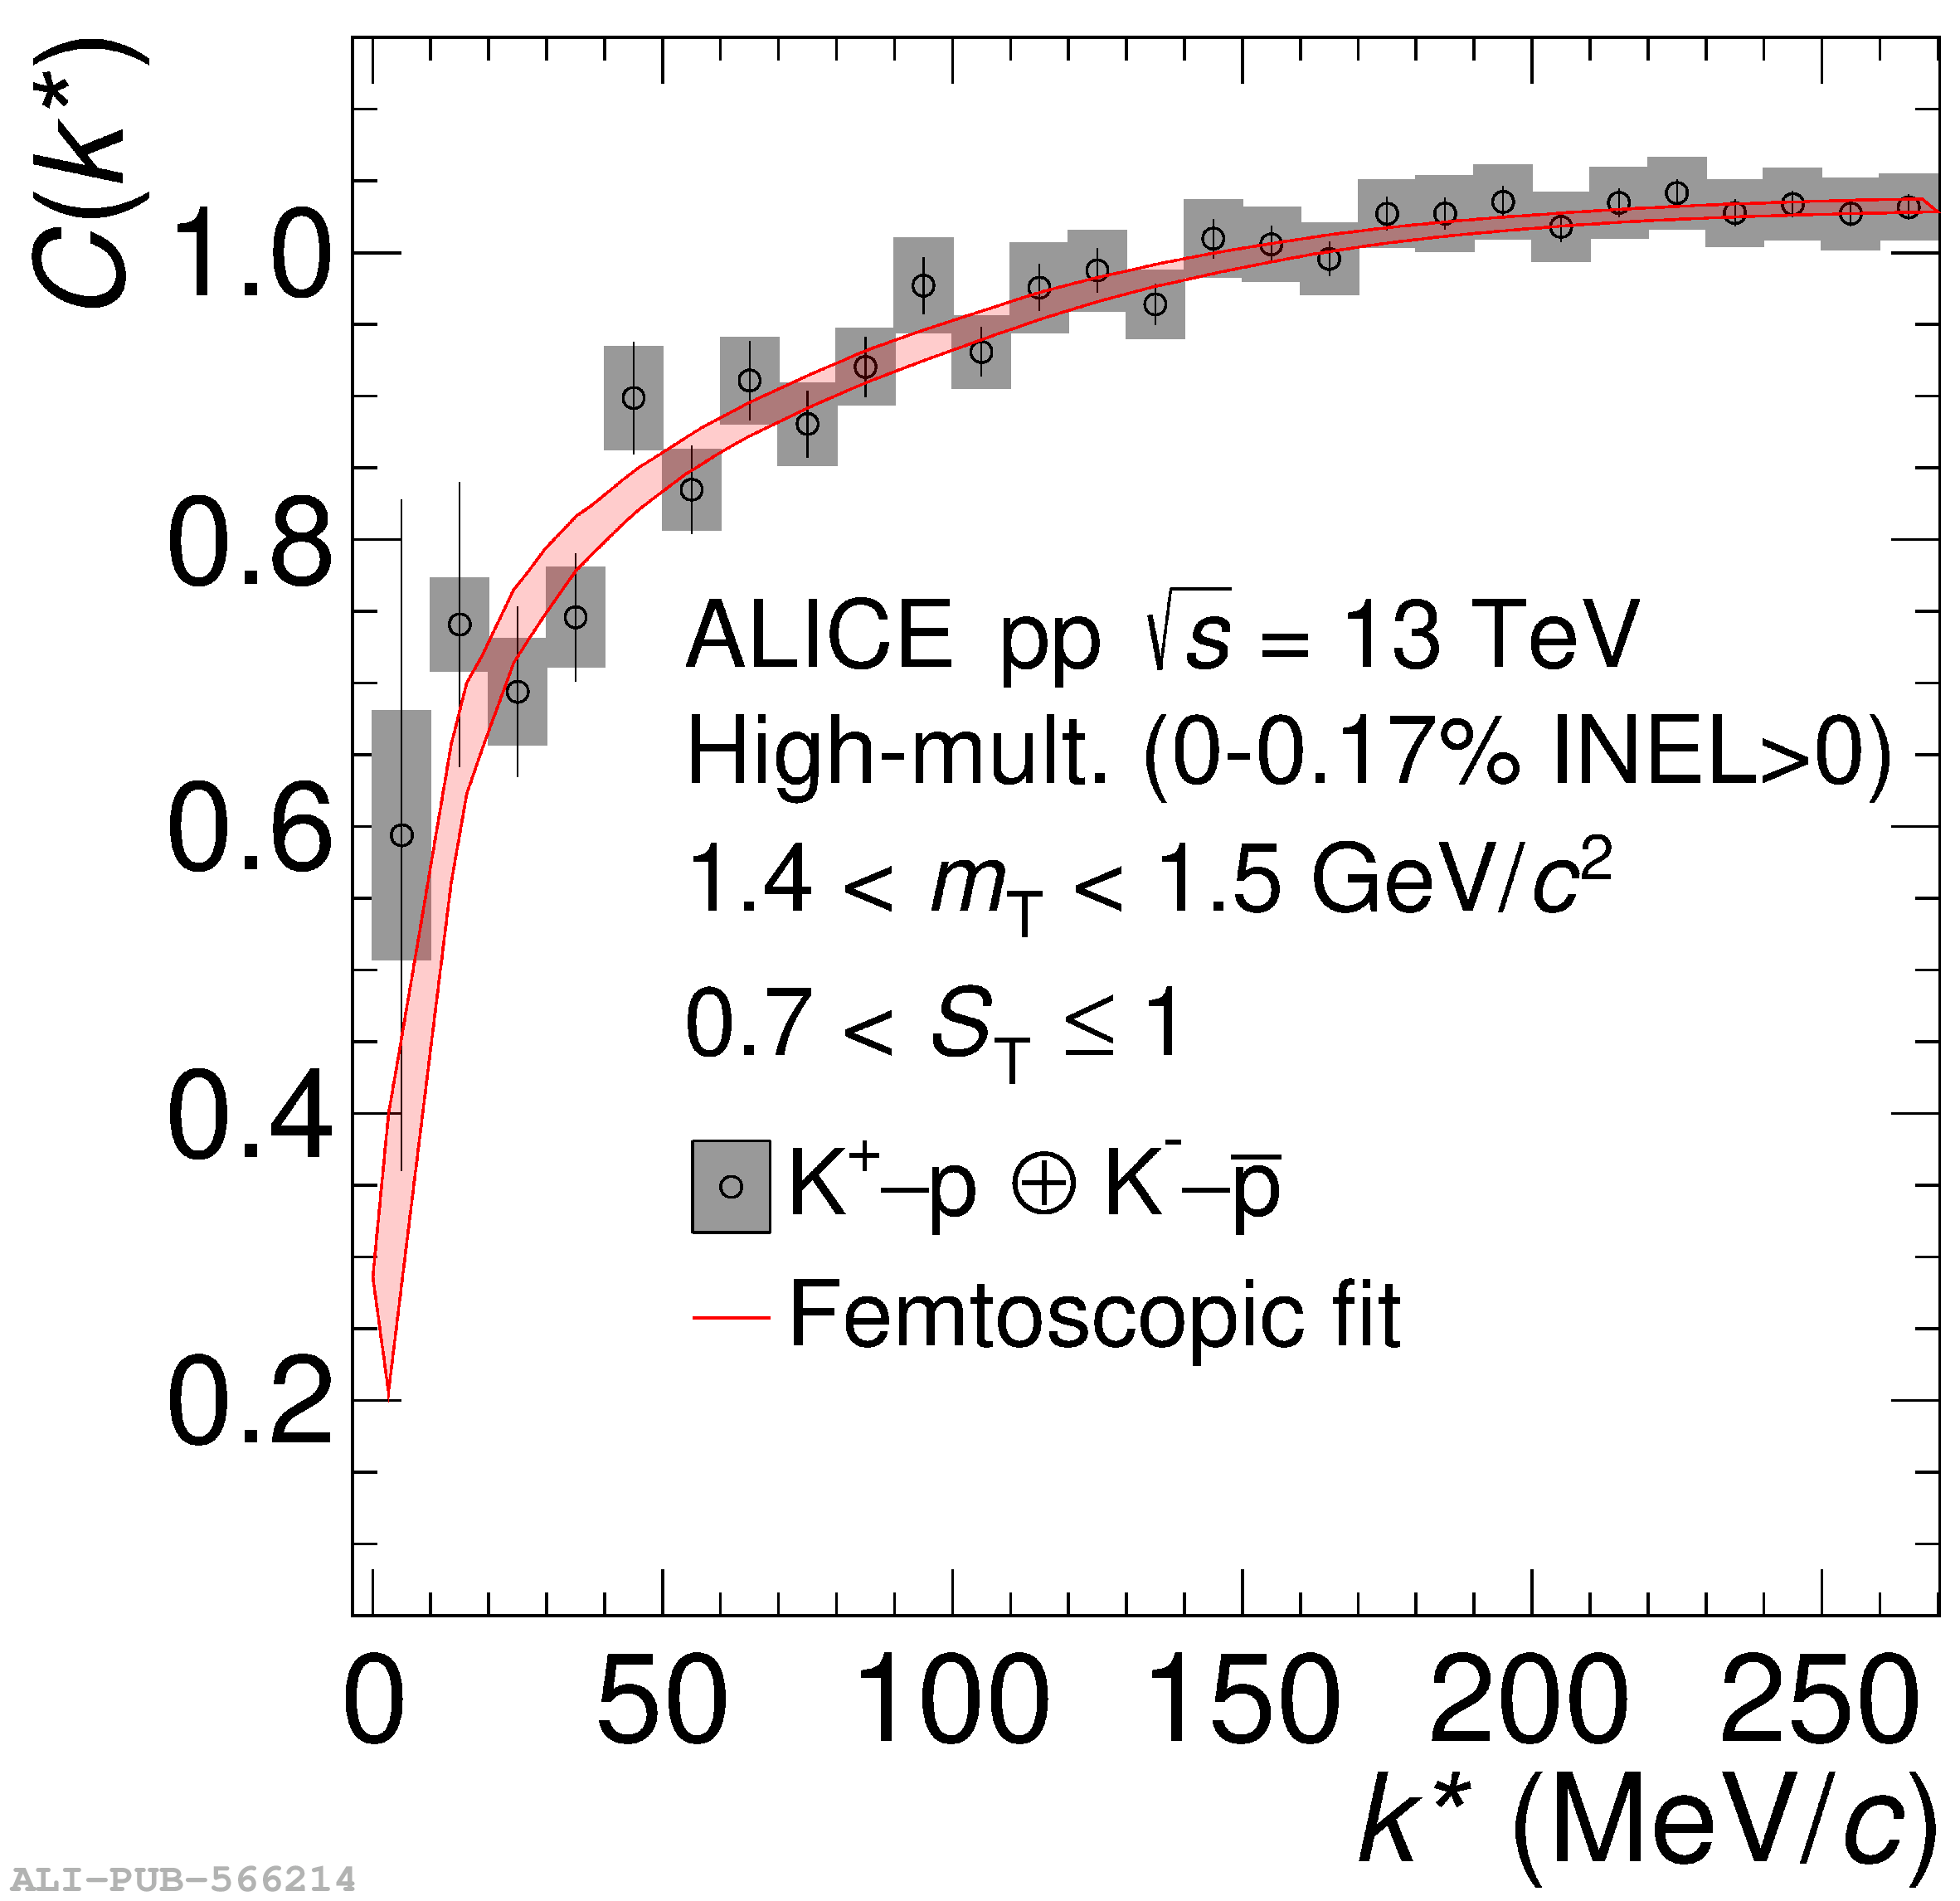 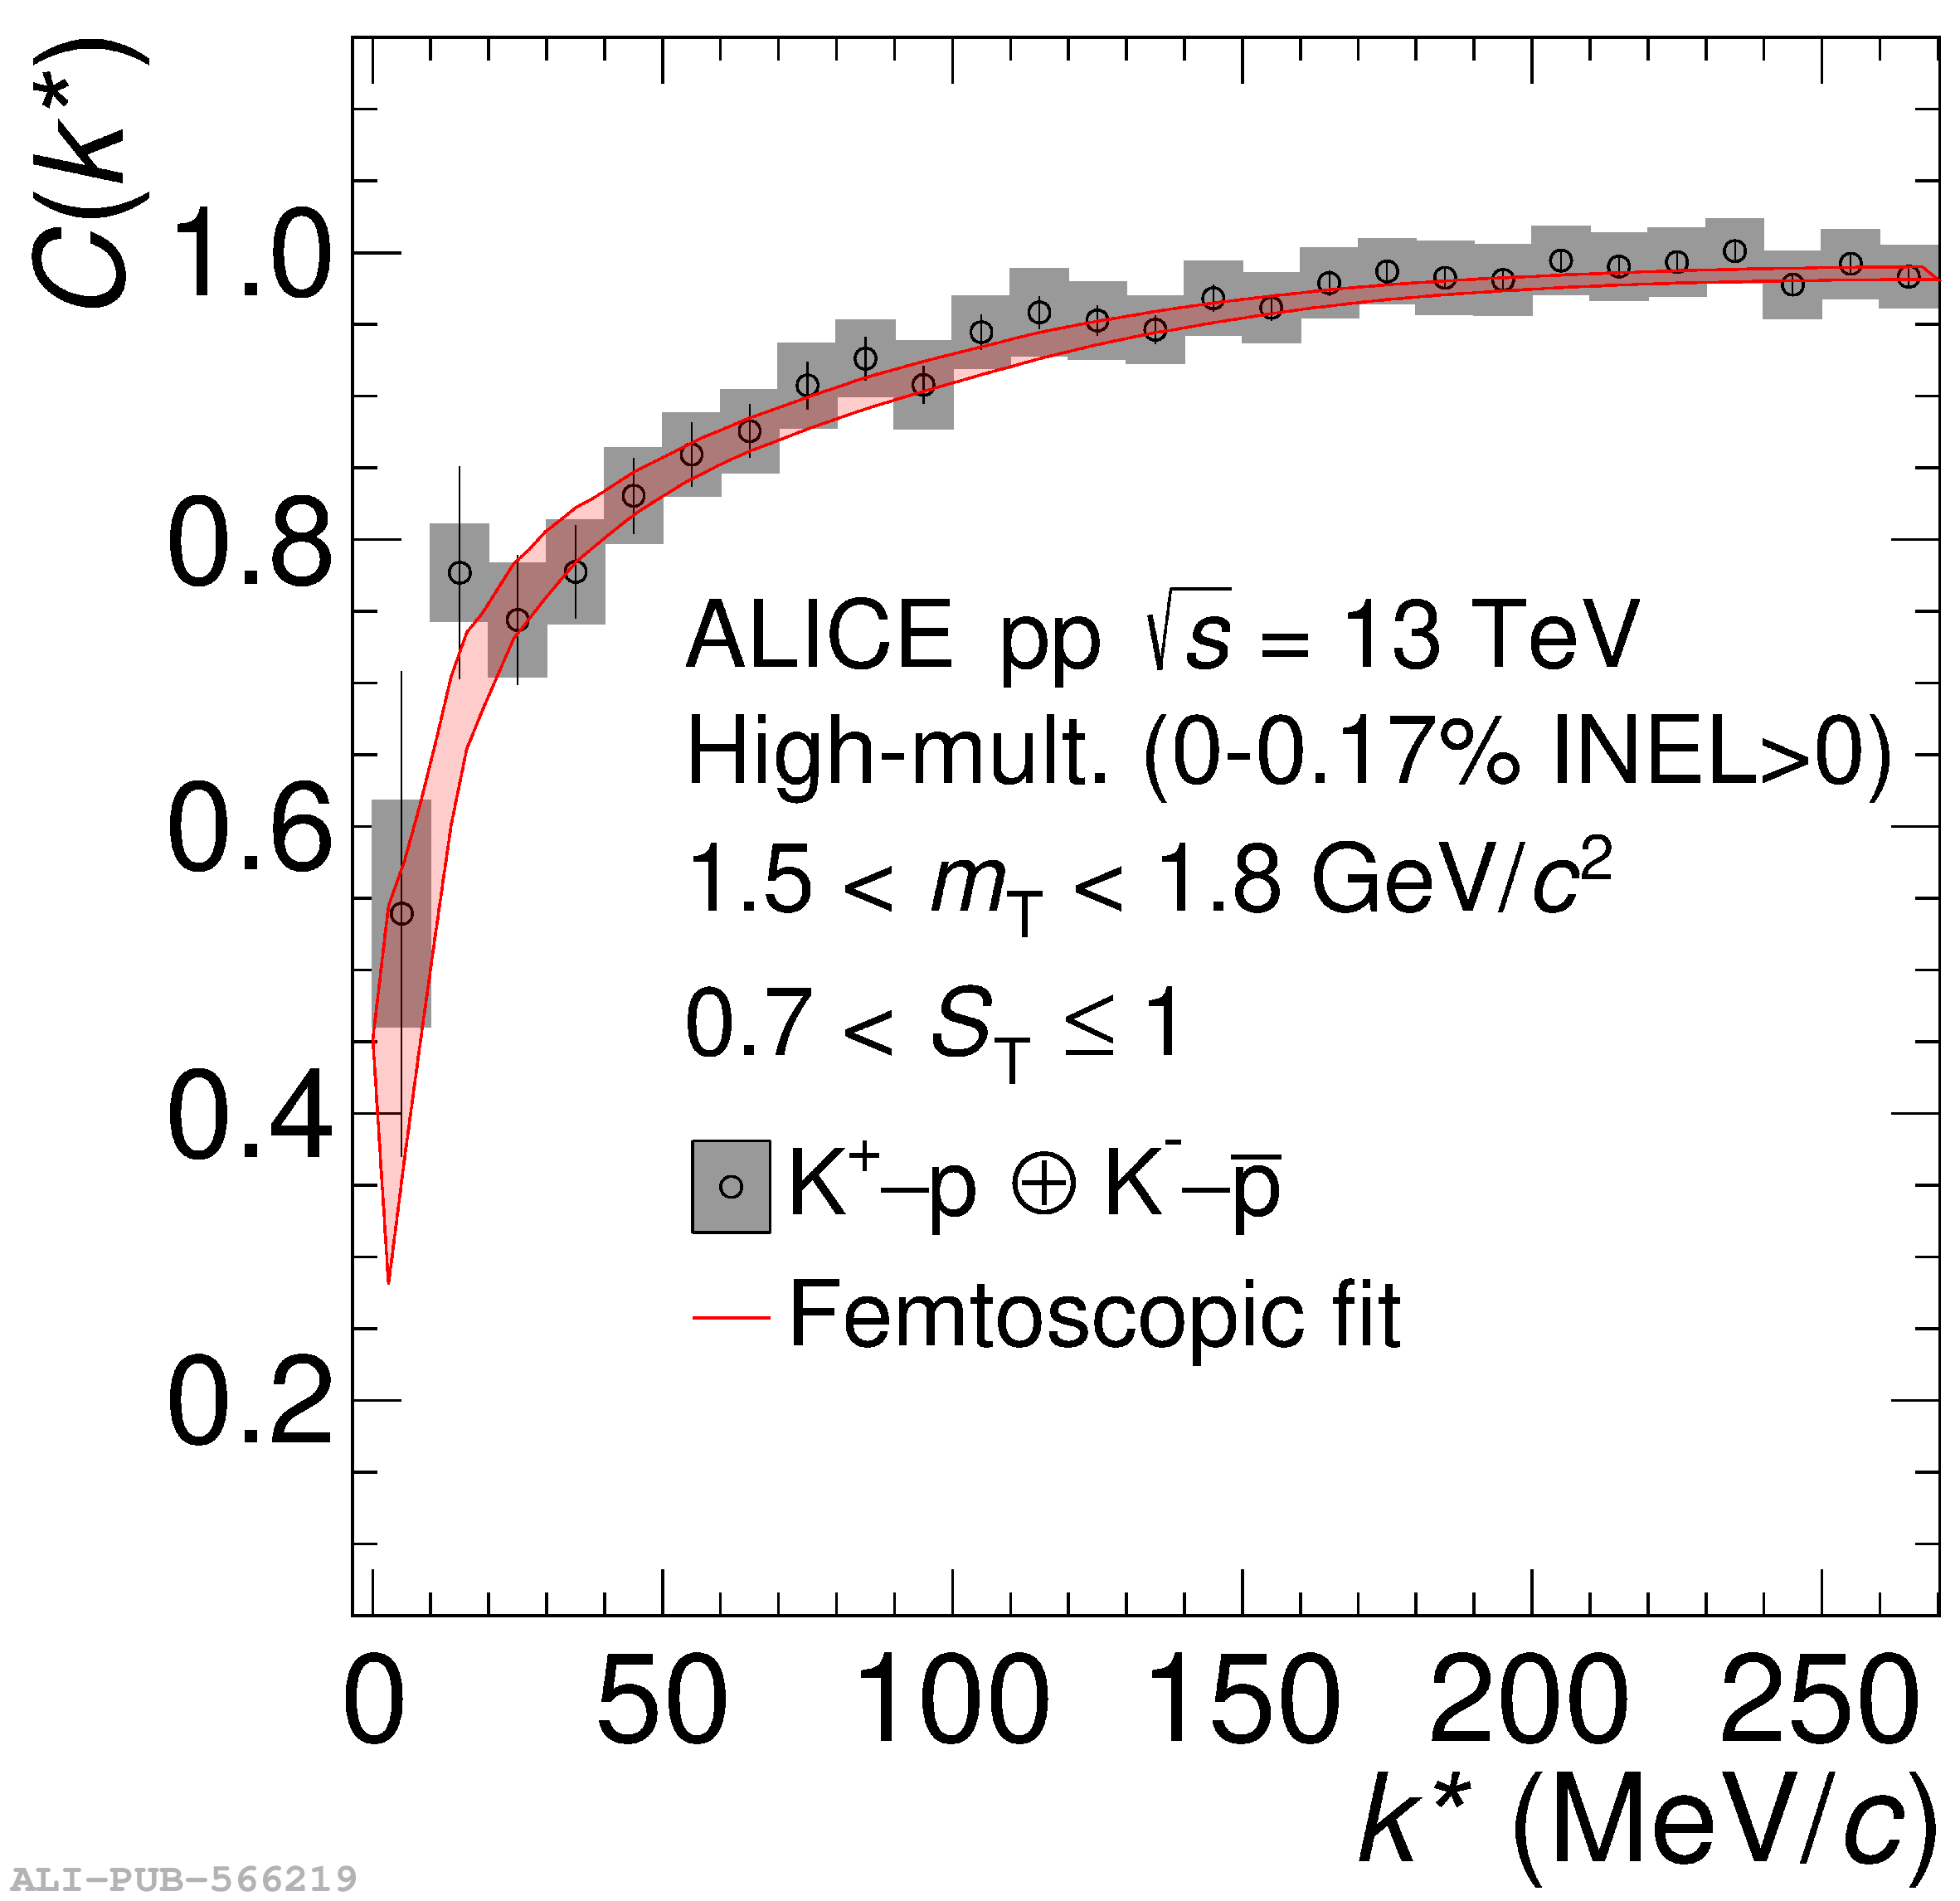 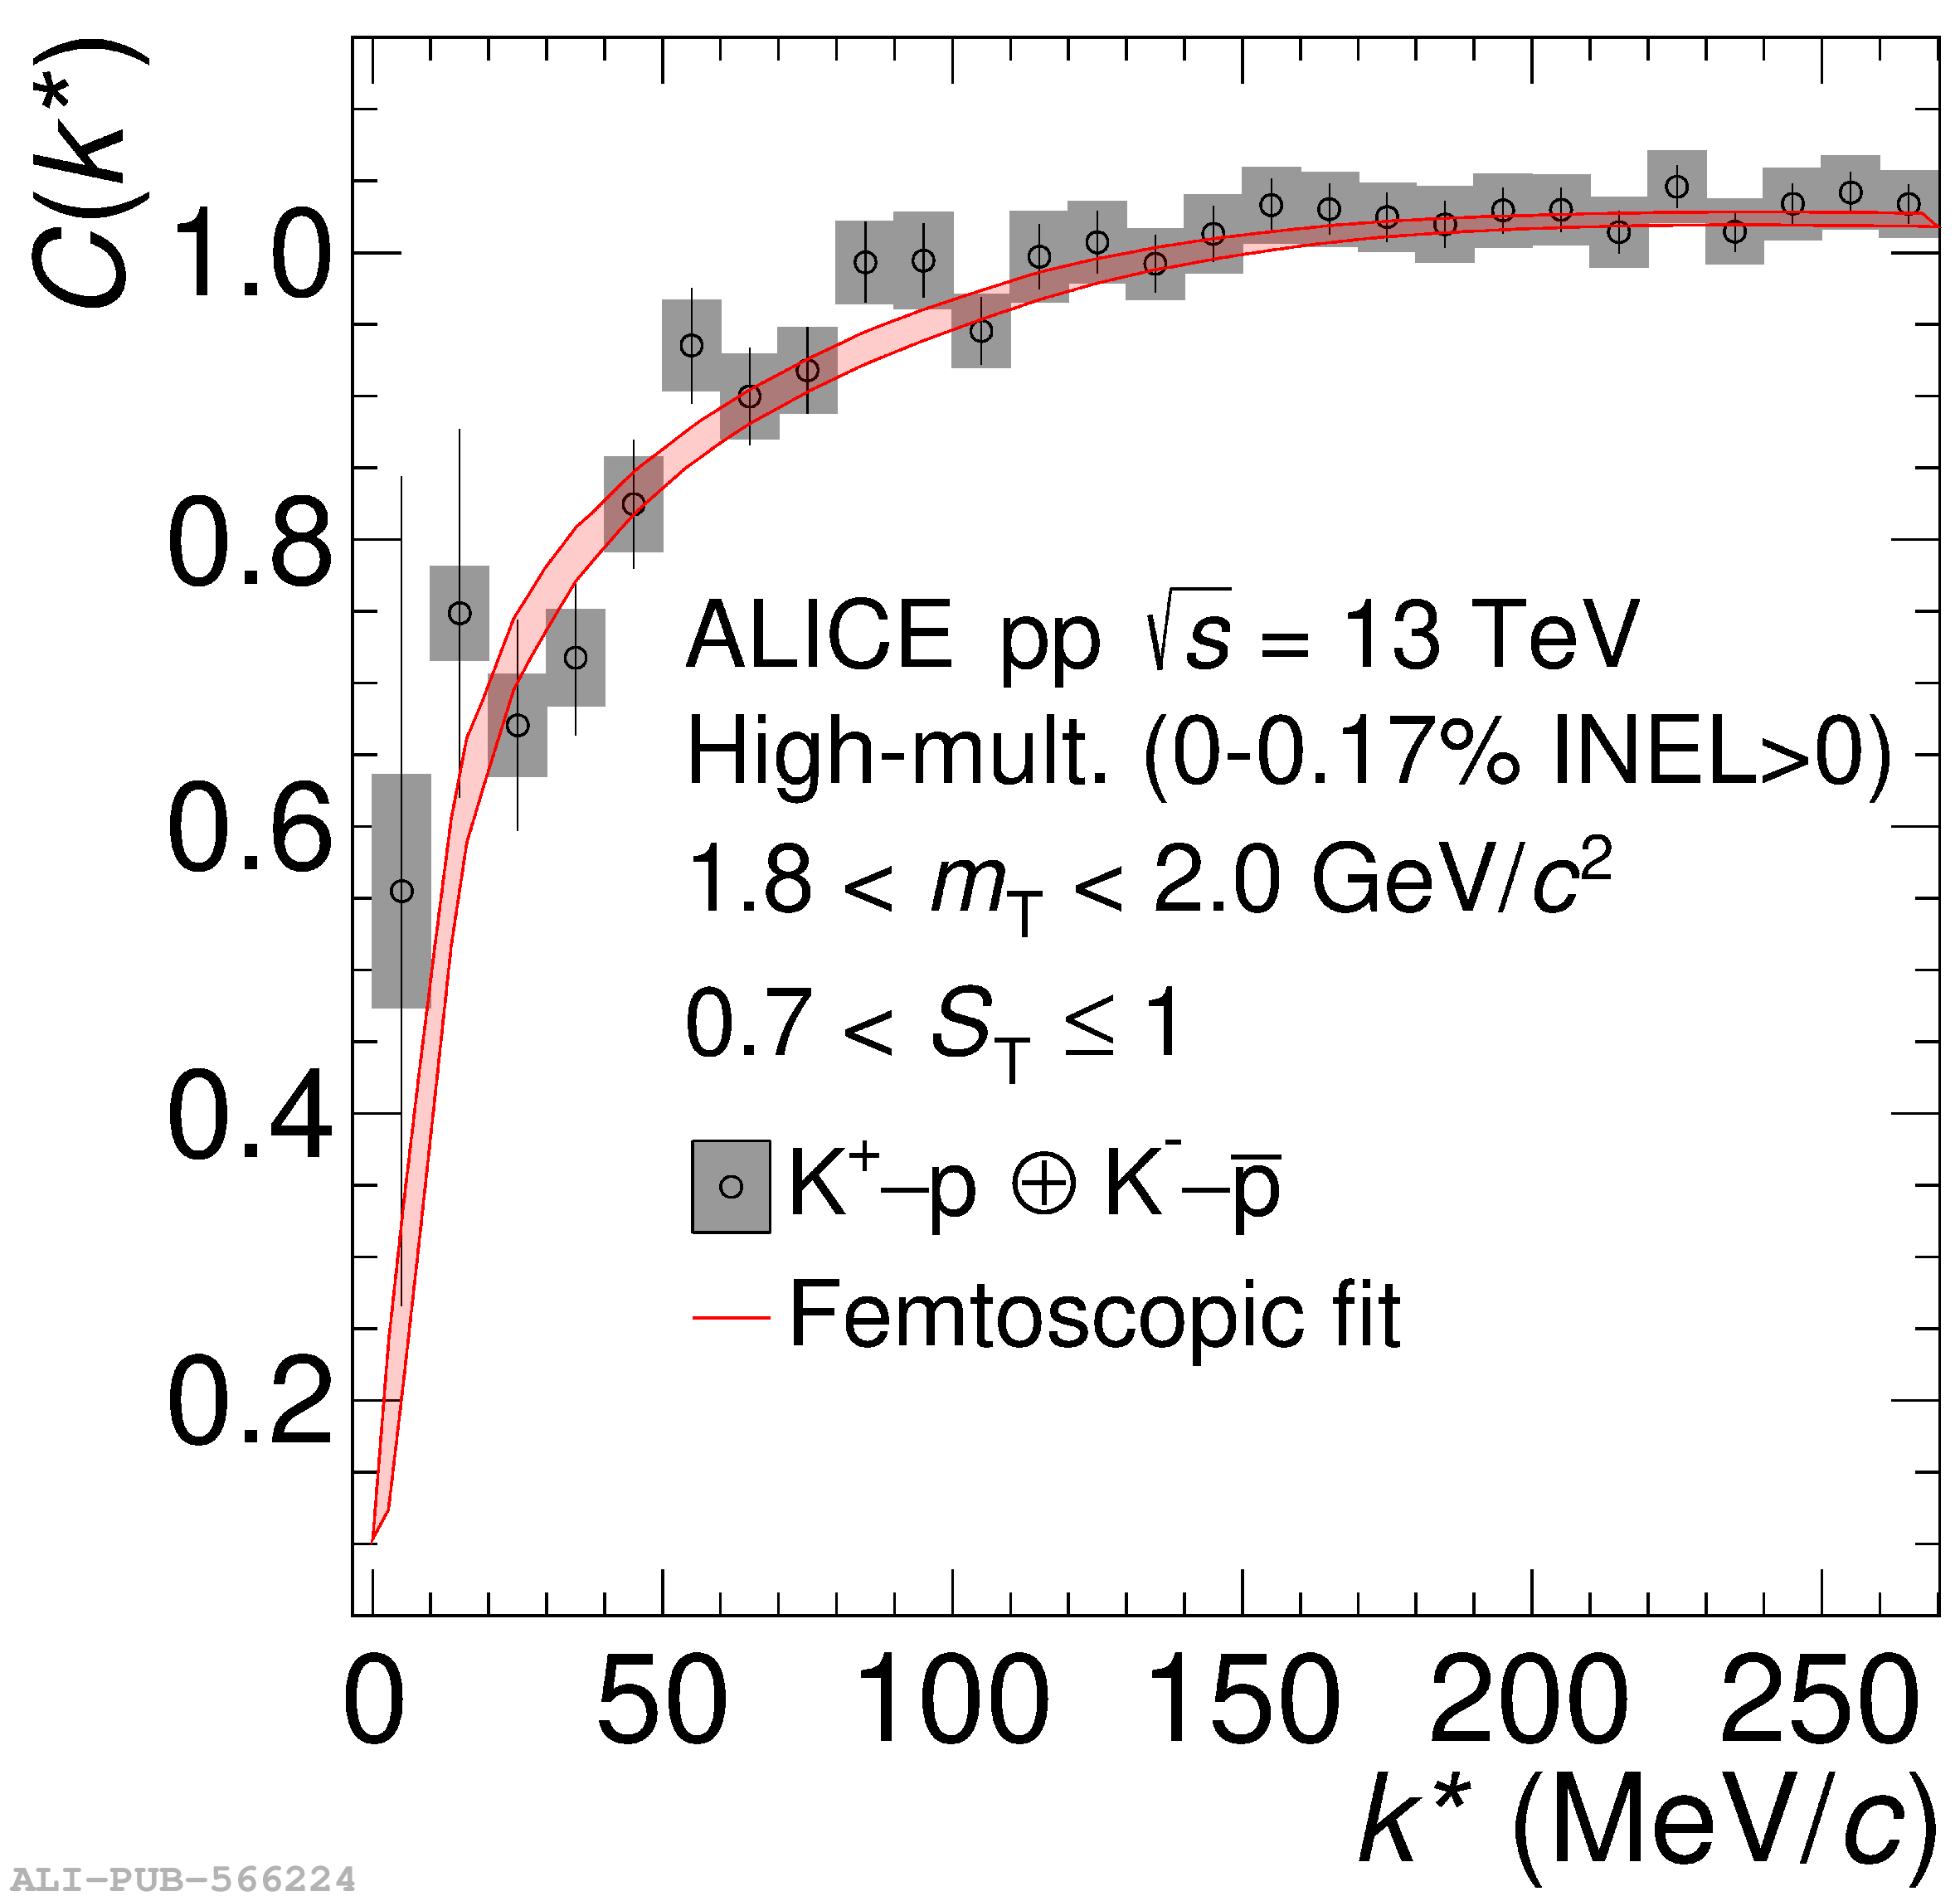 |
Figure 5
Extracted radii from the fit as a function of $m_{\rm T}$ for the HM analysis of meson$-$meson, meson$-$baryon (this work), and baryon$-$baryon correlations. The green band corresponds to the parametrization of the $m_{\rm T}$ scaling of the p$-$p correlations and is shown with the associated $3\sigma$ spread. | 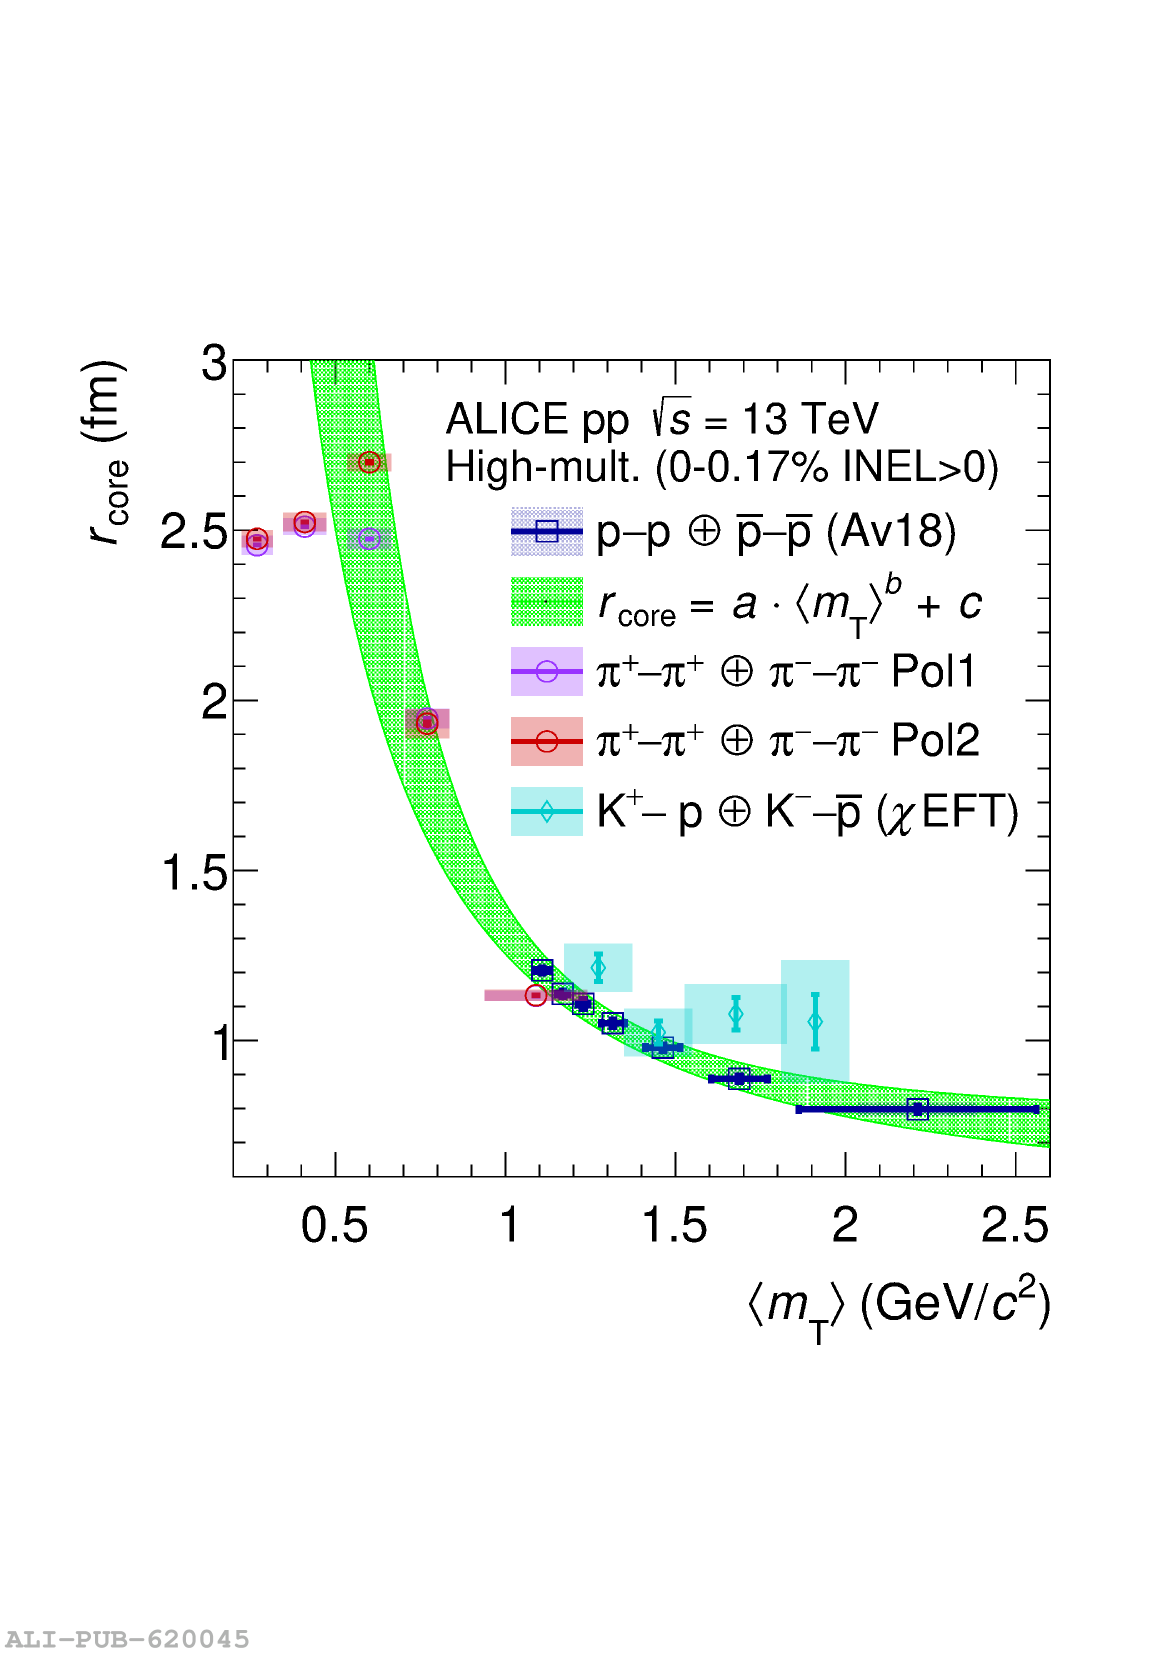 |
Figure 6
Extracted radii from the fits of $\pi-\pi$ correlations as a function of $m_{\rm T}$ for three different multiplicity classes. From left to right and bottom: $1 \leq N_{\mathrm{ch}} \leq 18$, $19 \leq N_{\mathrm{ch}} \leq 30$ and $N_{\mathrm{ch}} \geq 31$. The reduced $\chi^2$ for the obtained radii is shown in the lower panels and evaluated in the range of $6 < k^{*} < 100$ MeV/$c$. The assumption that a second-order polynomial background shape exhibits either greater or equivalent compatibility with the data compared to a first-order polynomial. | 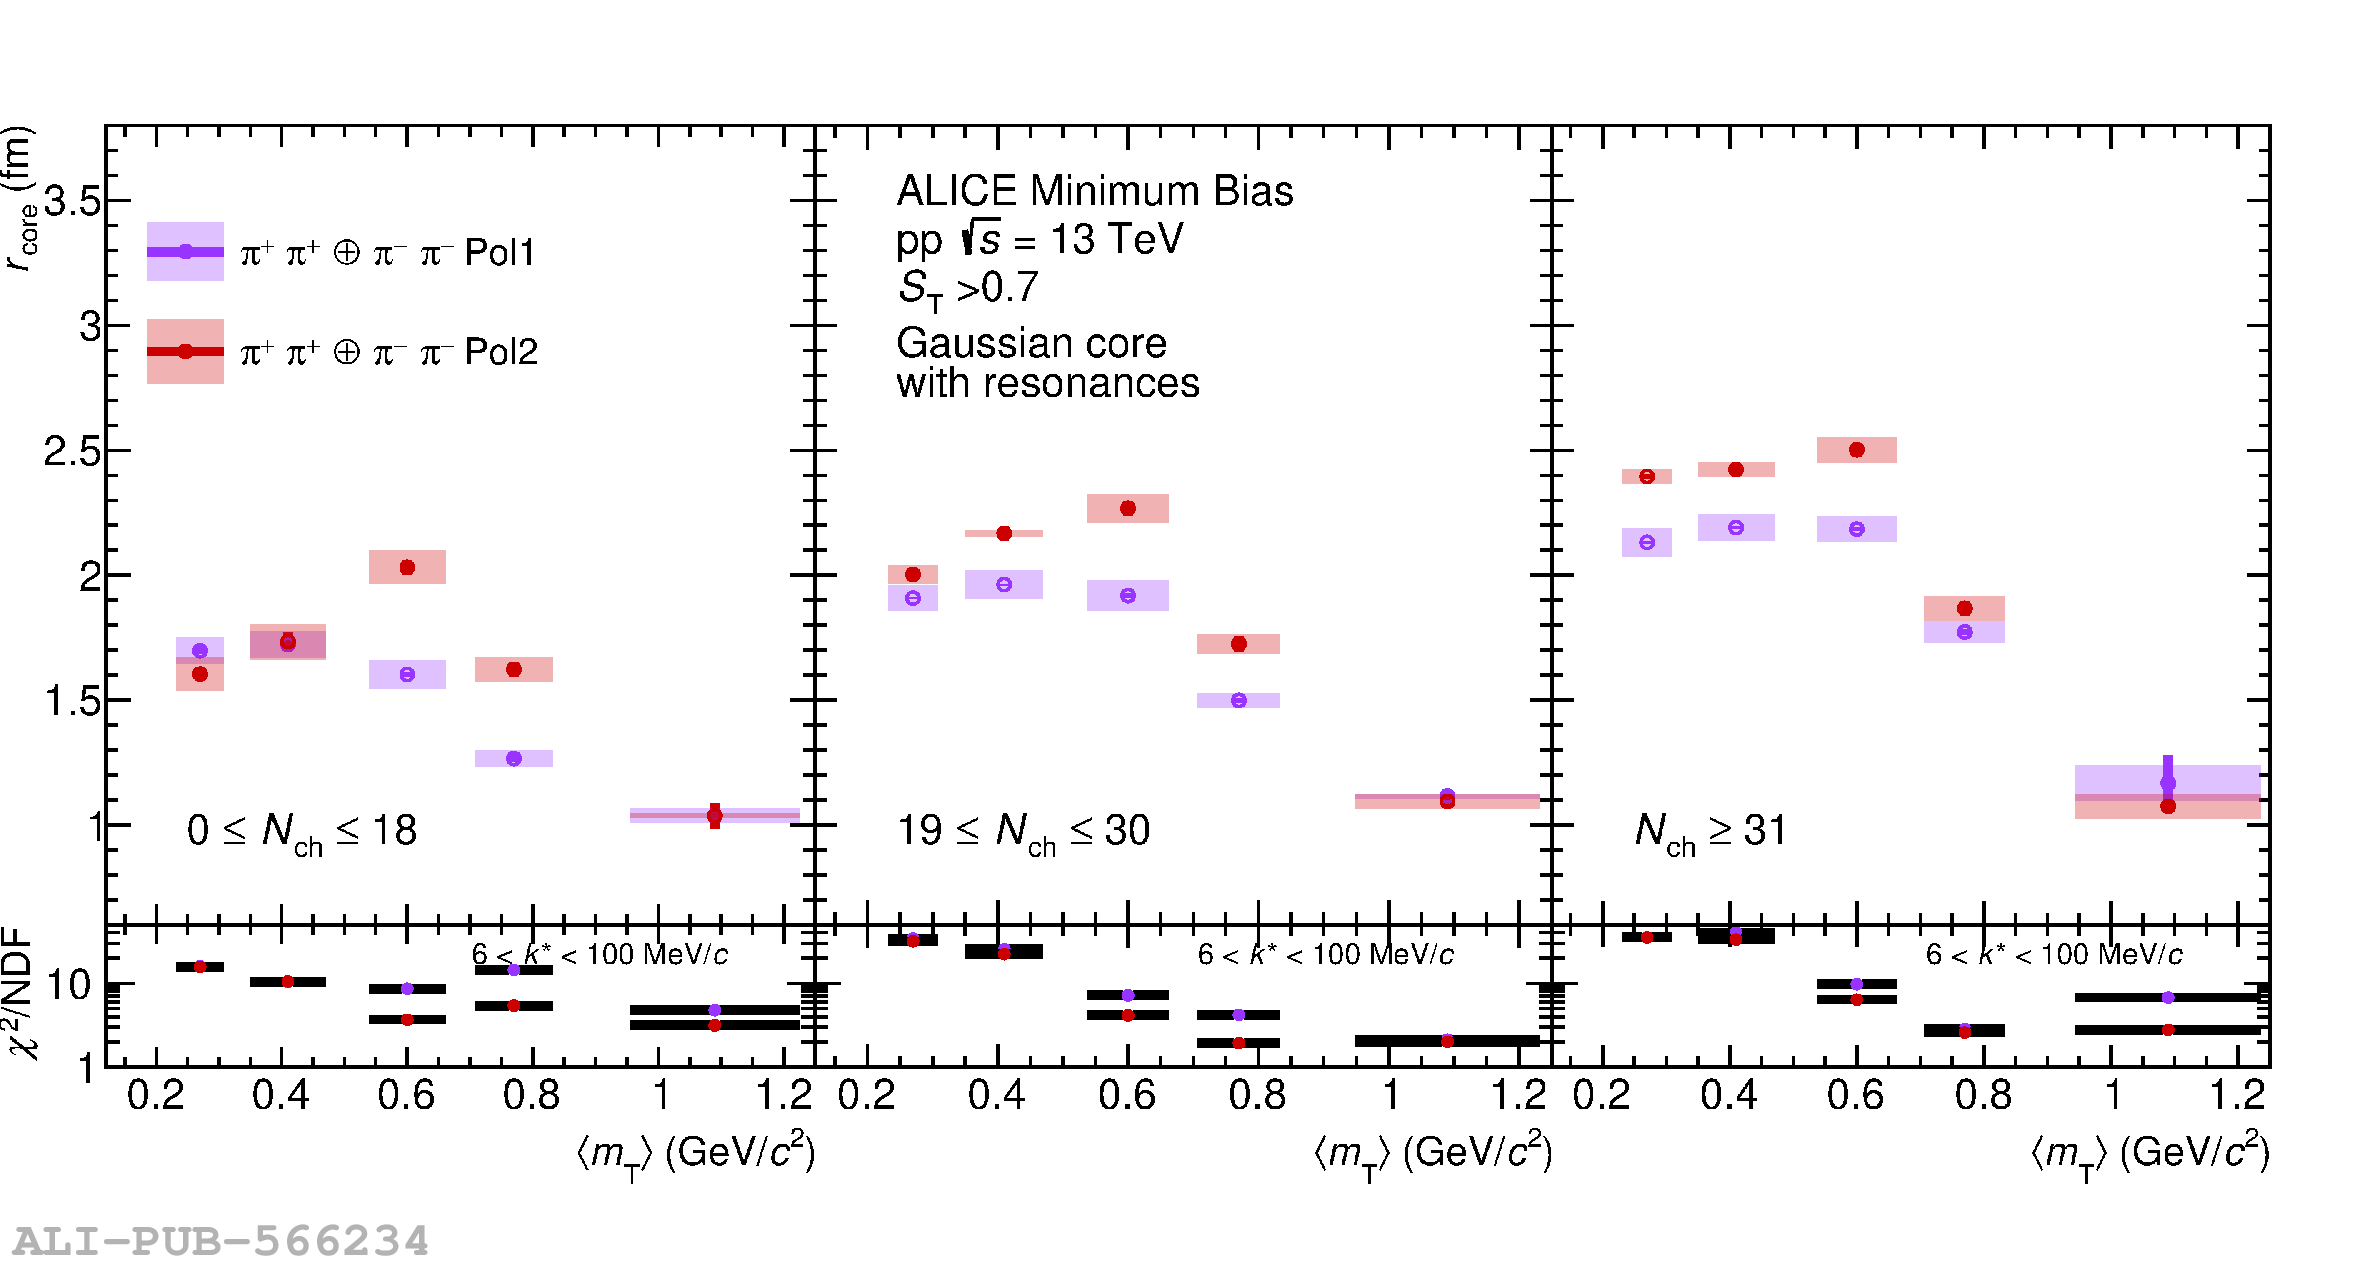 |
Figure A.1
Correlation functions of $\pi-\pi$ pairs in bins of $k_{\rm T}$ for $1\leq N_{\mathrm{ch}} \leq 18$, the fits are performed using CATS employing the RSM. The left (right) panels show the results assuming a polynomial of first (second) degree as background. The uncertainties of the data points are obtained by varying the selection criteria as described in the text. The uncertainty bands of the fit function are obtained by employing a bootstrap procedure. |  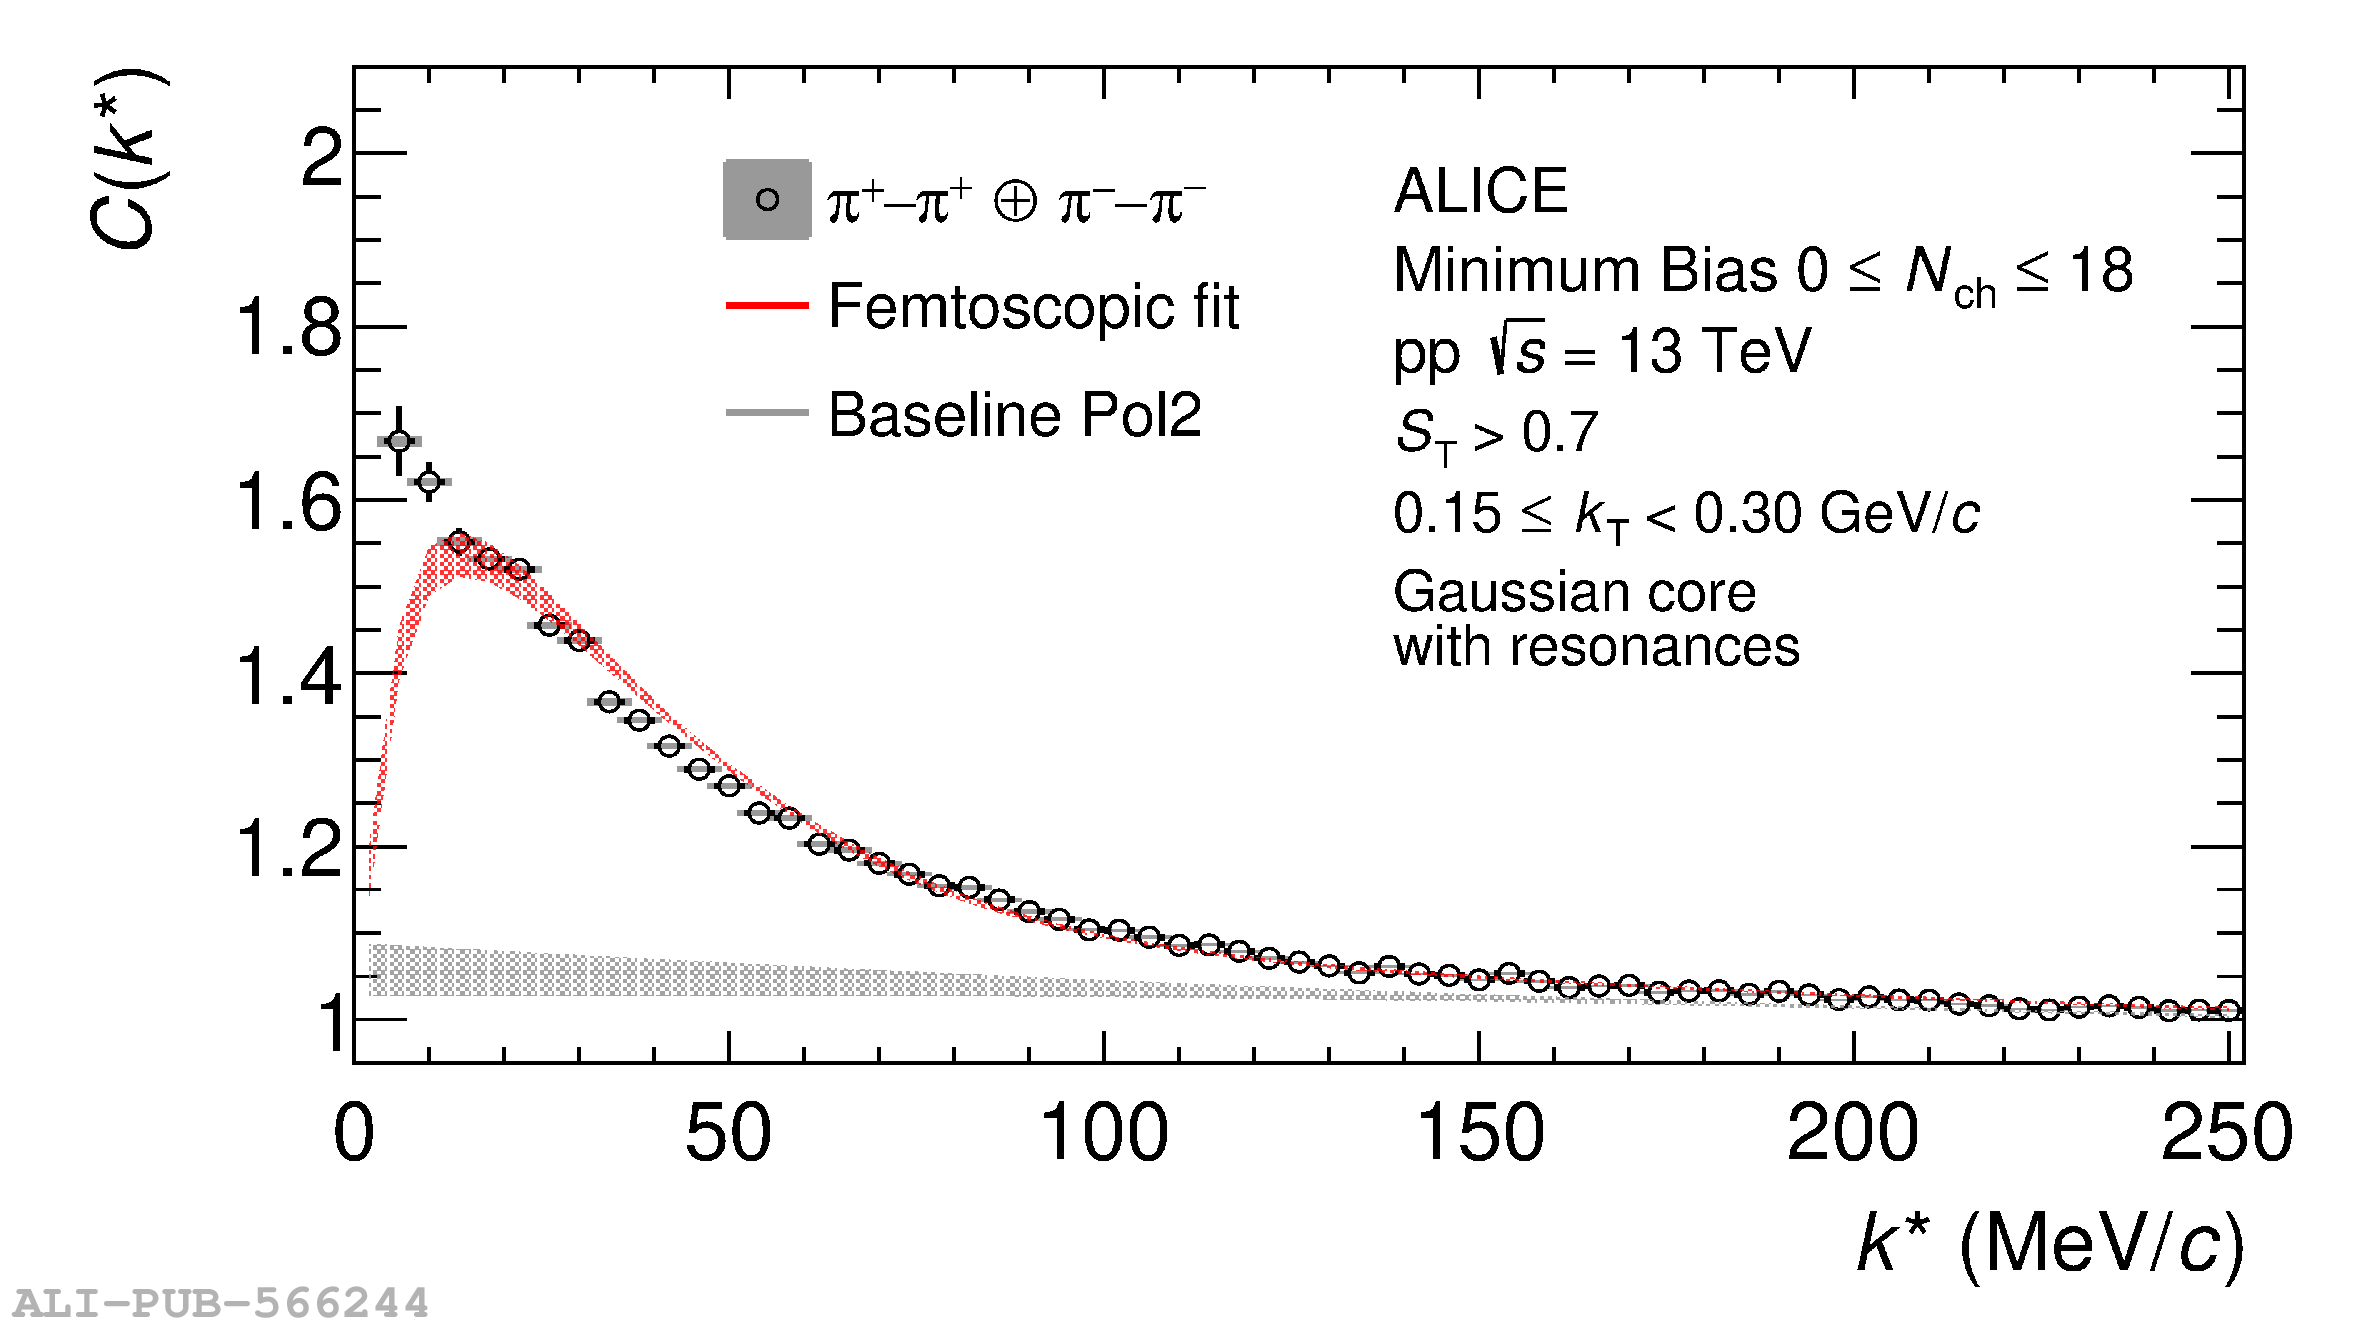 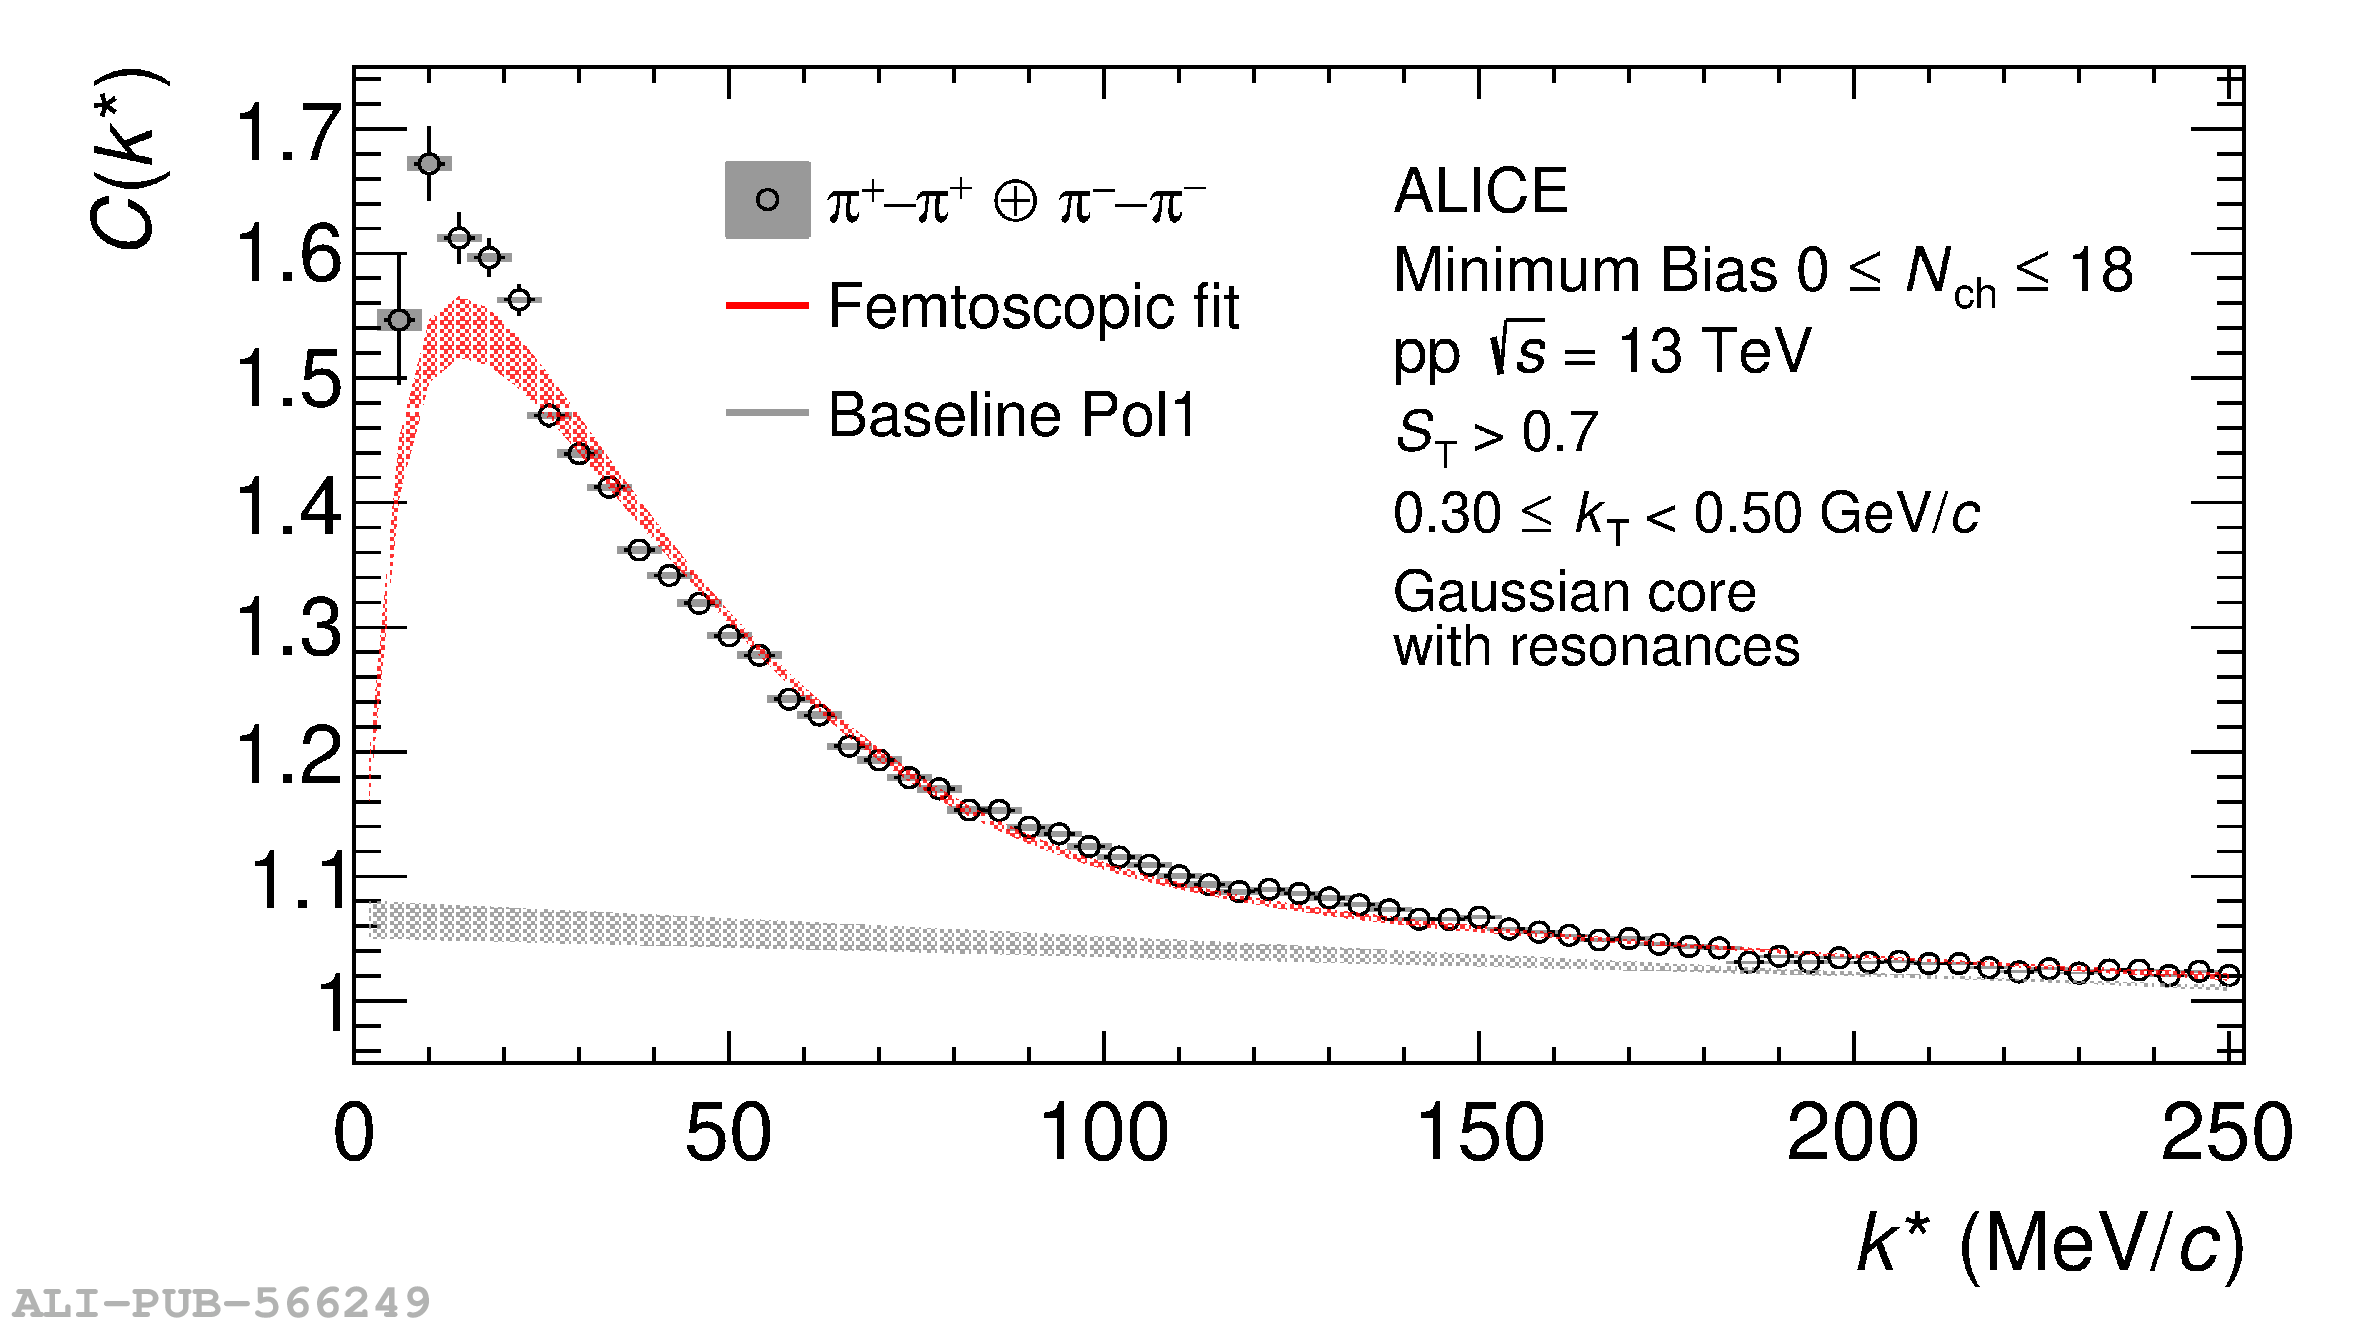 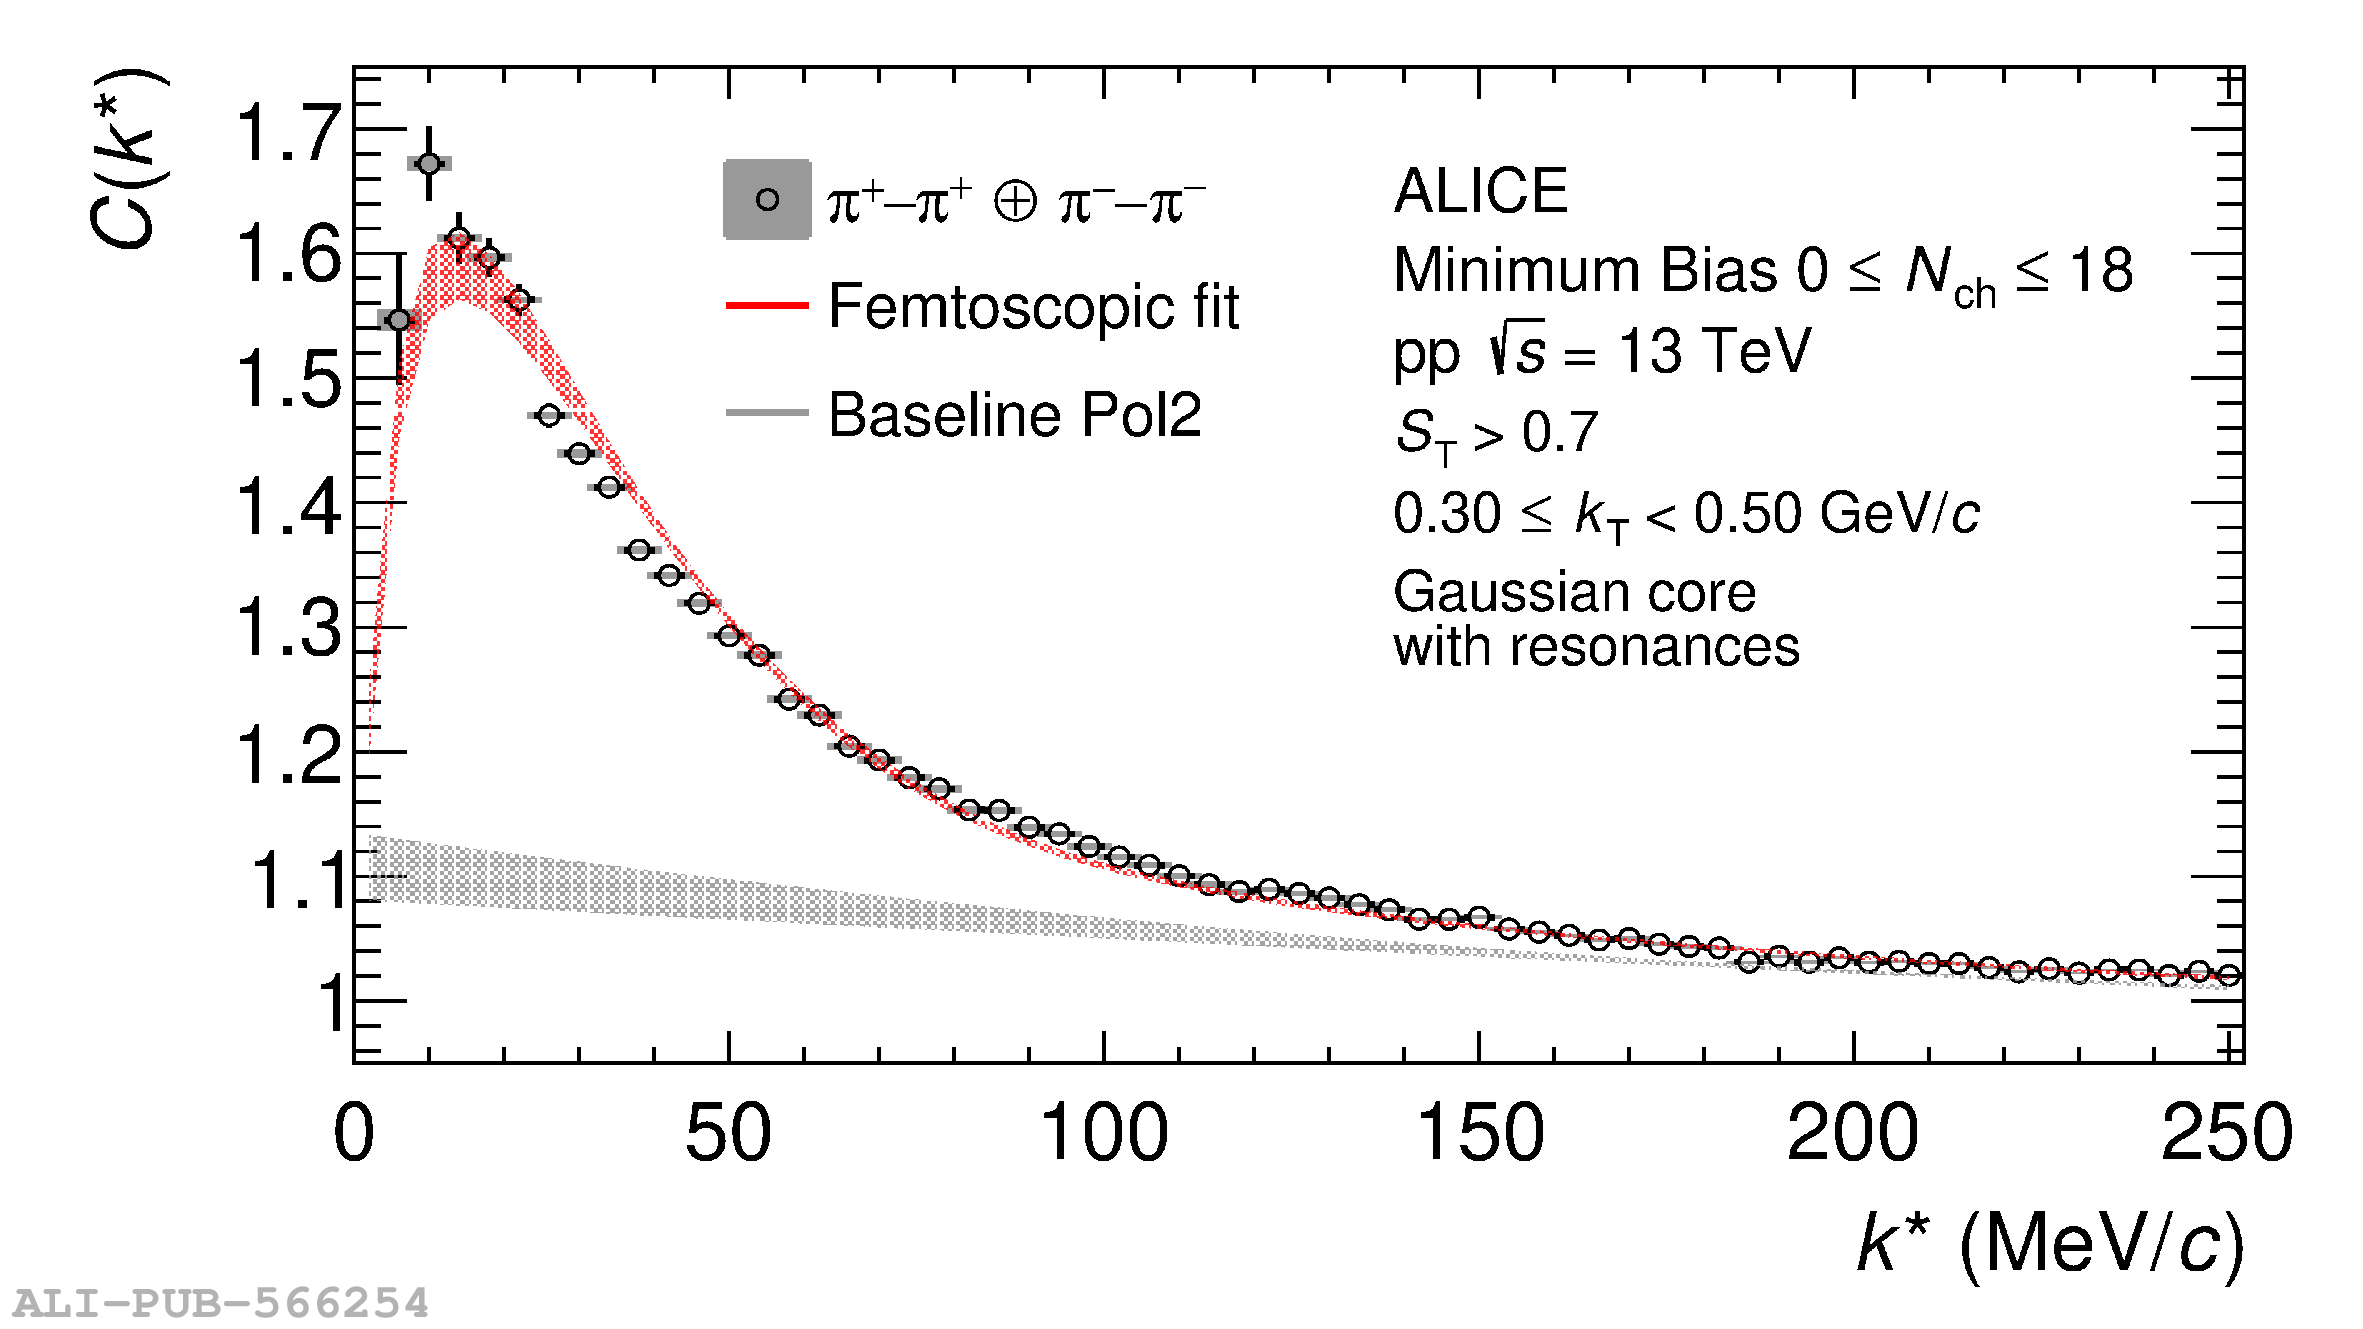 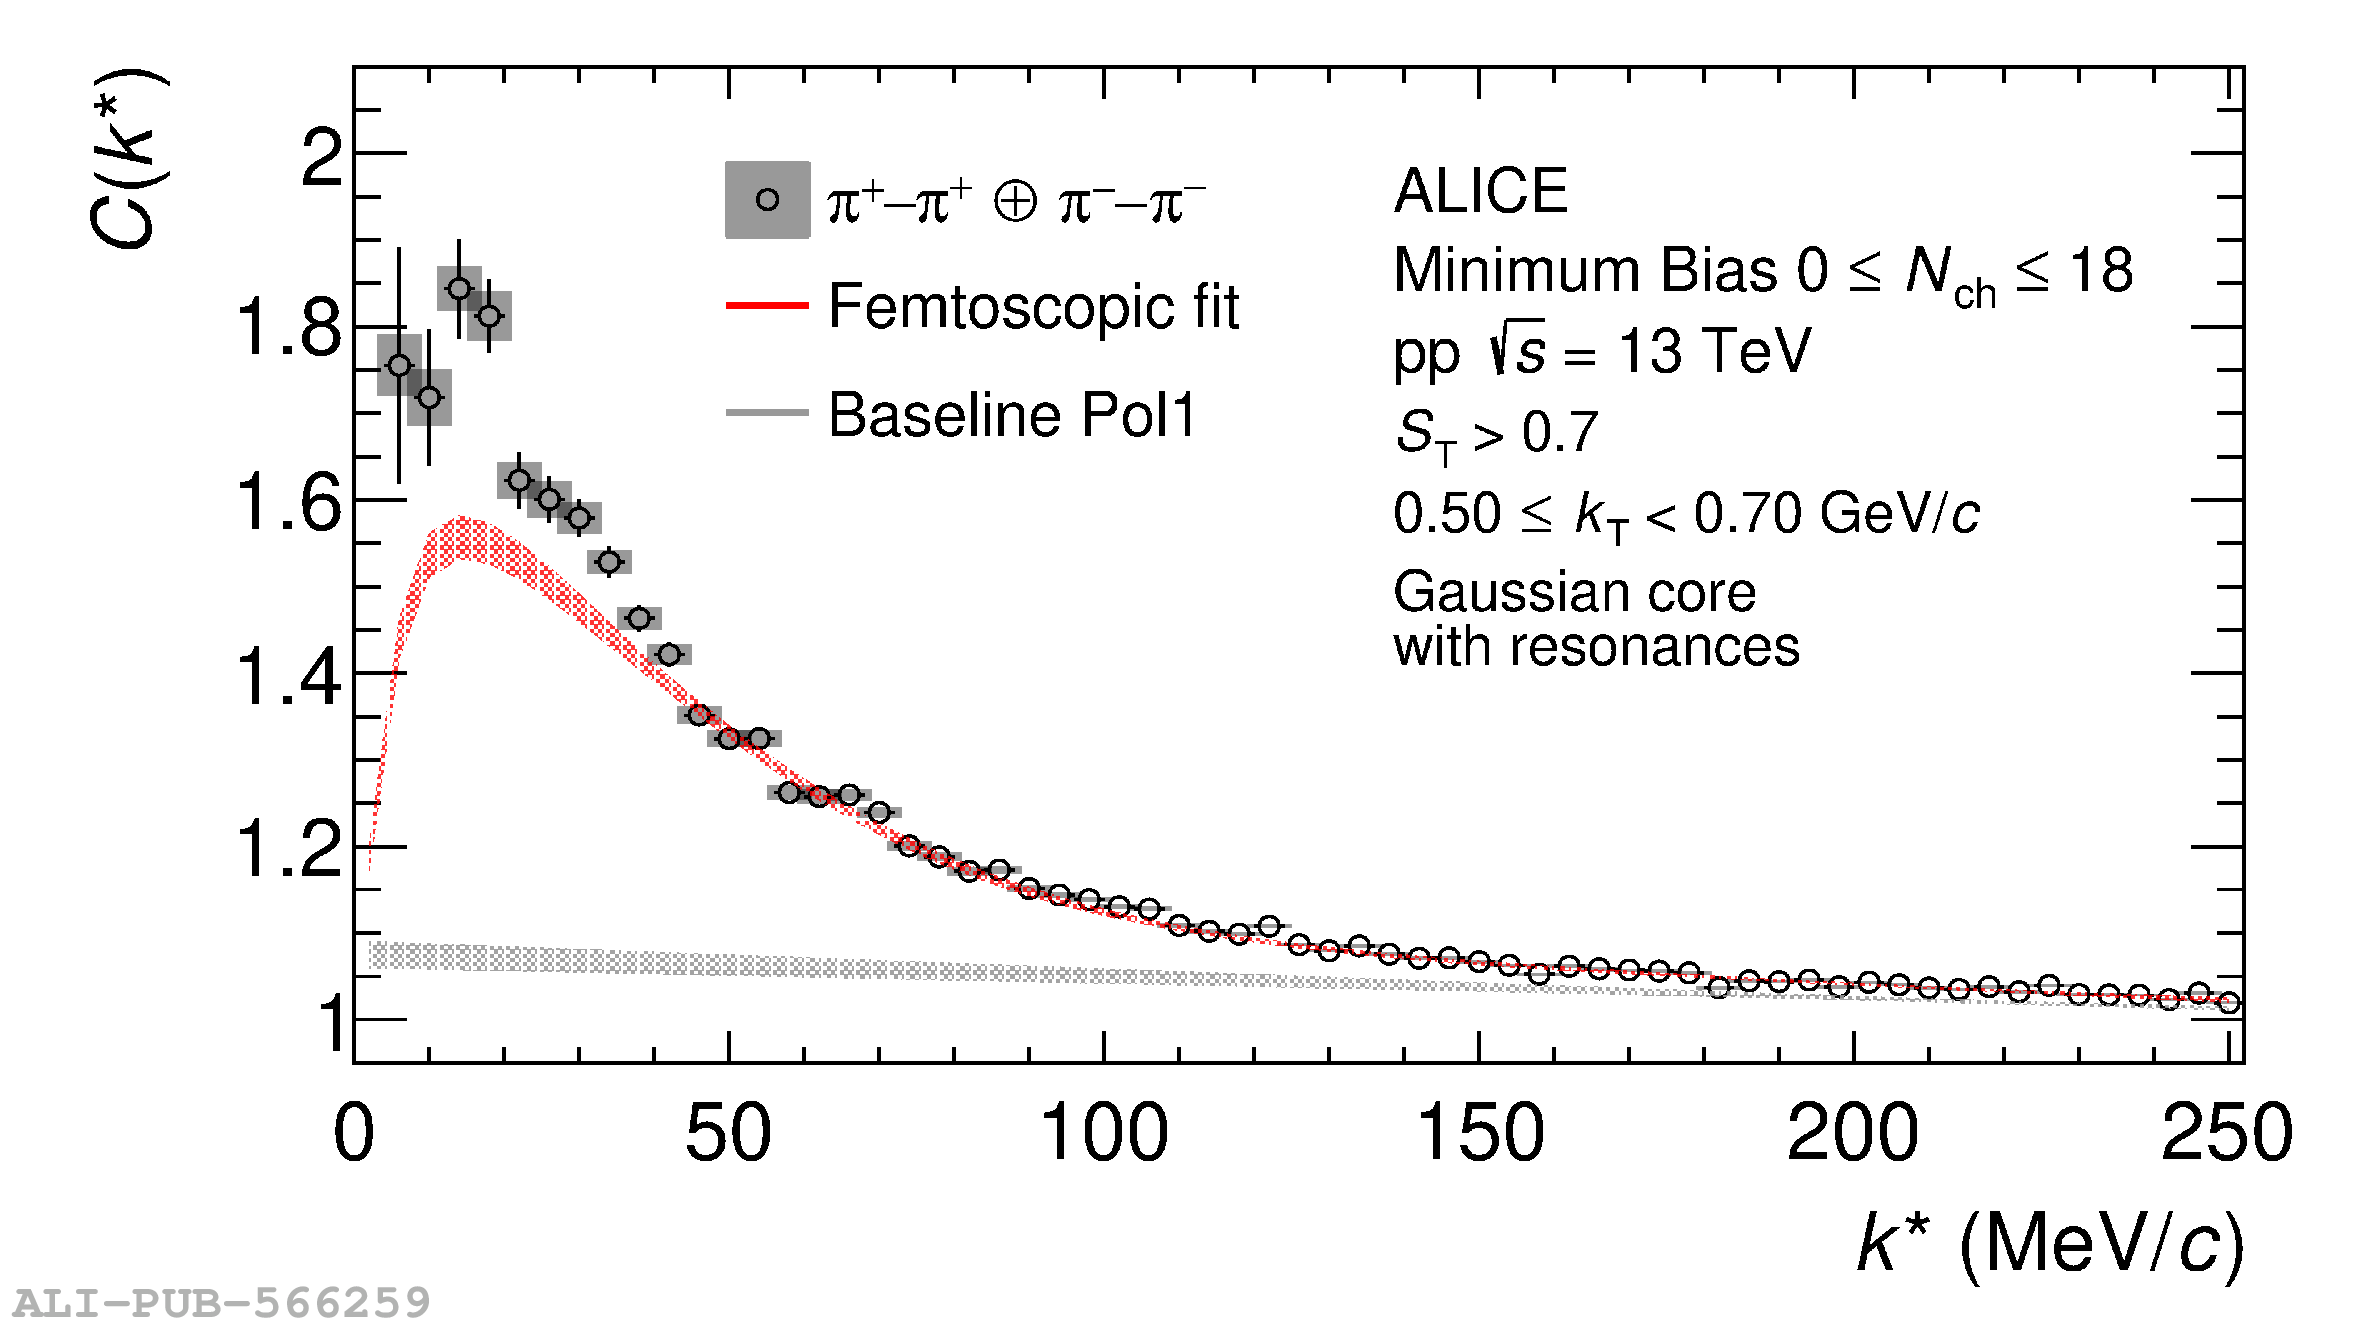 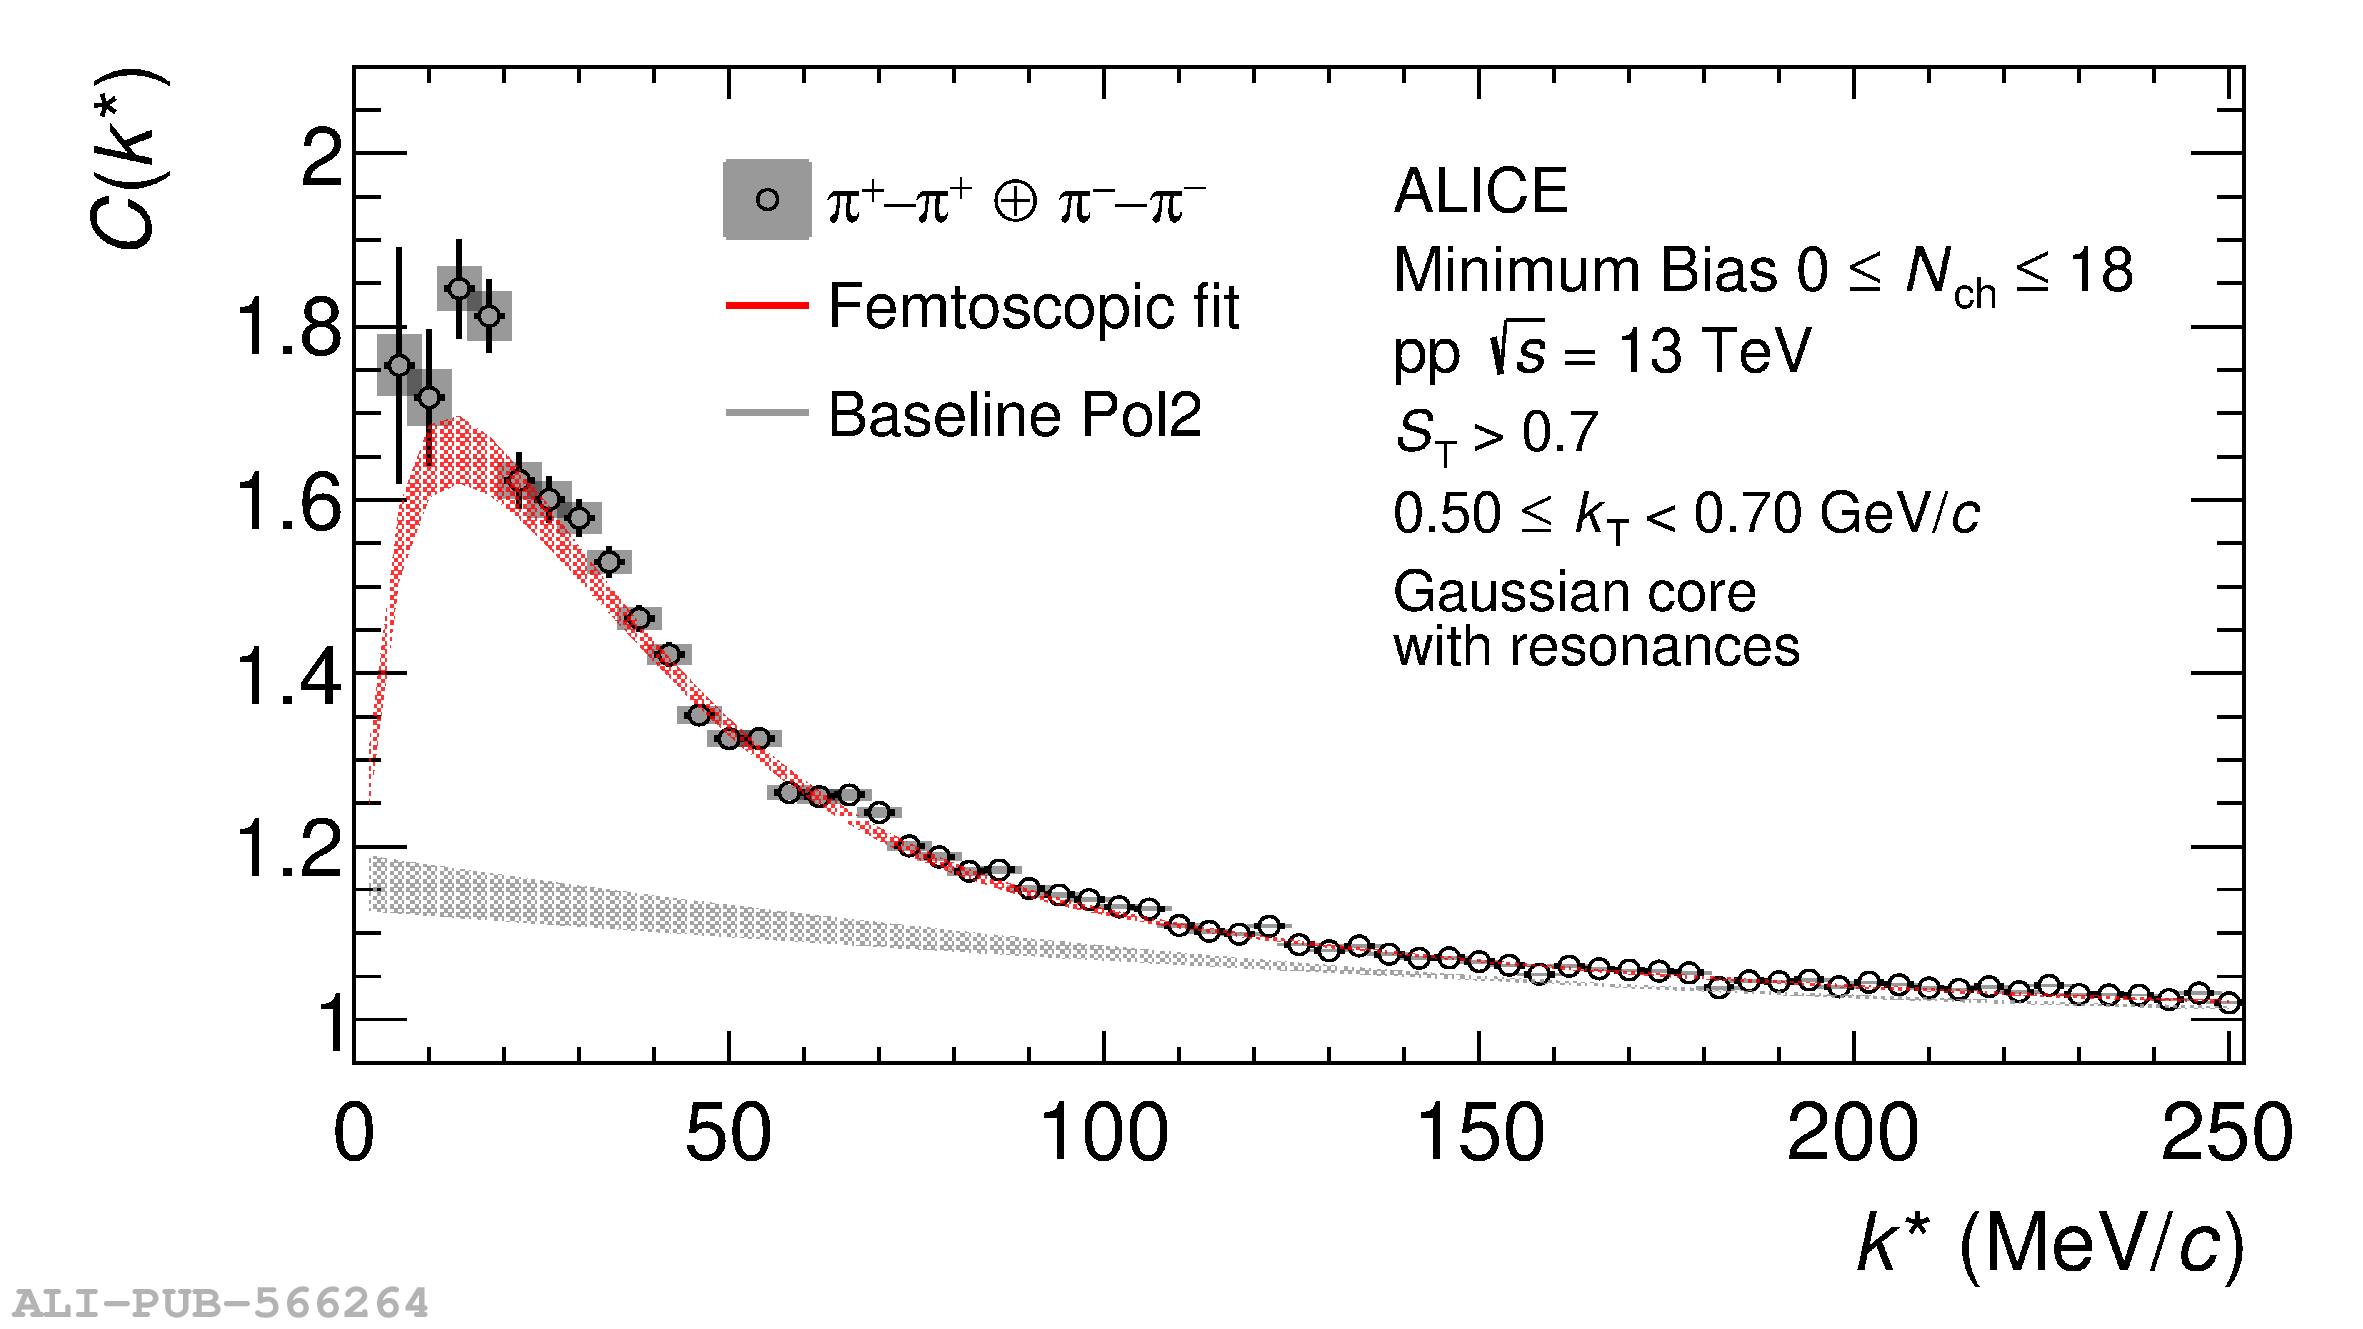 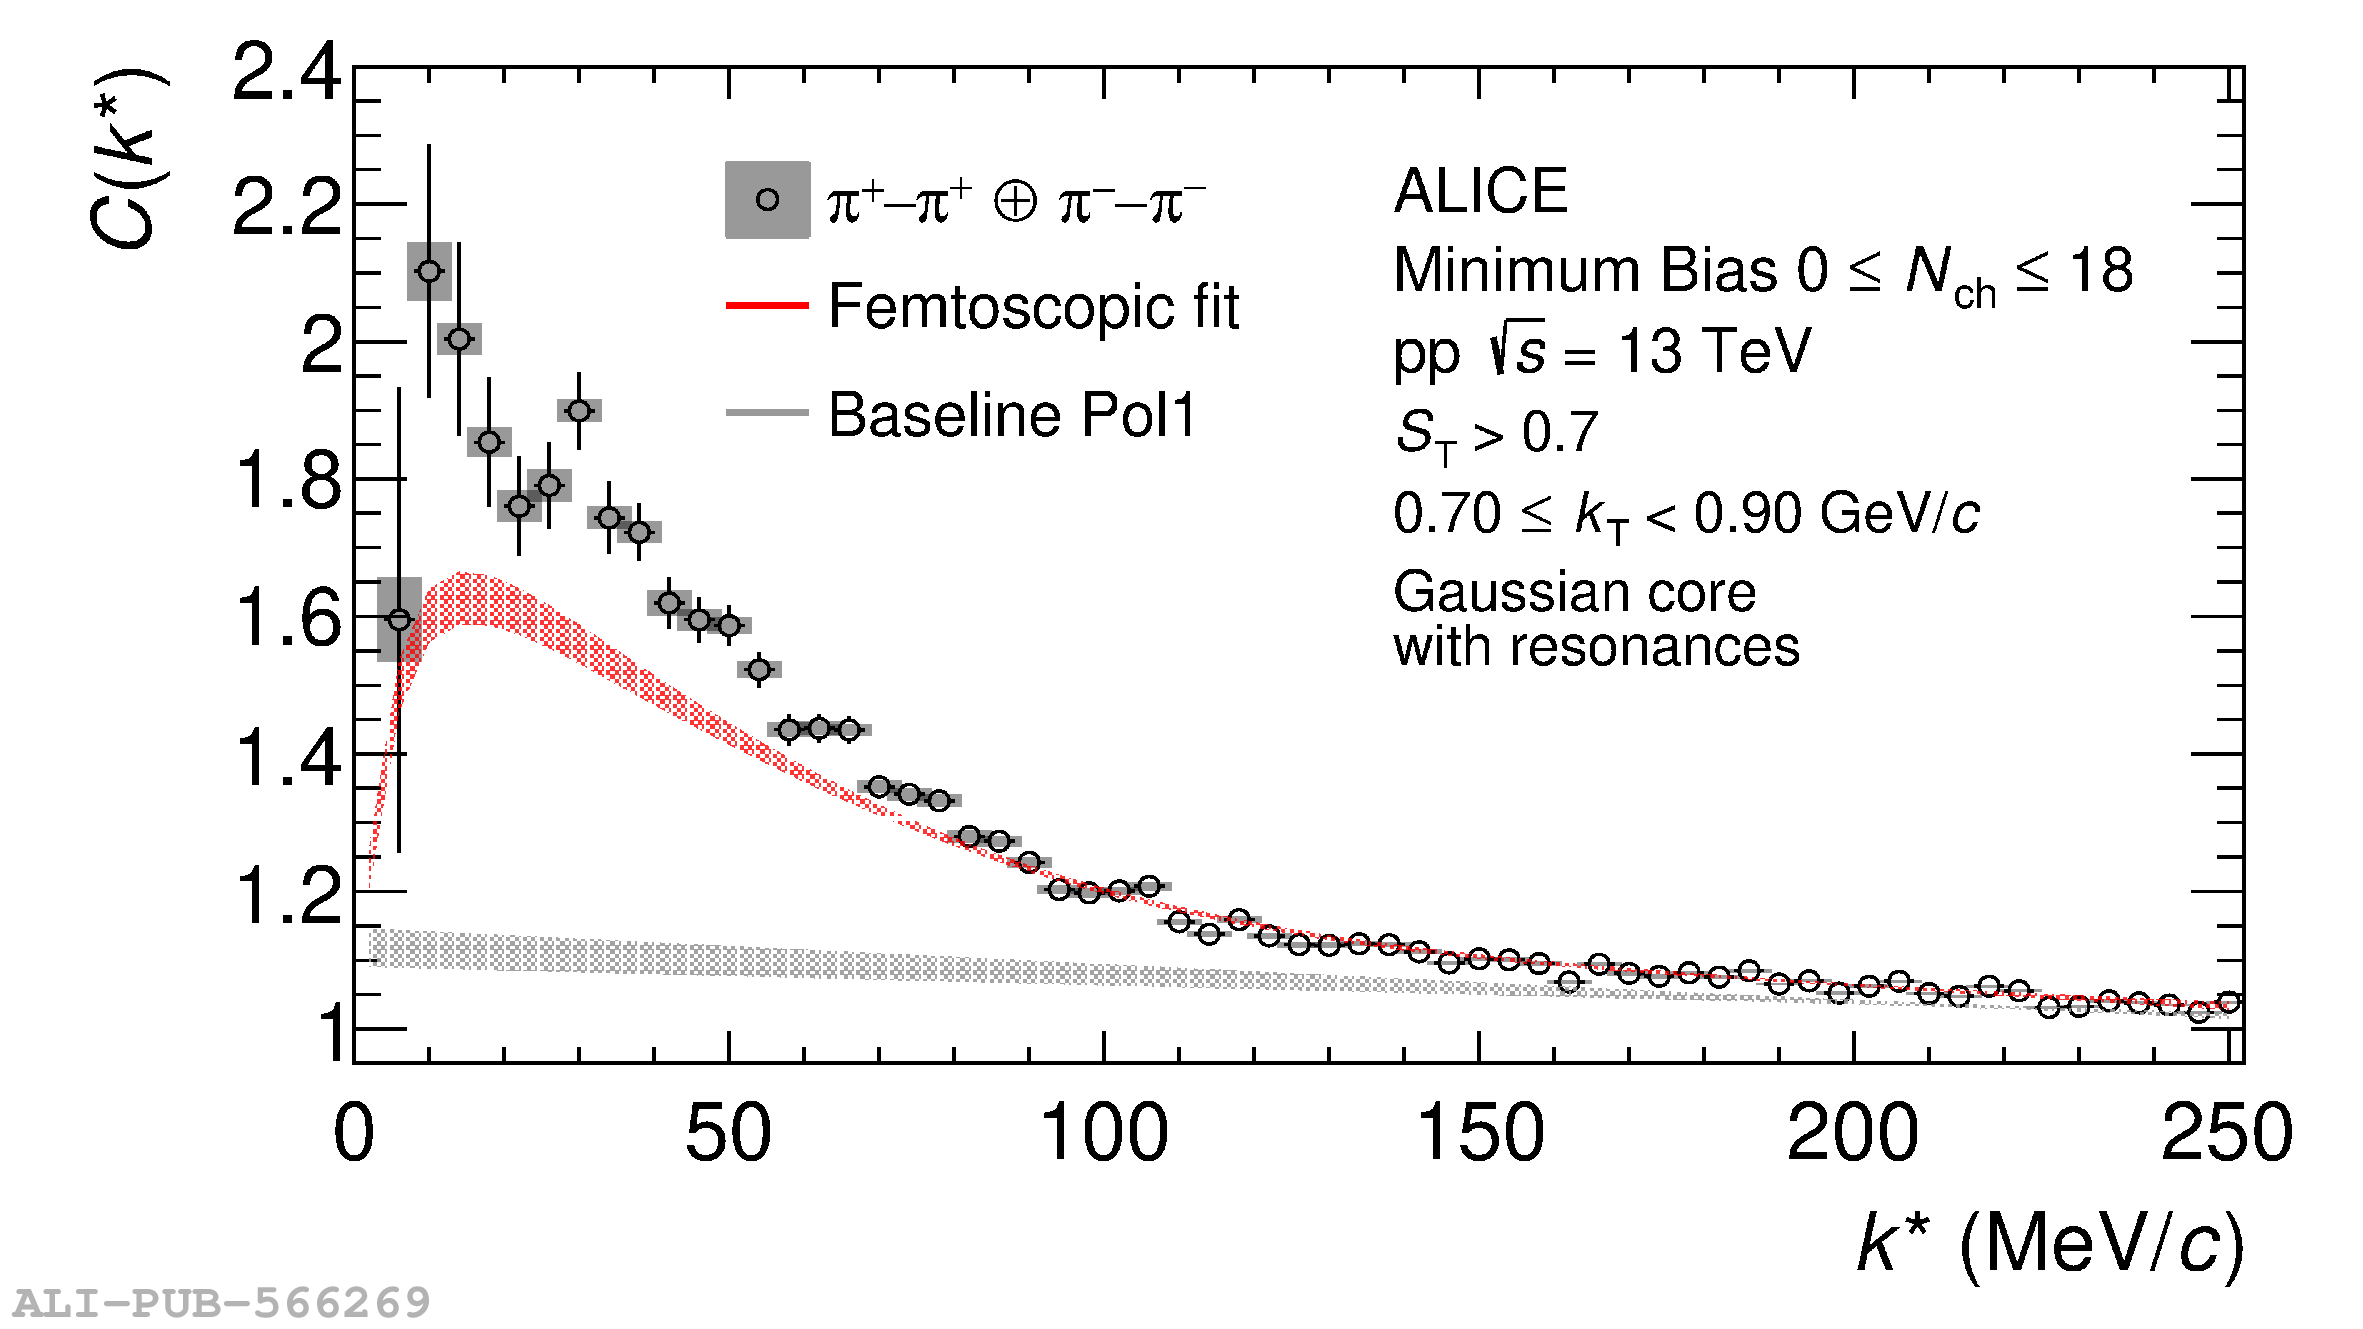 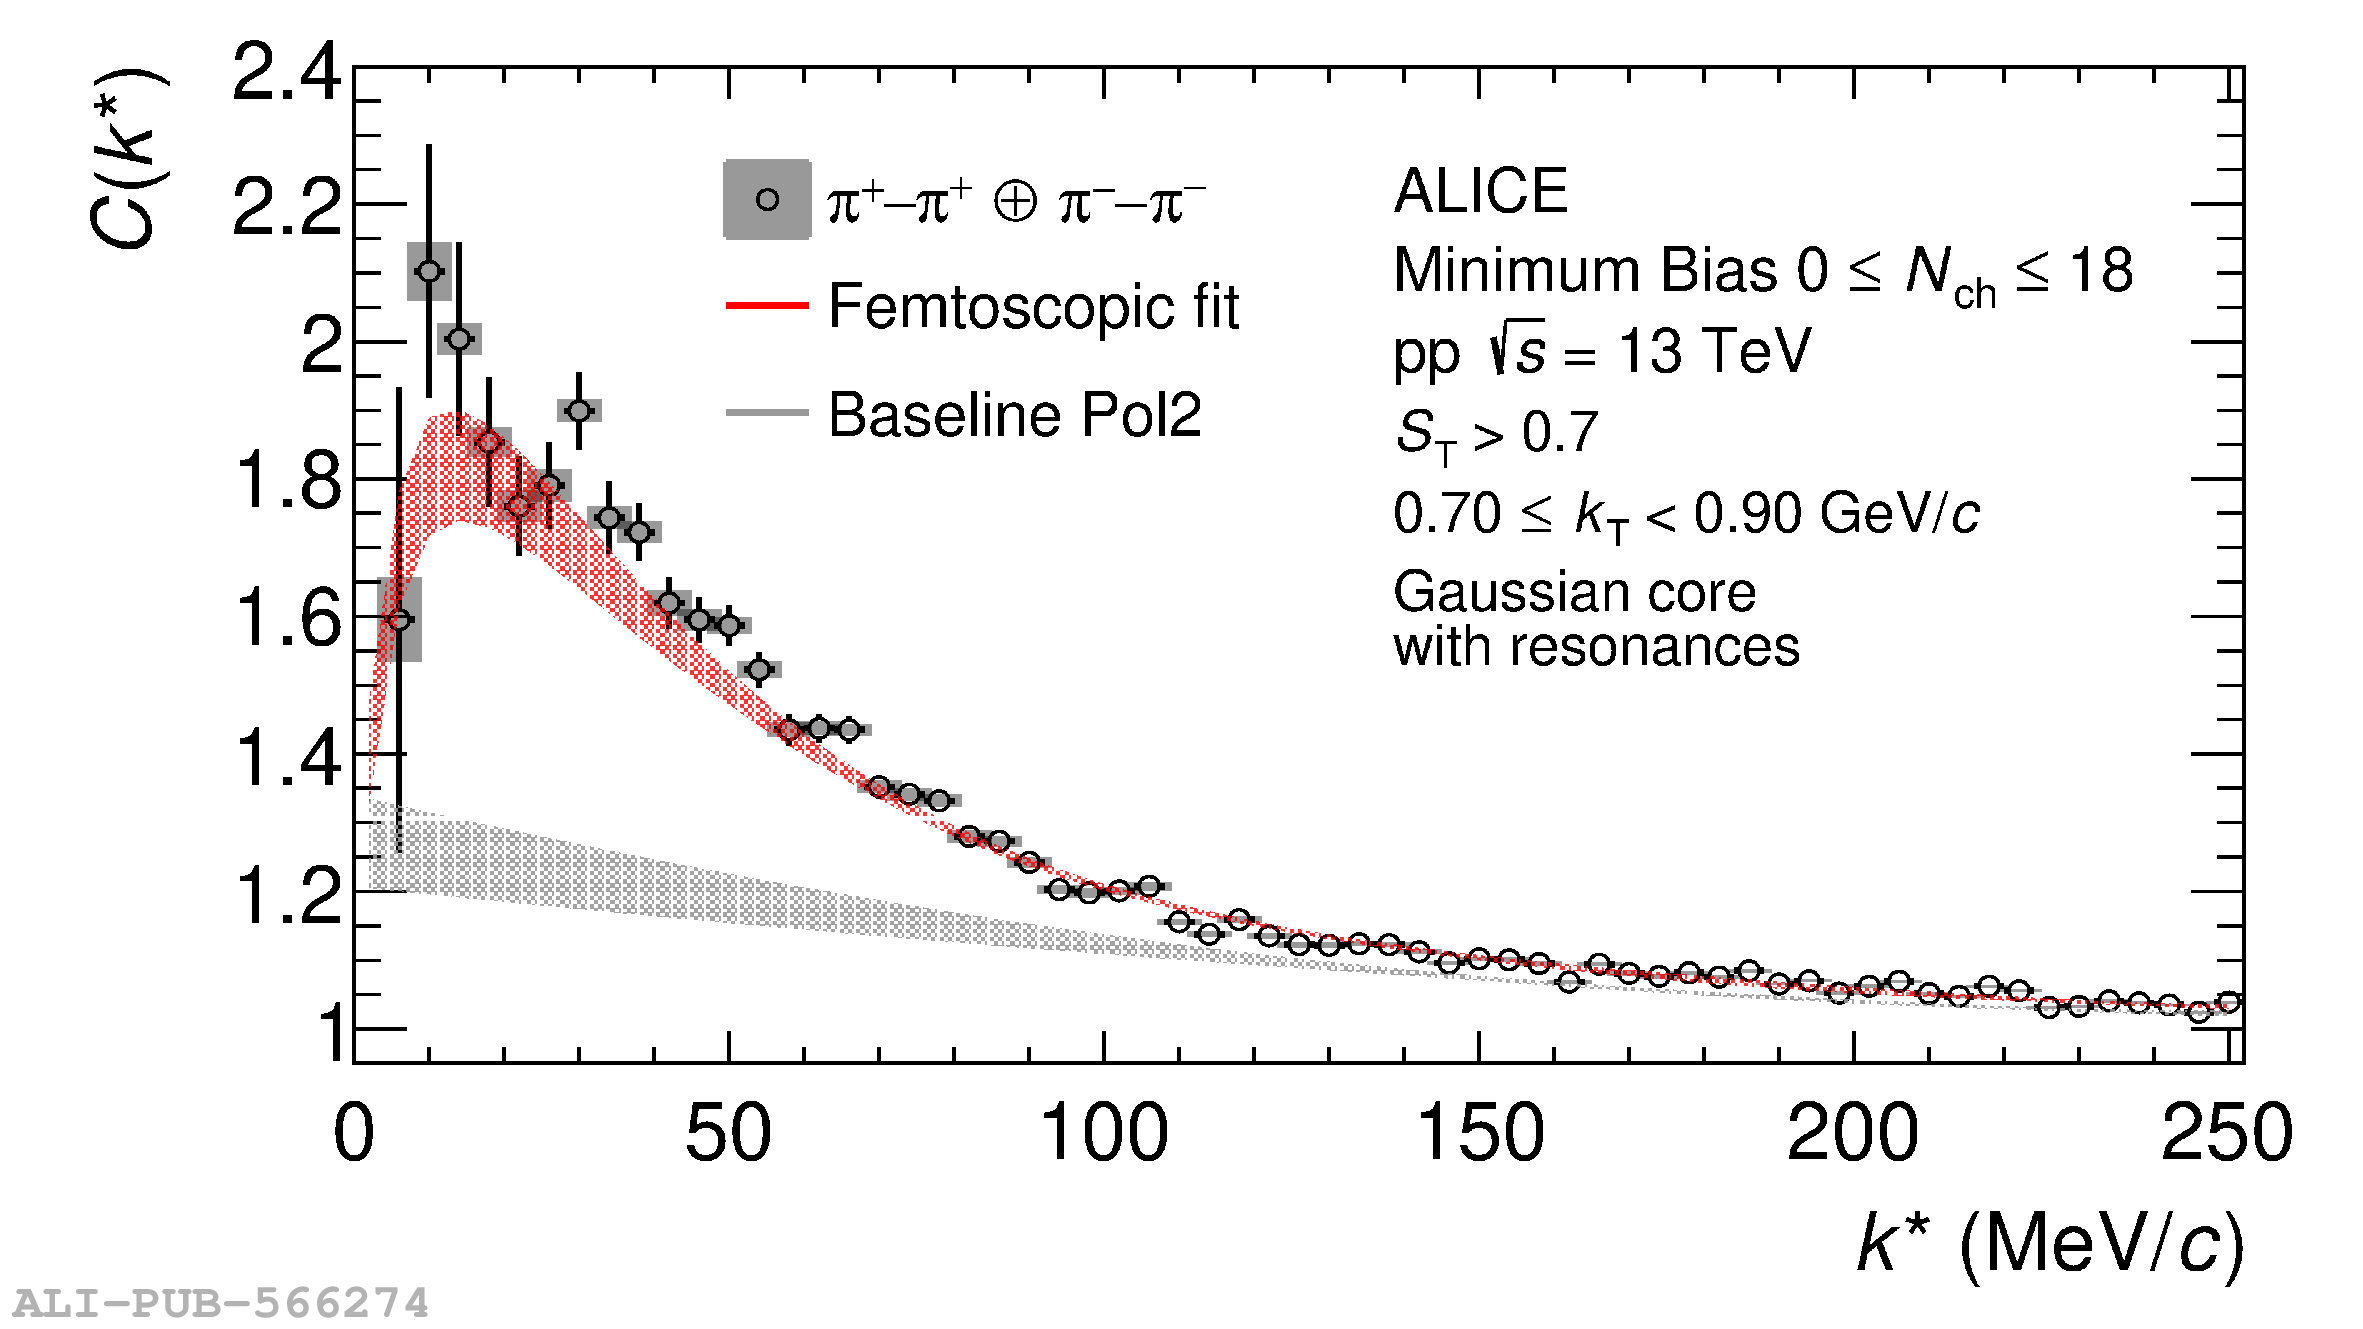 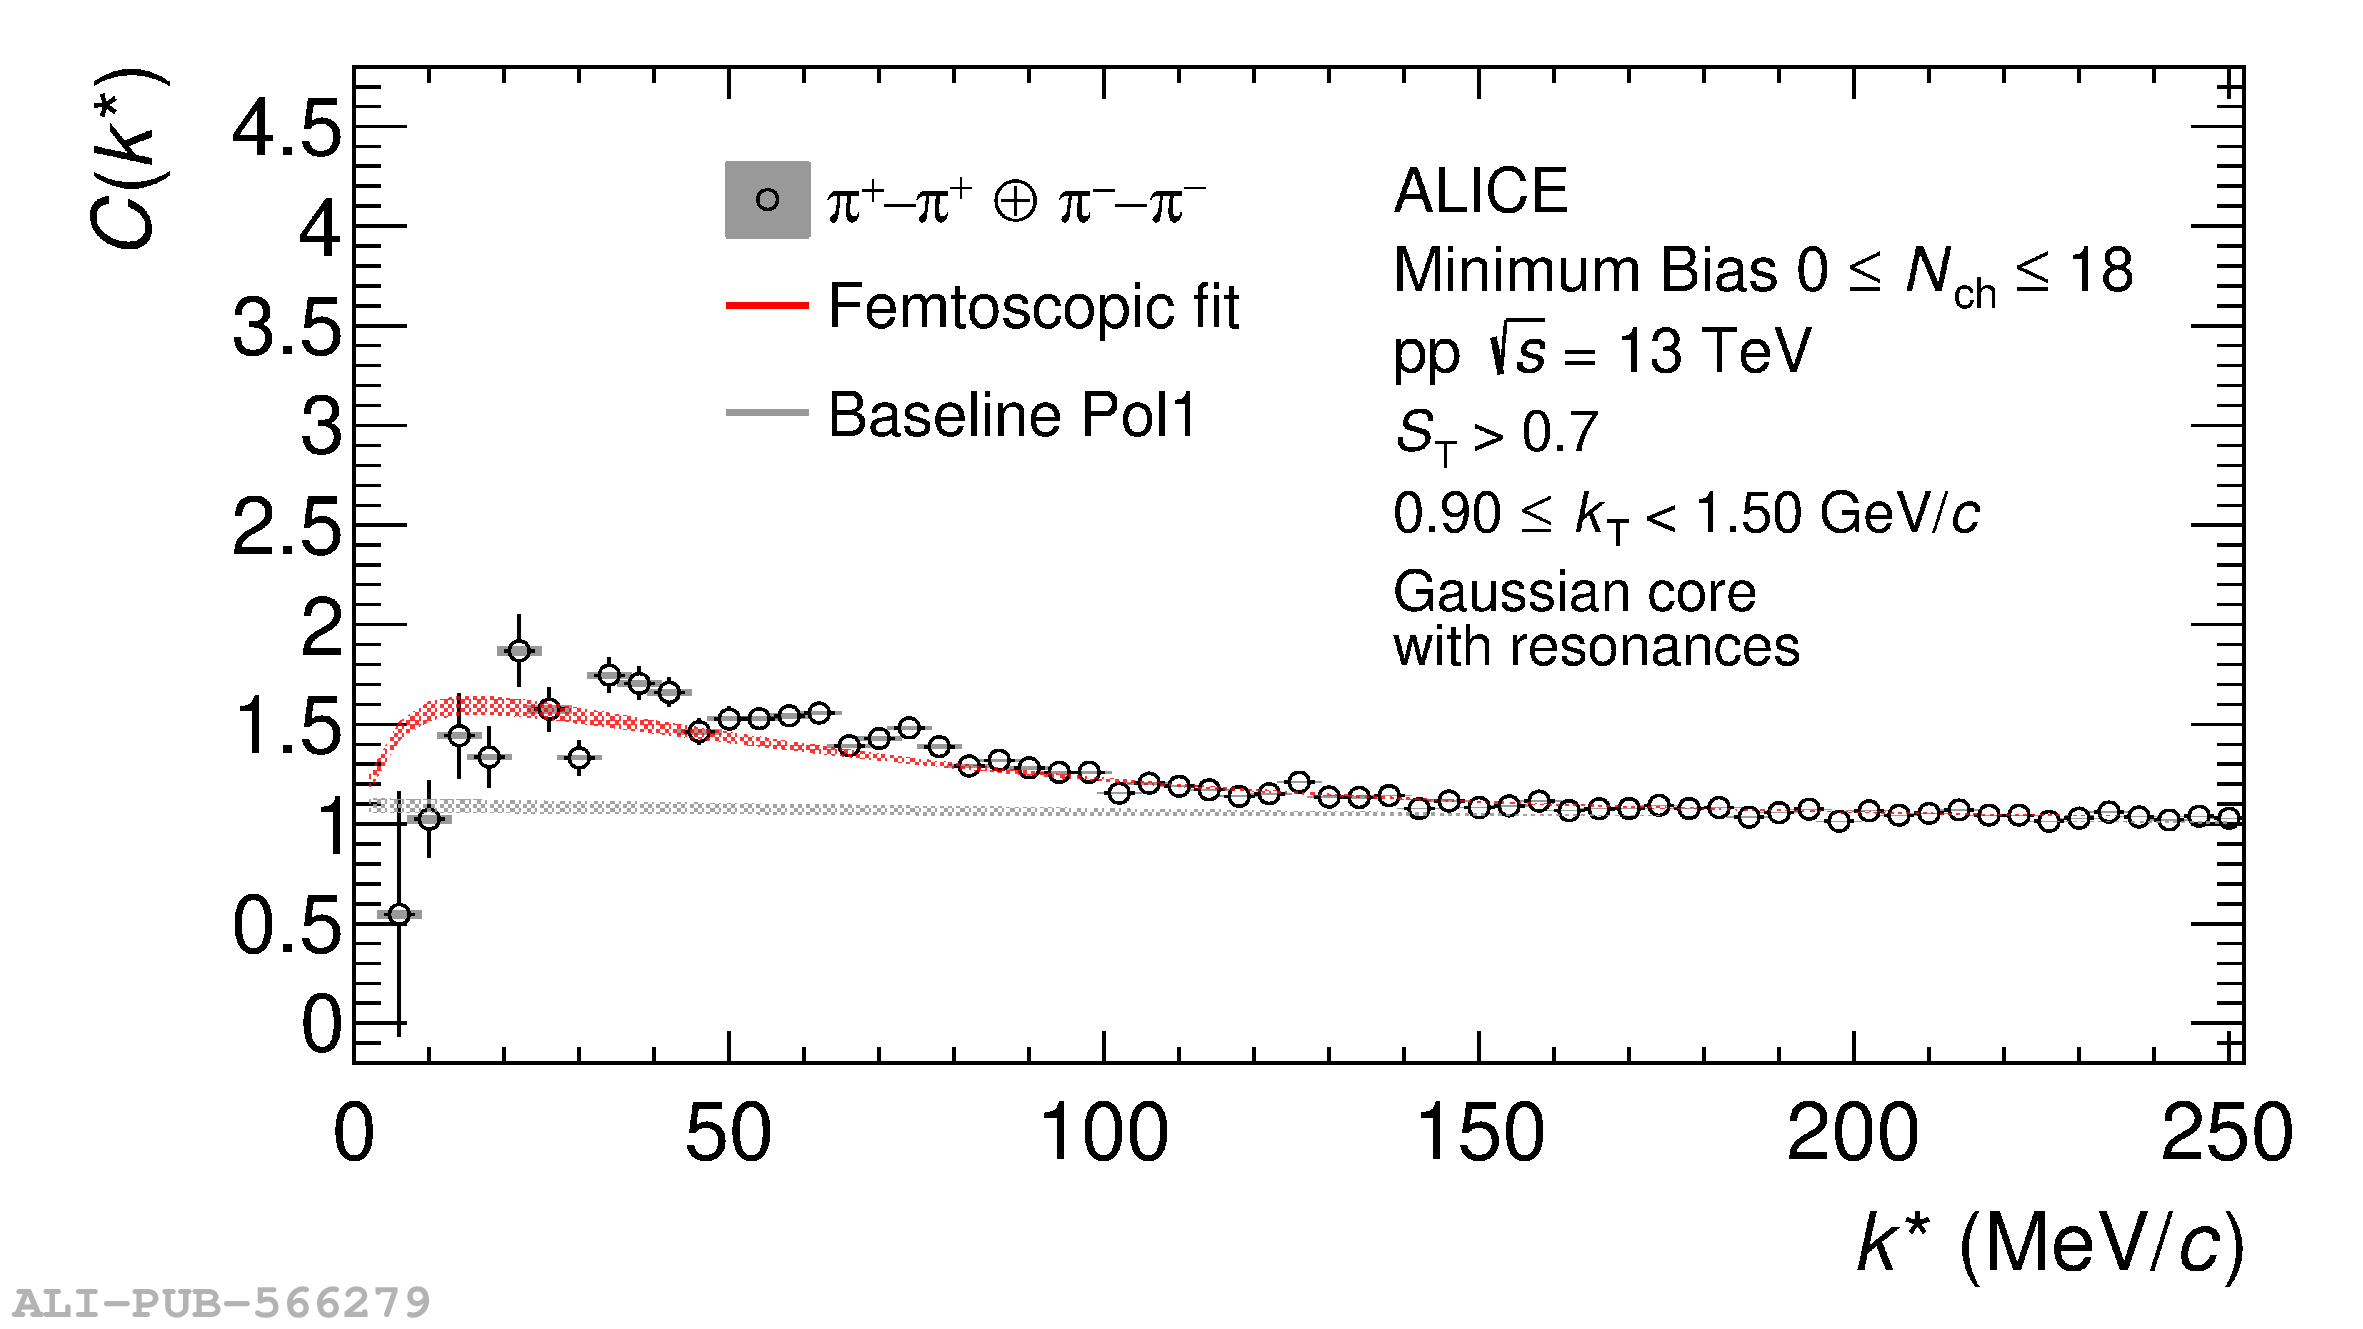 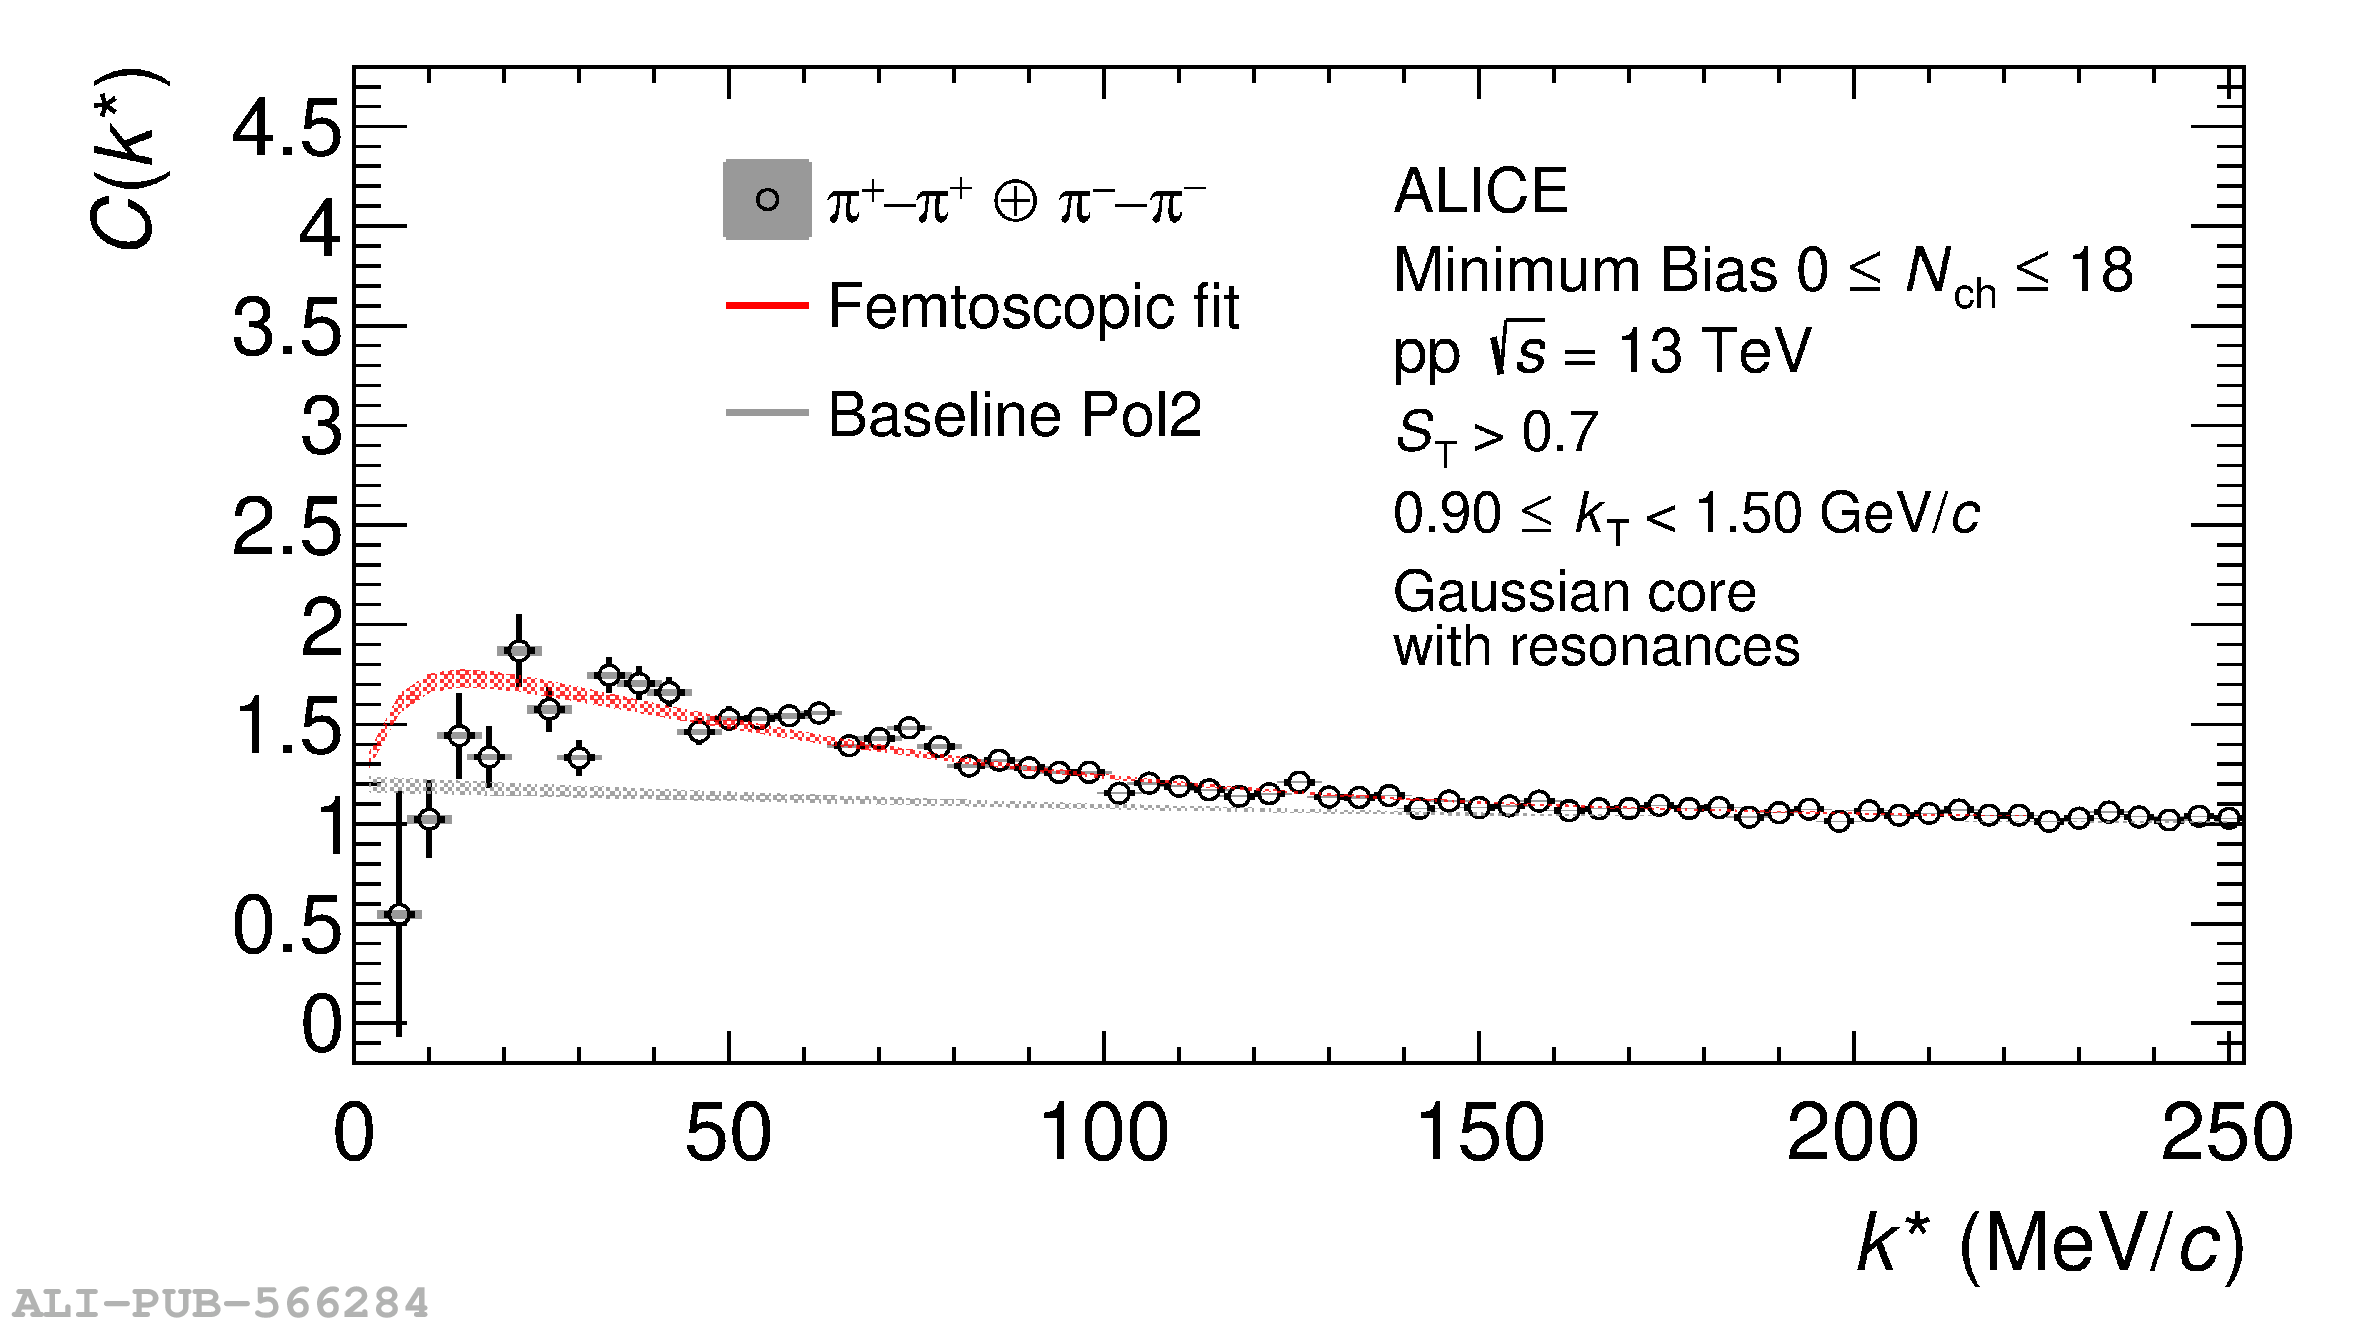 |
Figure A.2
Correlation functions of $\pi-\pi$ pairs in bins of $k_{\rm T}$ for $19\leq N_{\mathrm{ch}}\leq 30$, the fits are performed using CATS employing the RSM. The left (right) panels show the results assuming a polynomial of first (second) degree as background. The uncertainties of the data points are obtained by varying the selection criteria as described in the text. The uncertainty bands of the fit function are obtained by employing a bootstrap procedure. | 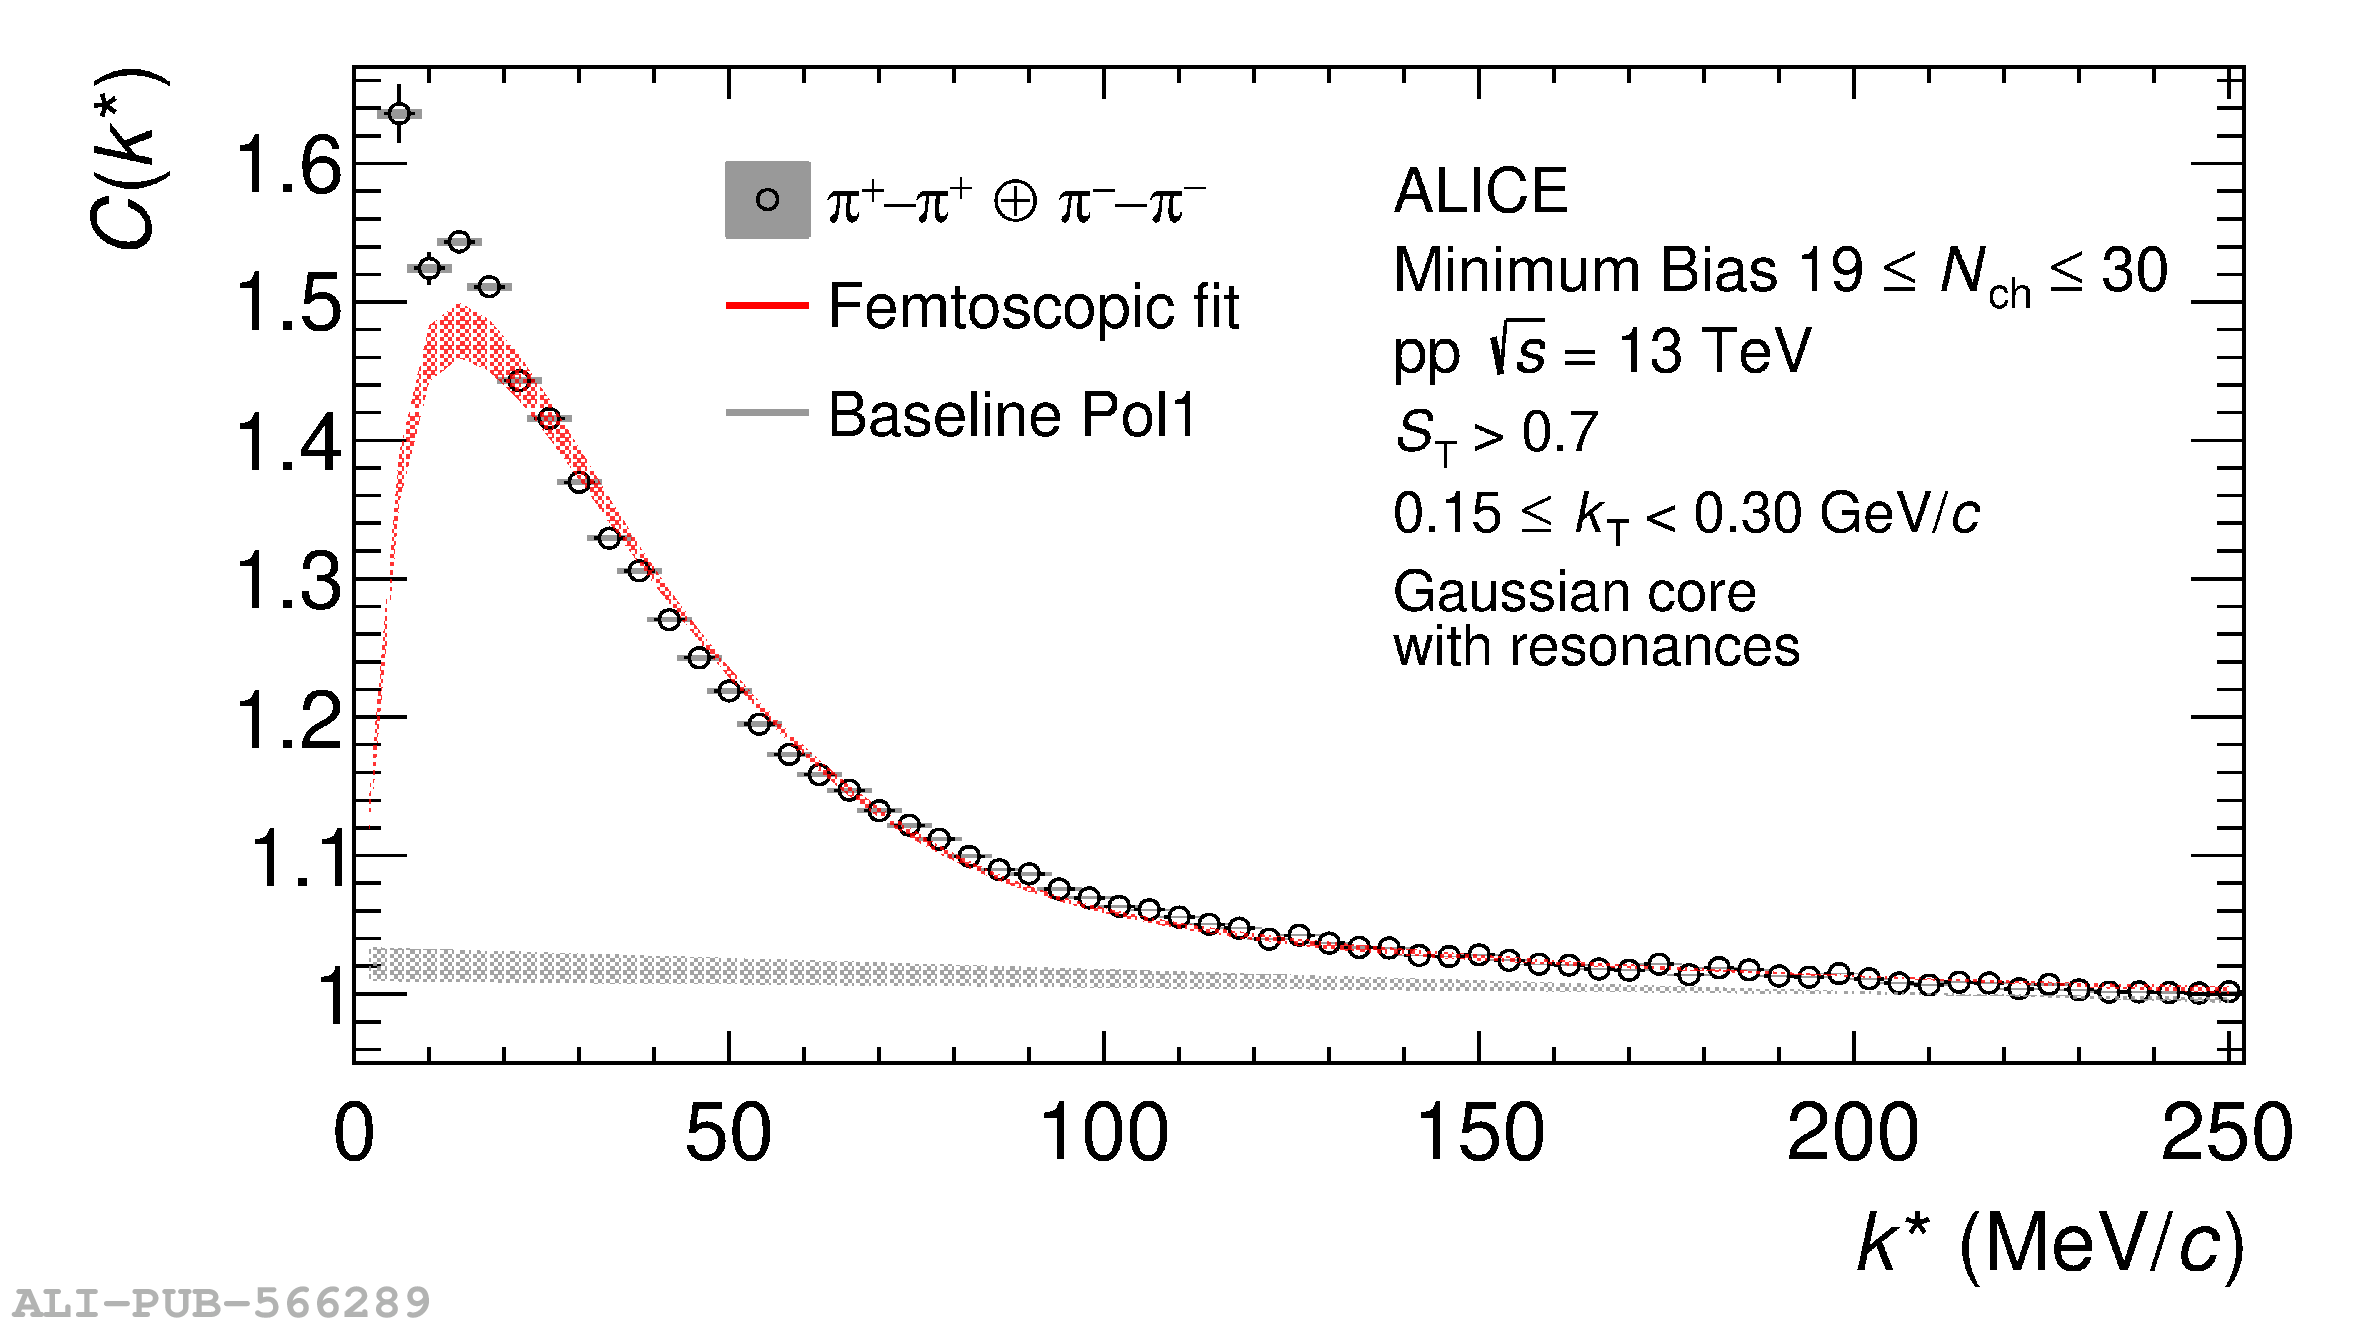 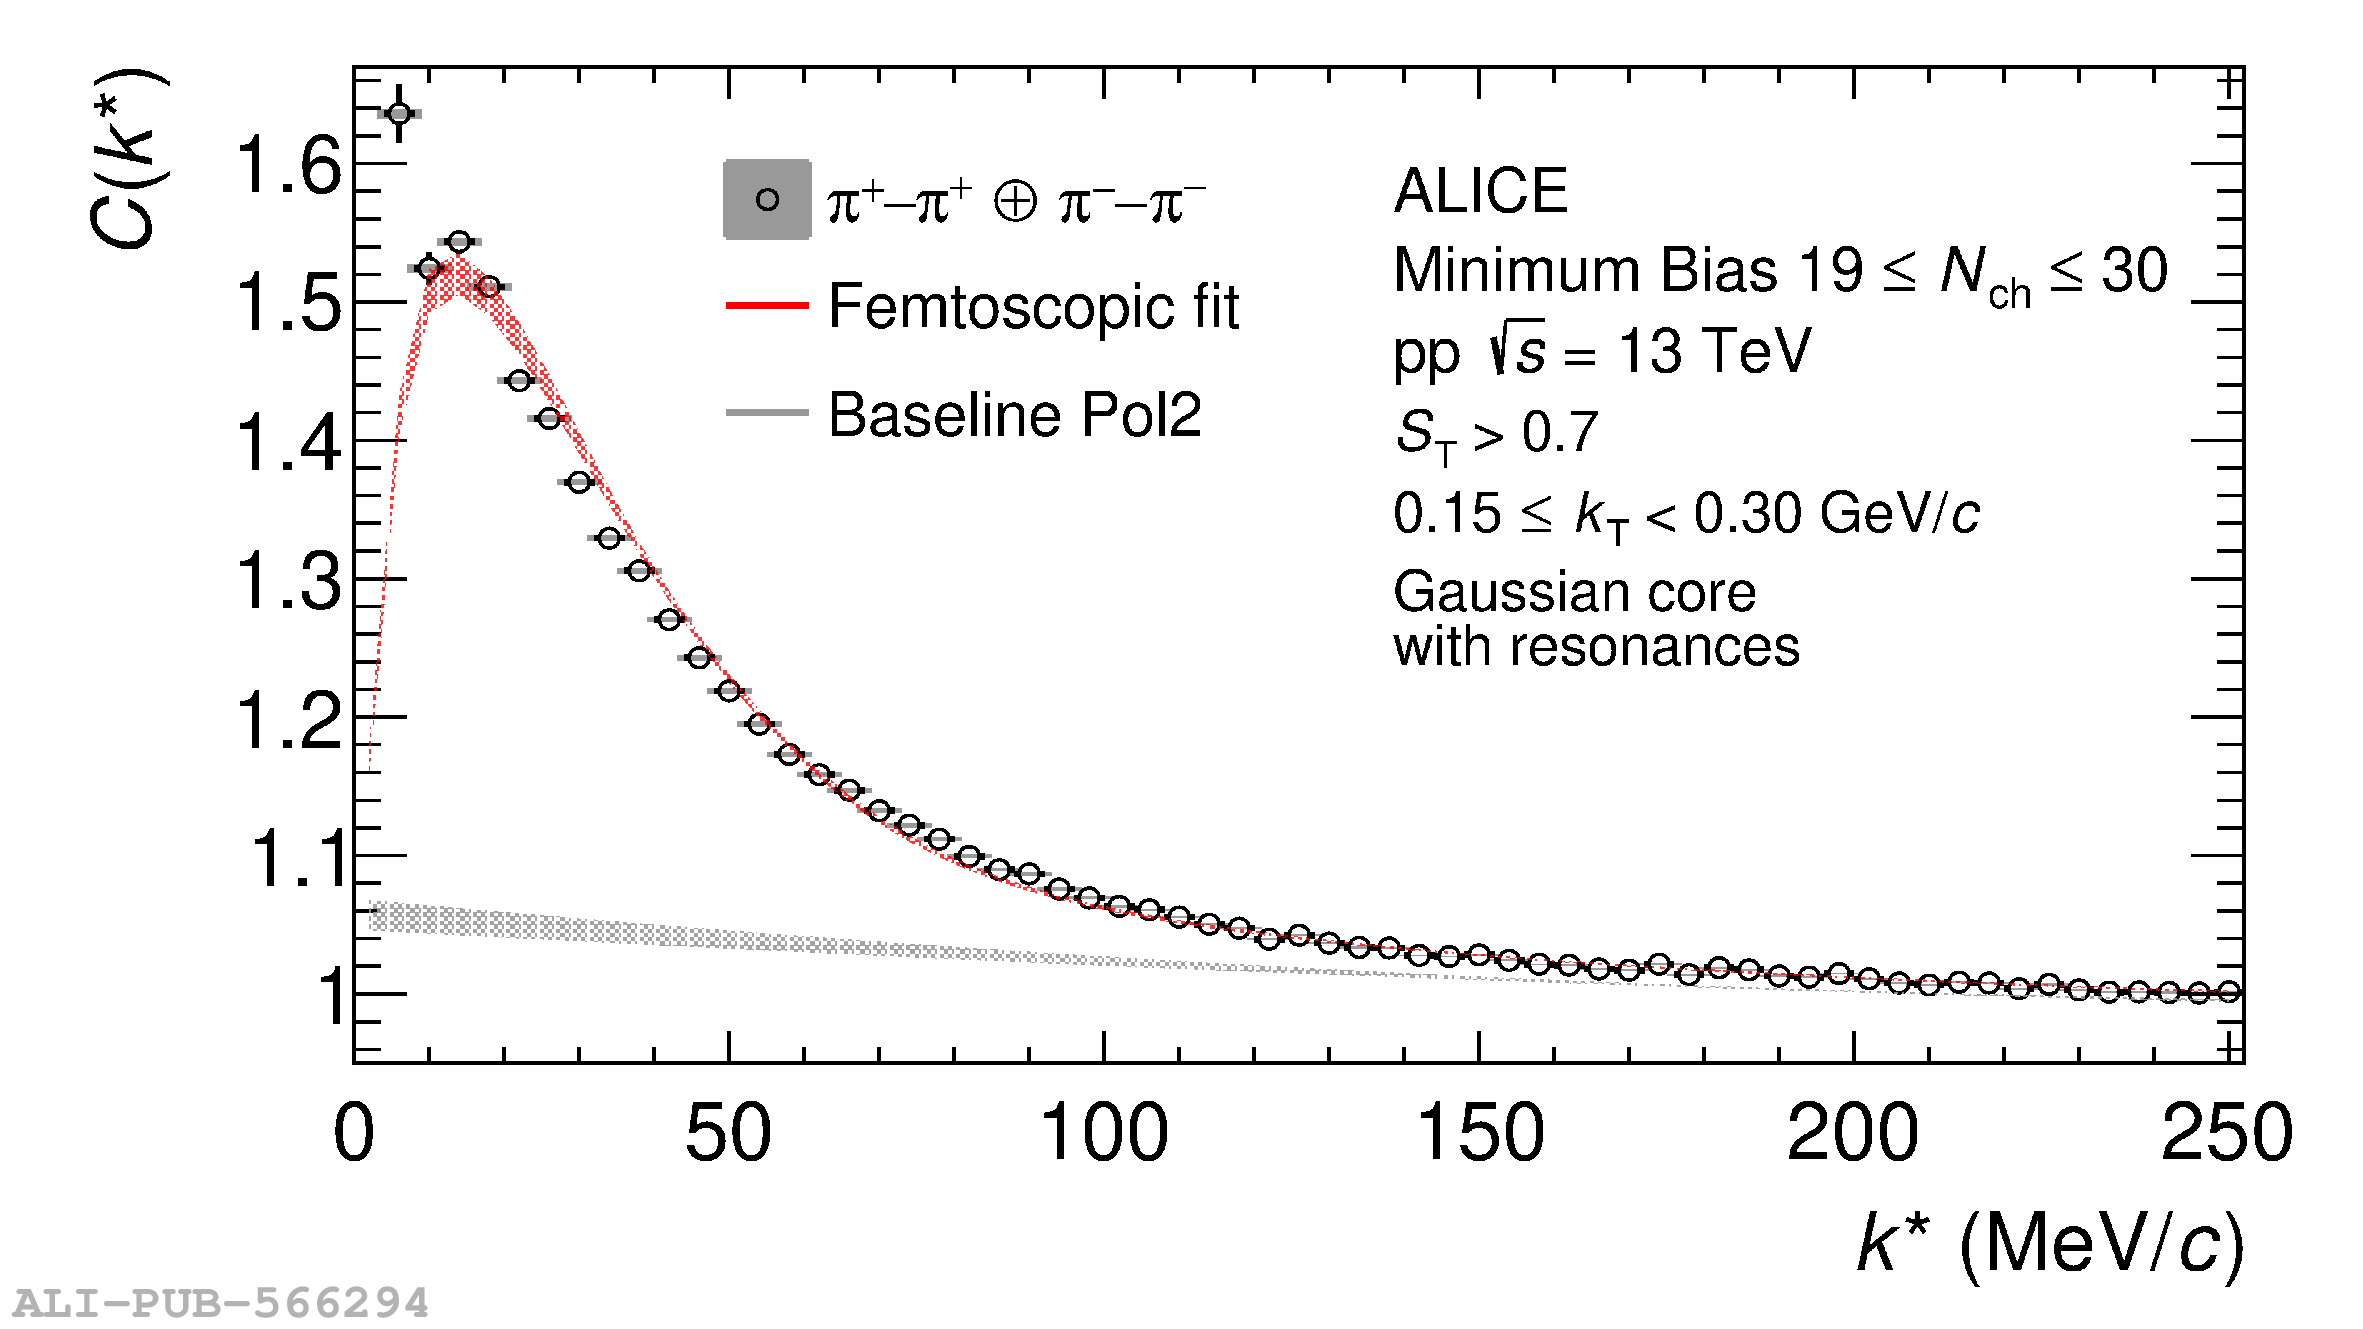 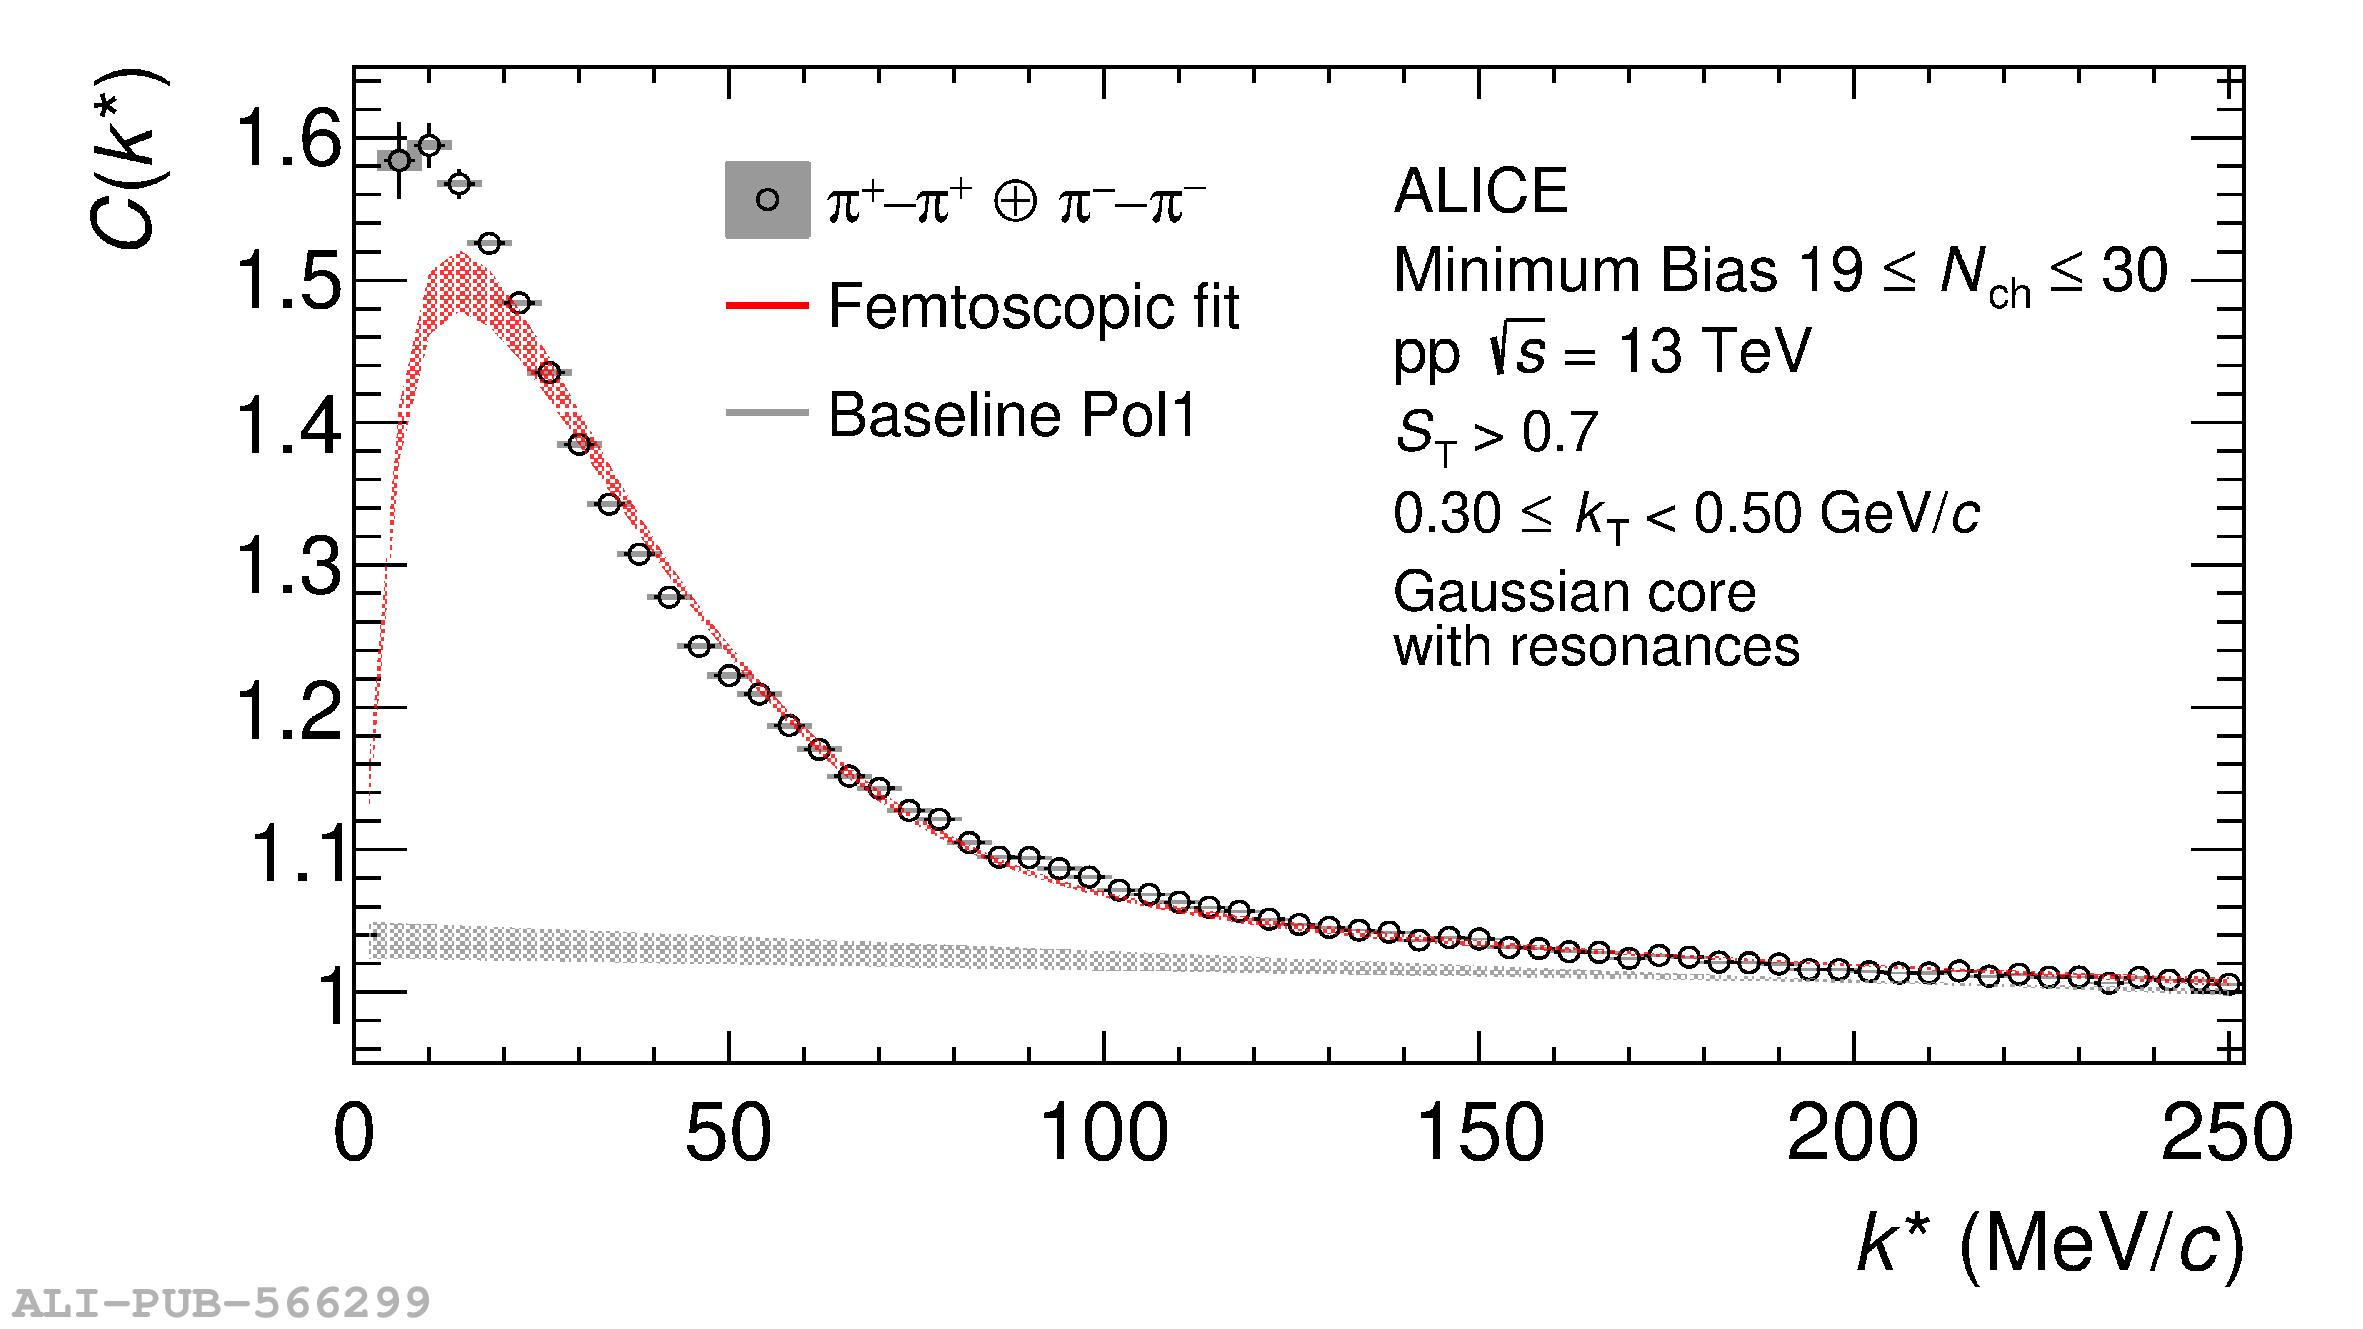 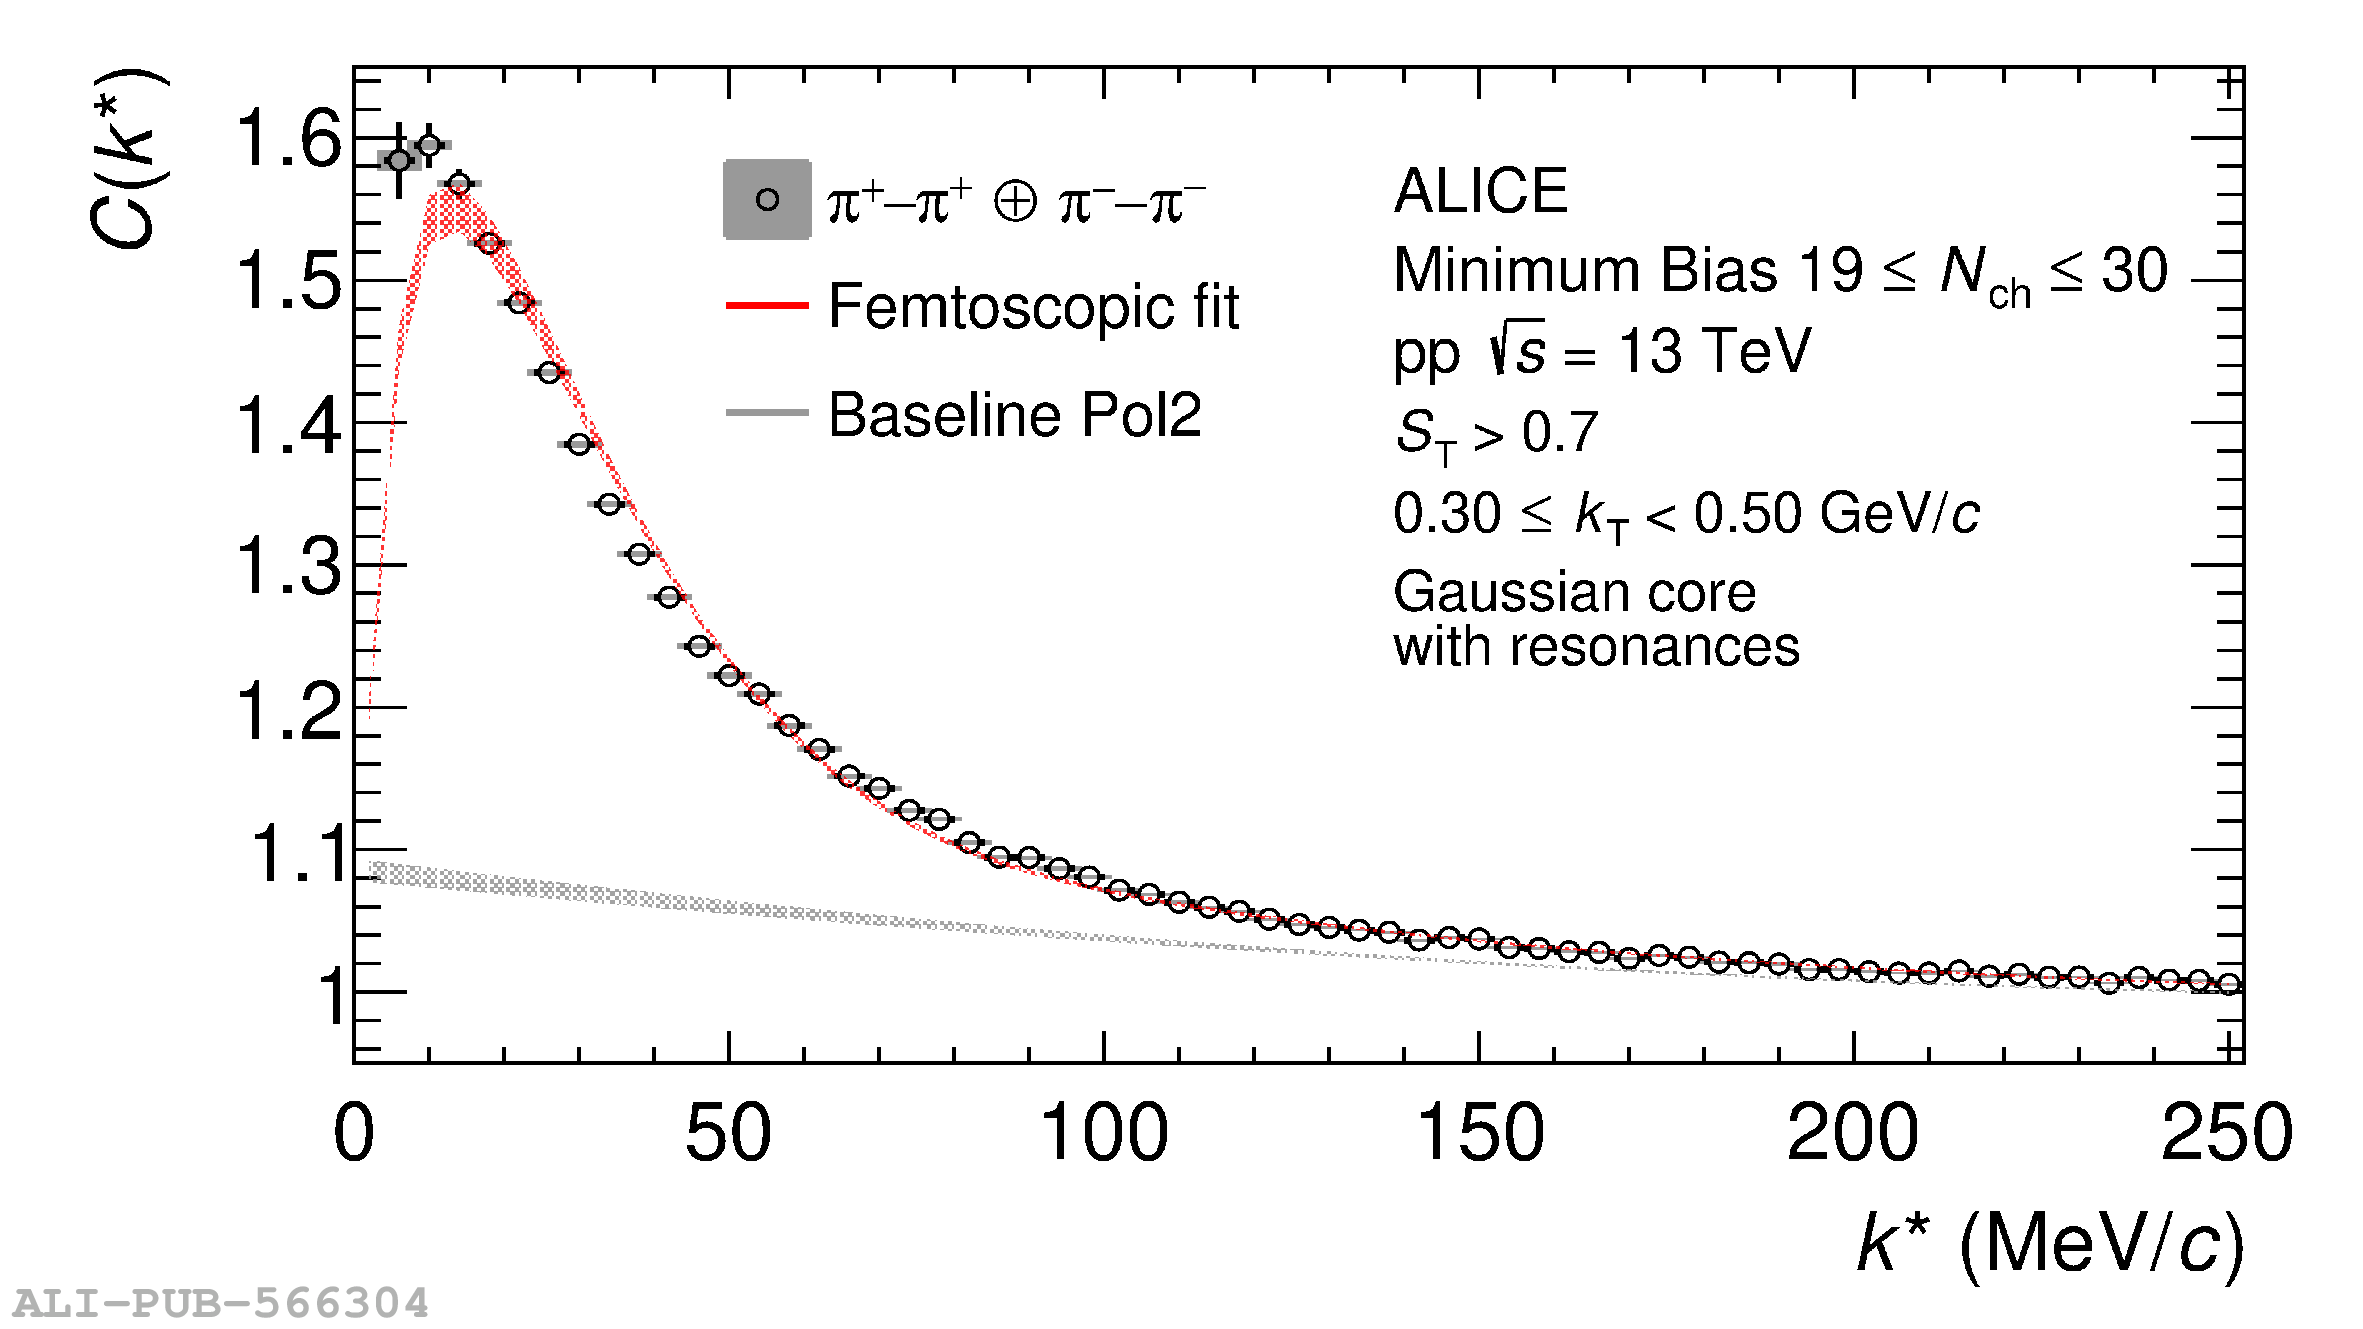 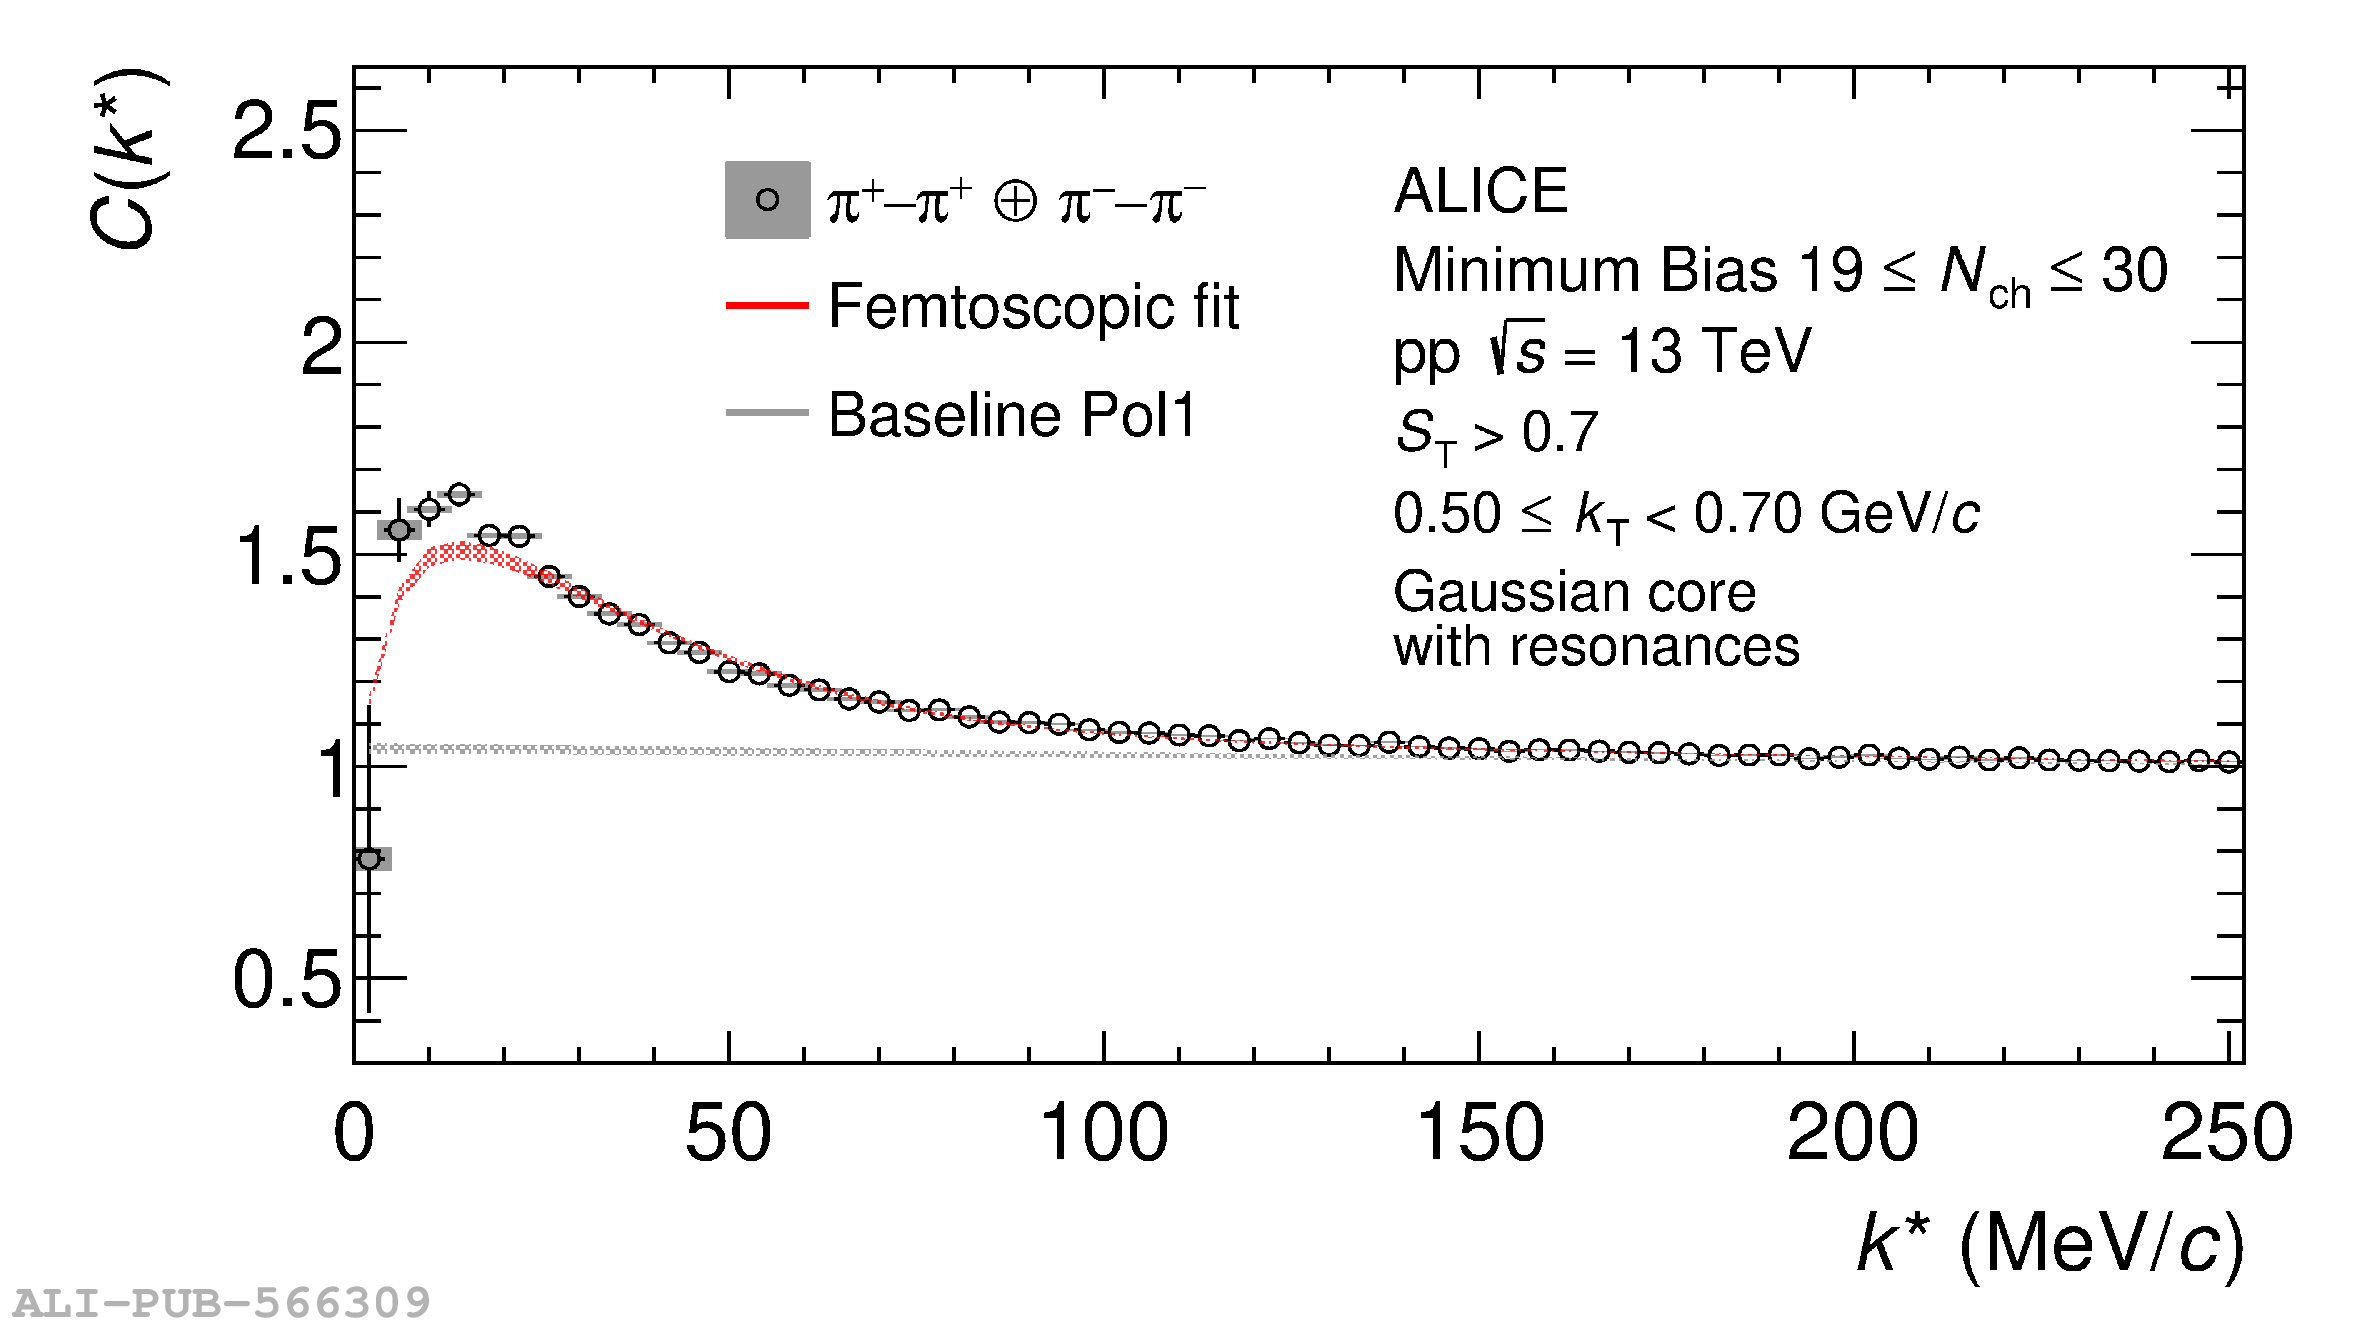  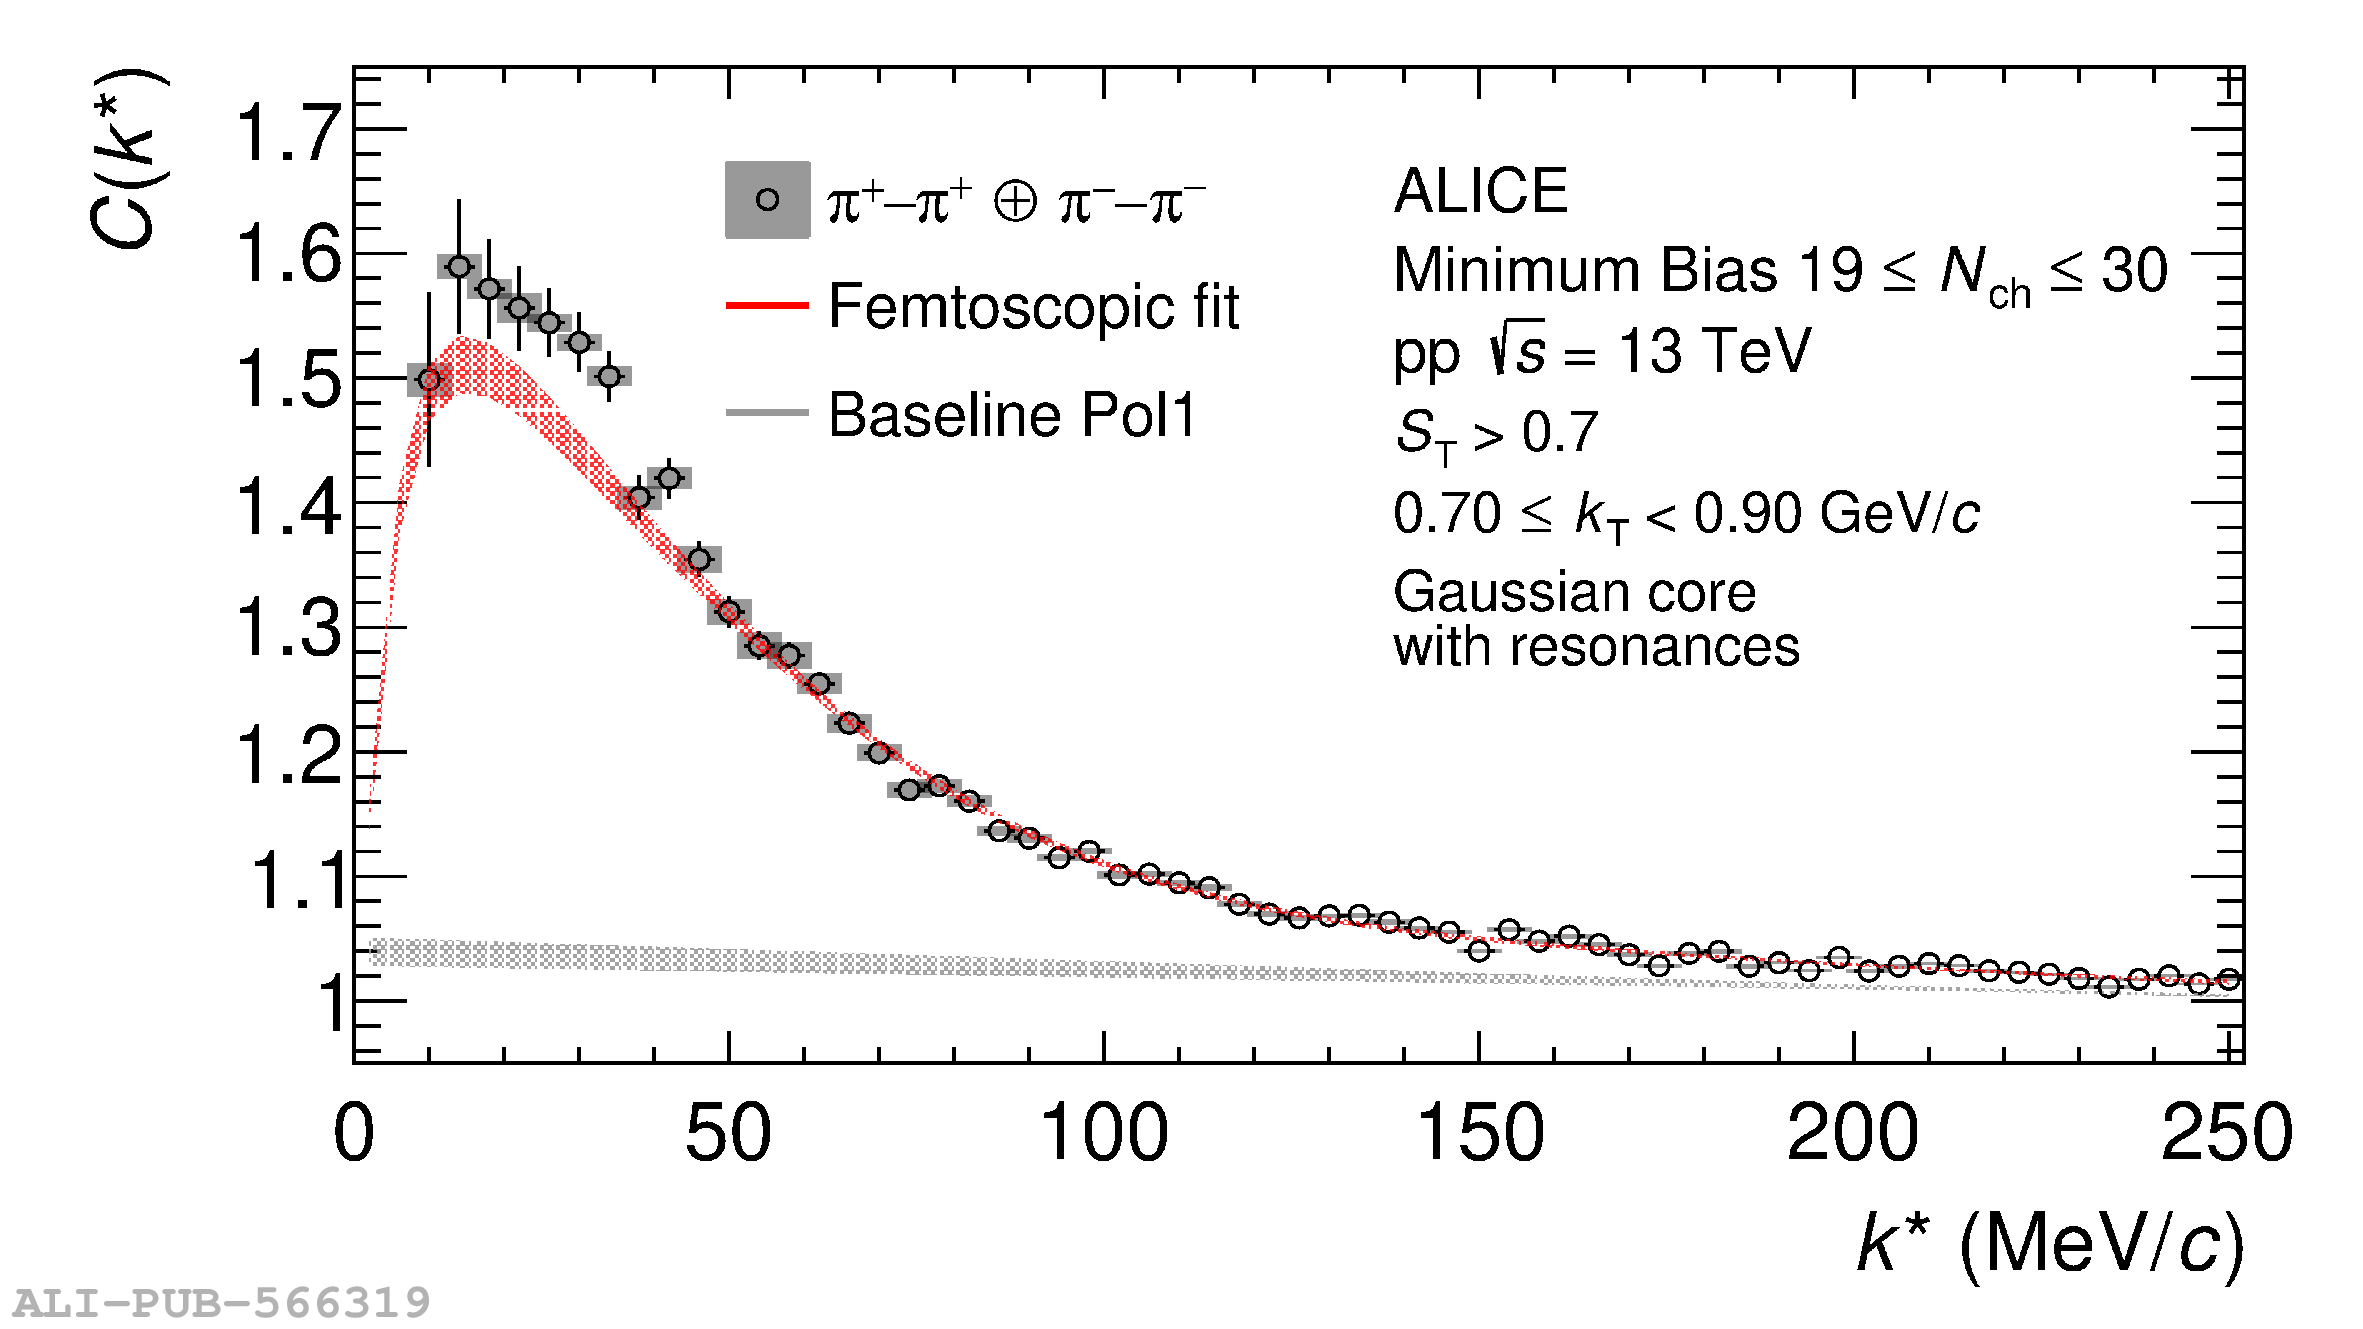 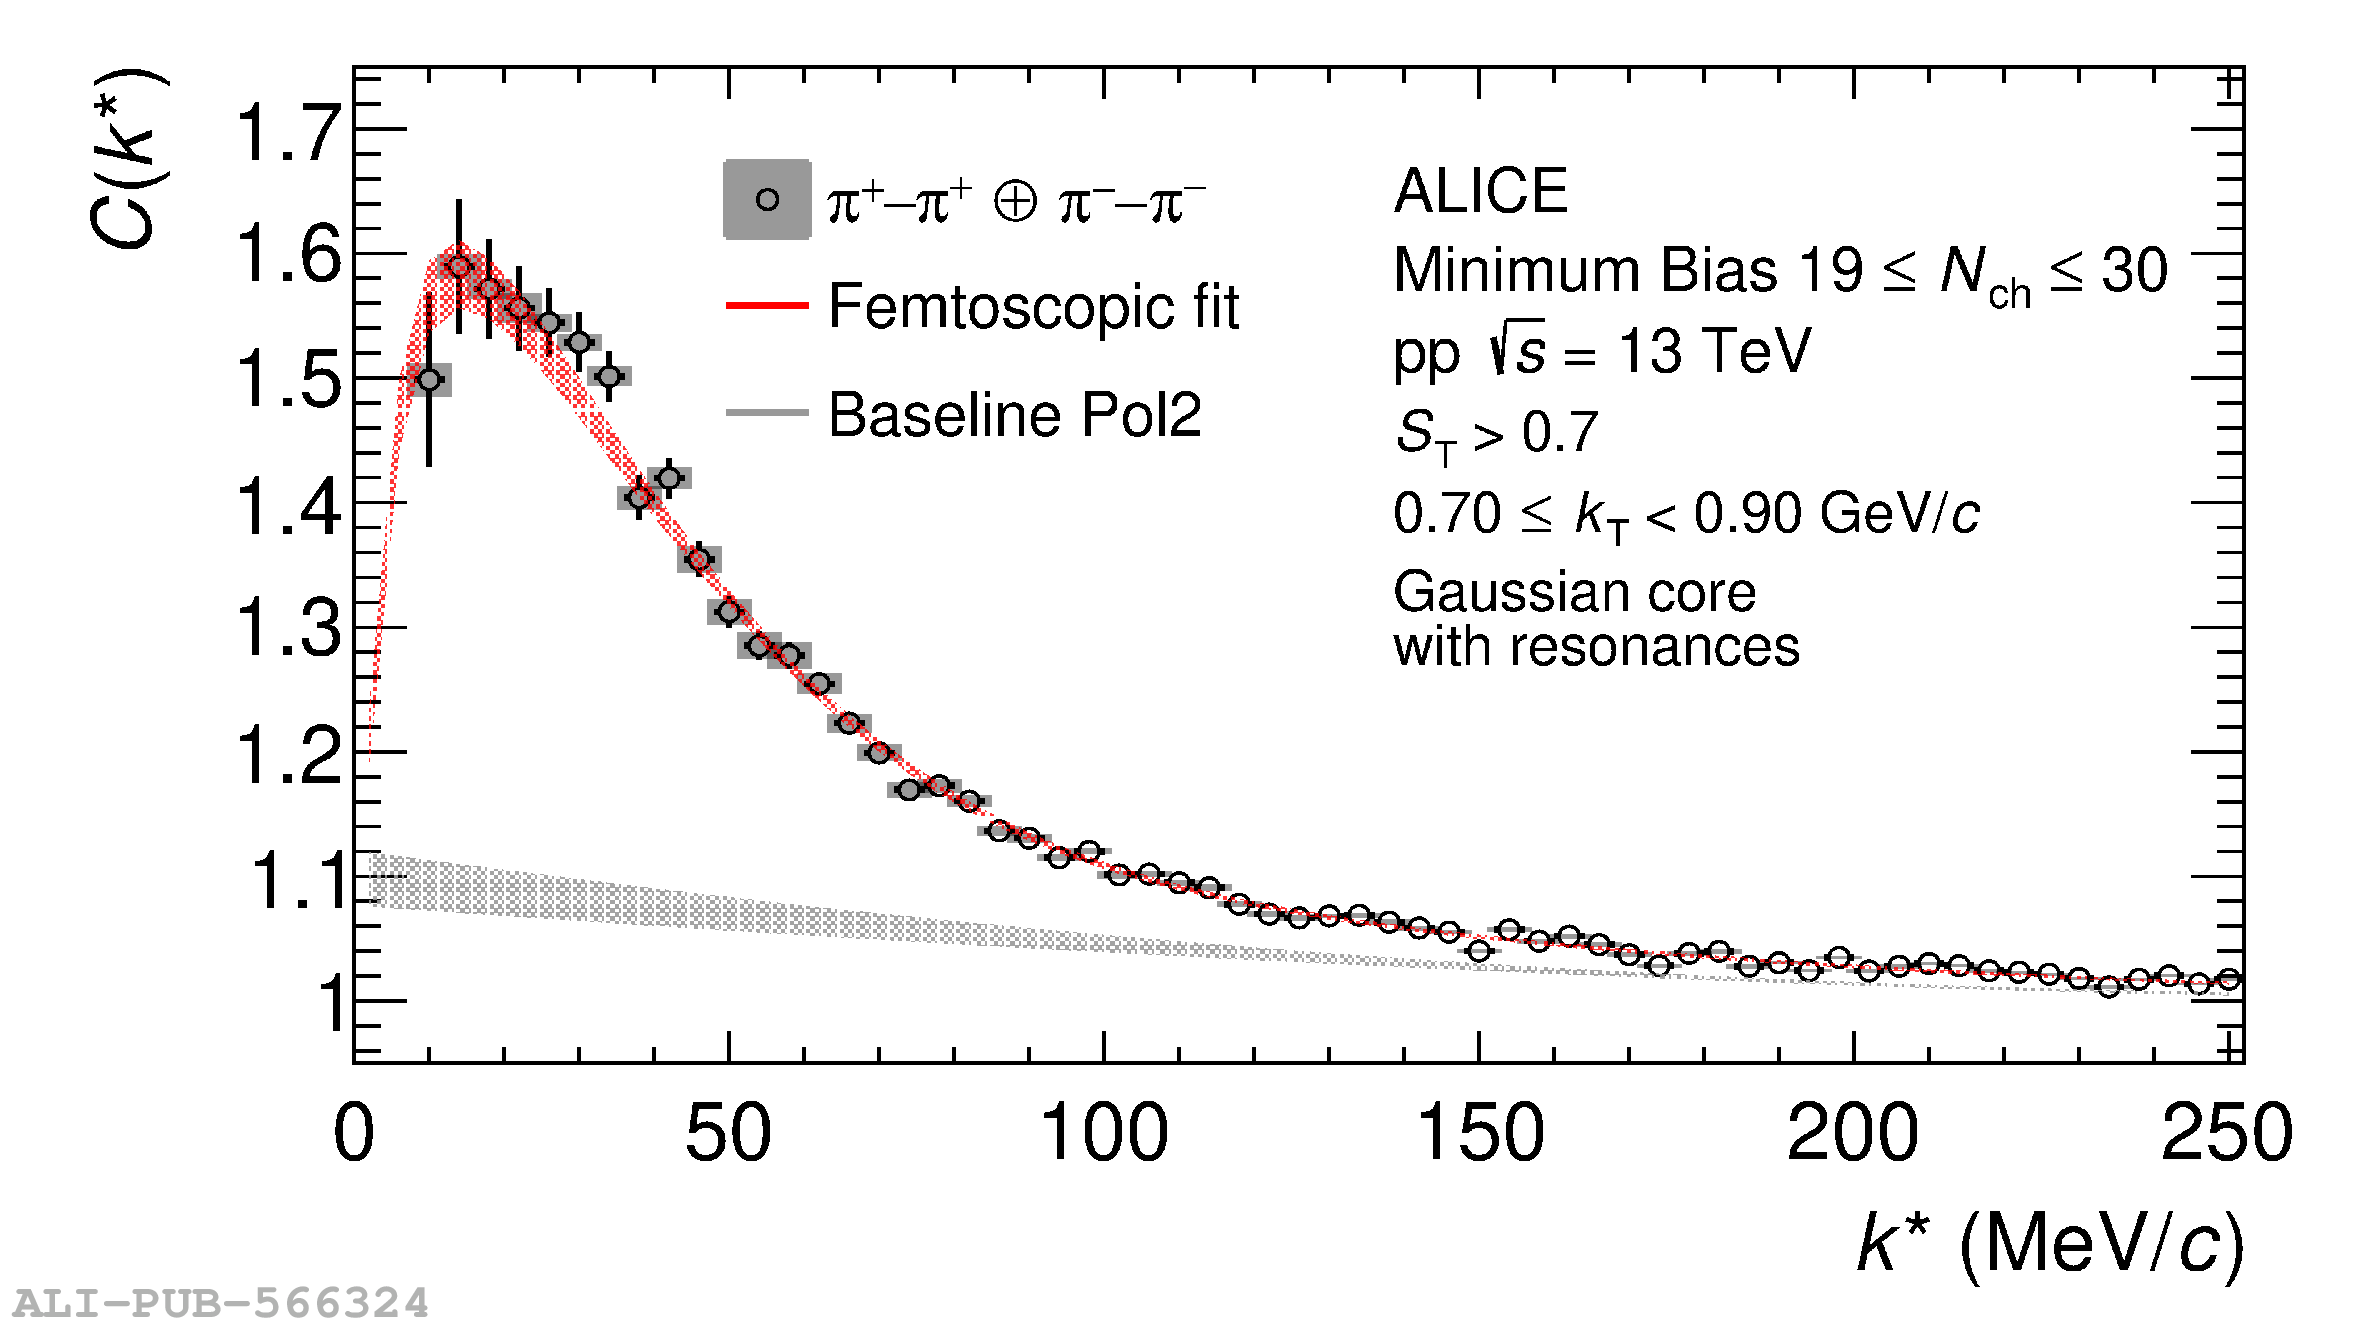 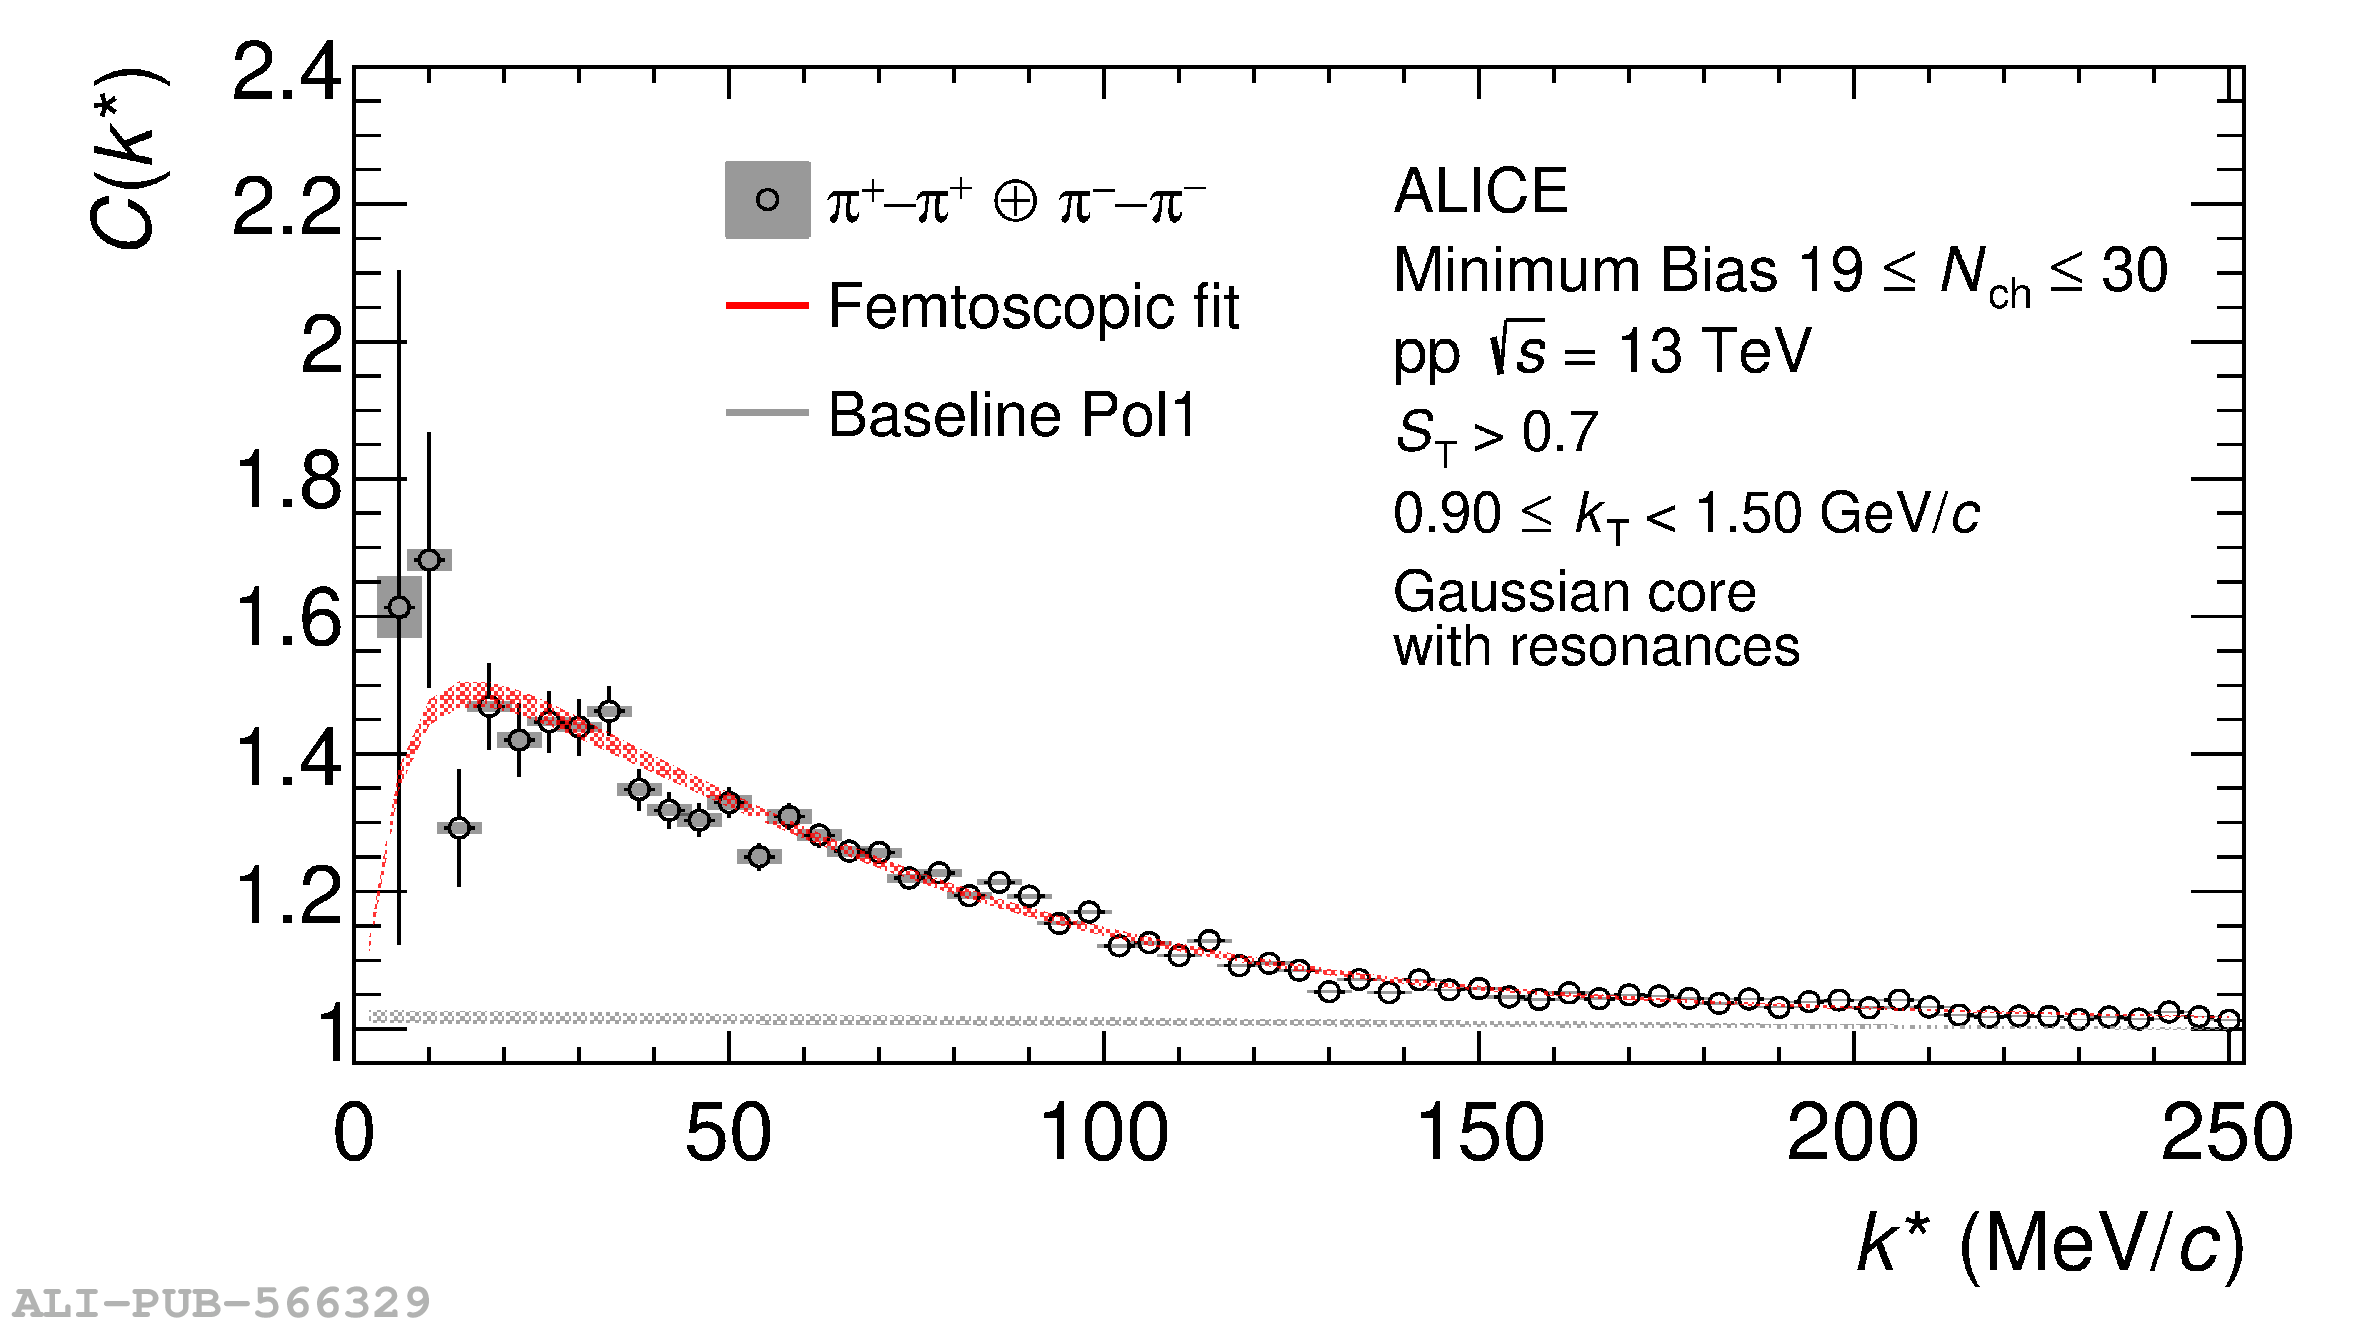 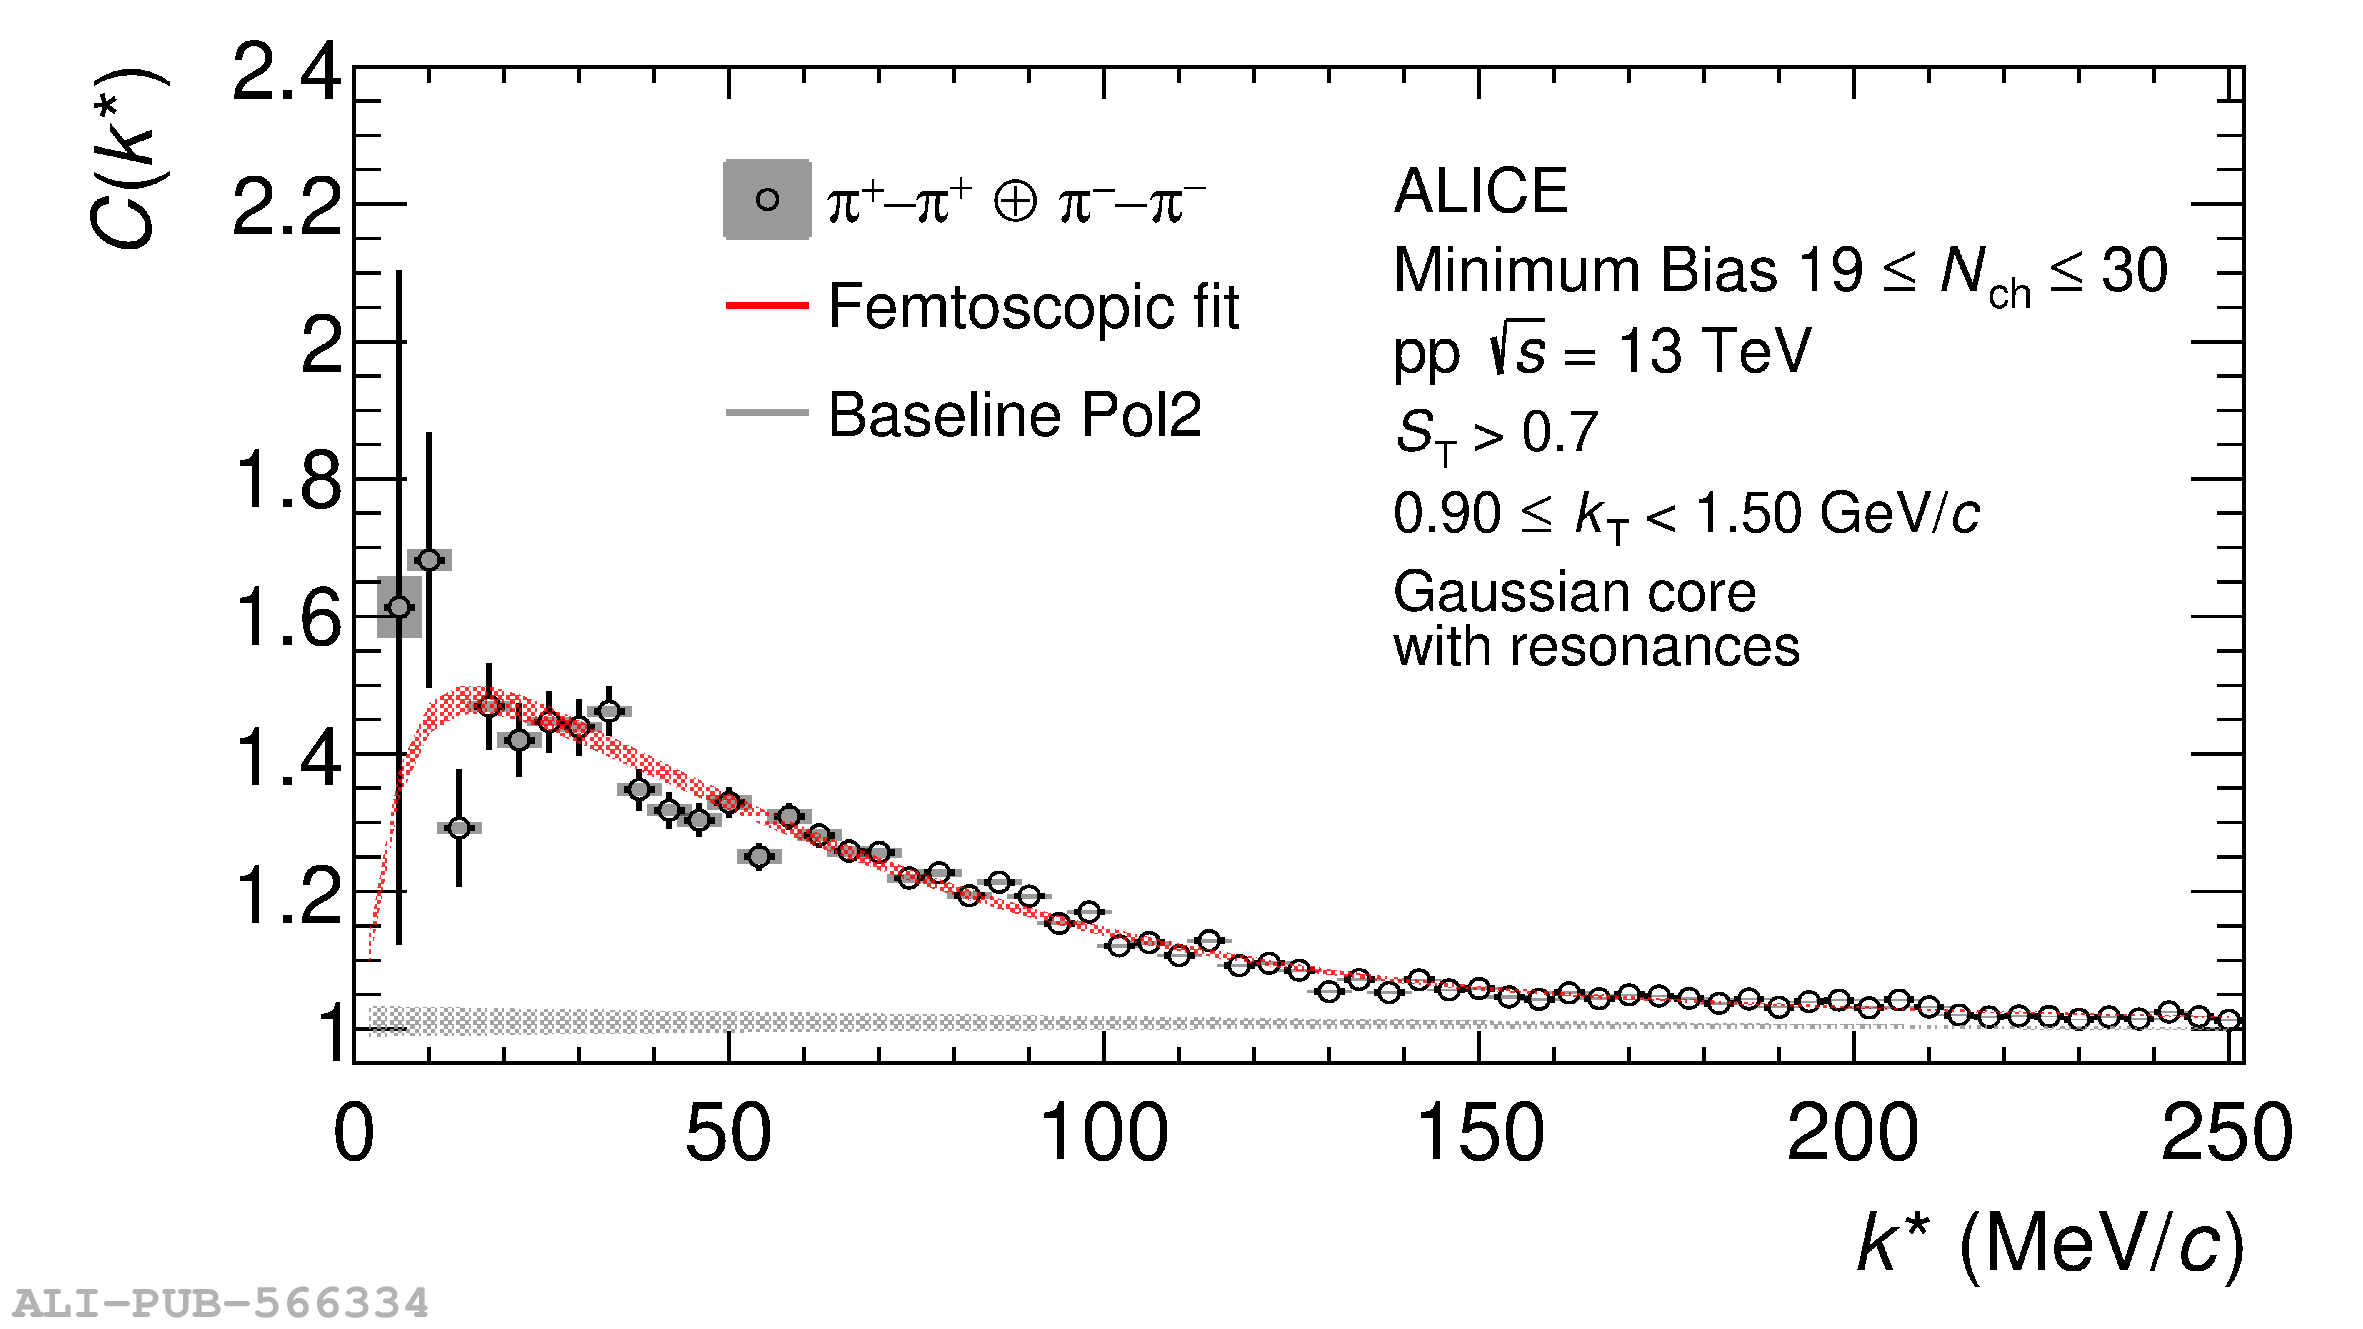 |
Figure A.3
Correlation functions of $\pi-\pi$ pairs in bins of $k_{\rm T}$ for $N_{\mathrm{ch}}\geq 31$, the fits are performed using CATS employing the RSM. The left (right) panels show the results assuming a polynomial of first (second) degree as background. The uncertainties of the data points are obtained by varying the selection criteria as described in the text. The uncertainty bands of the fit function are obtained by employing a bootstrap procedure. | 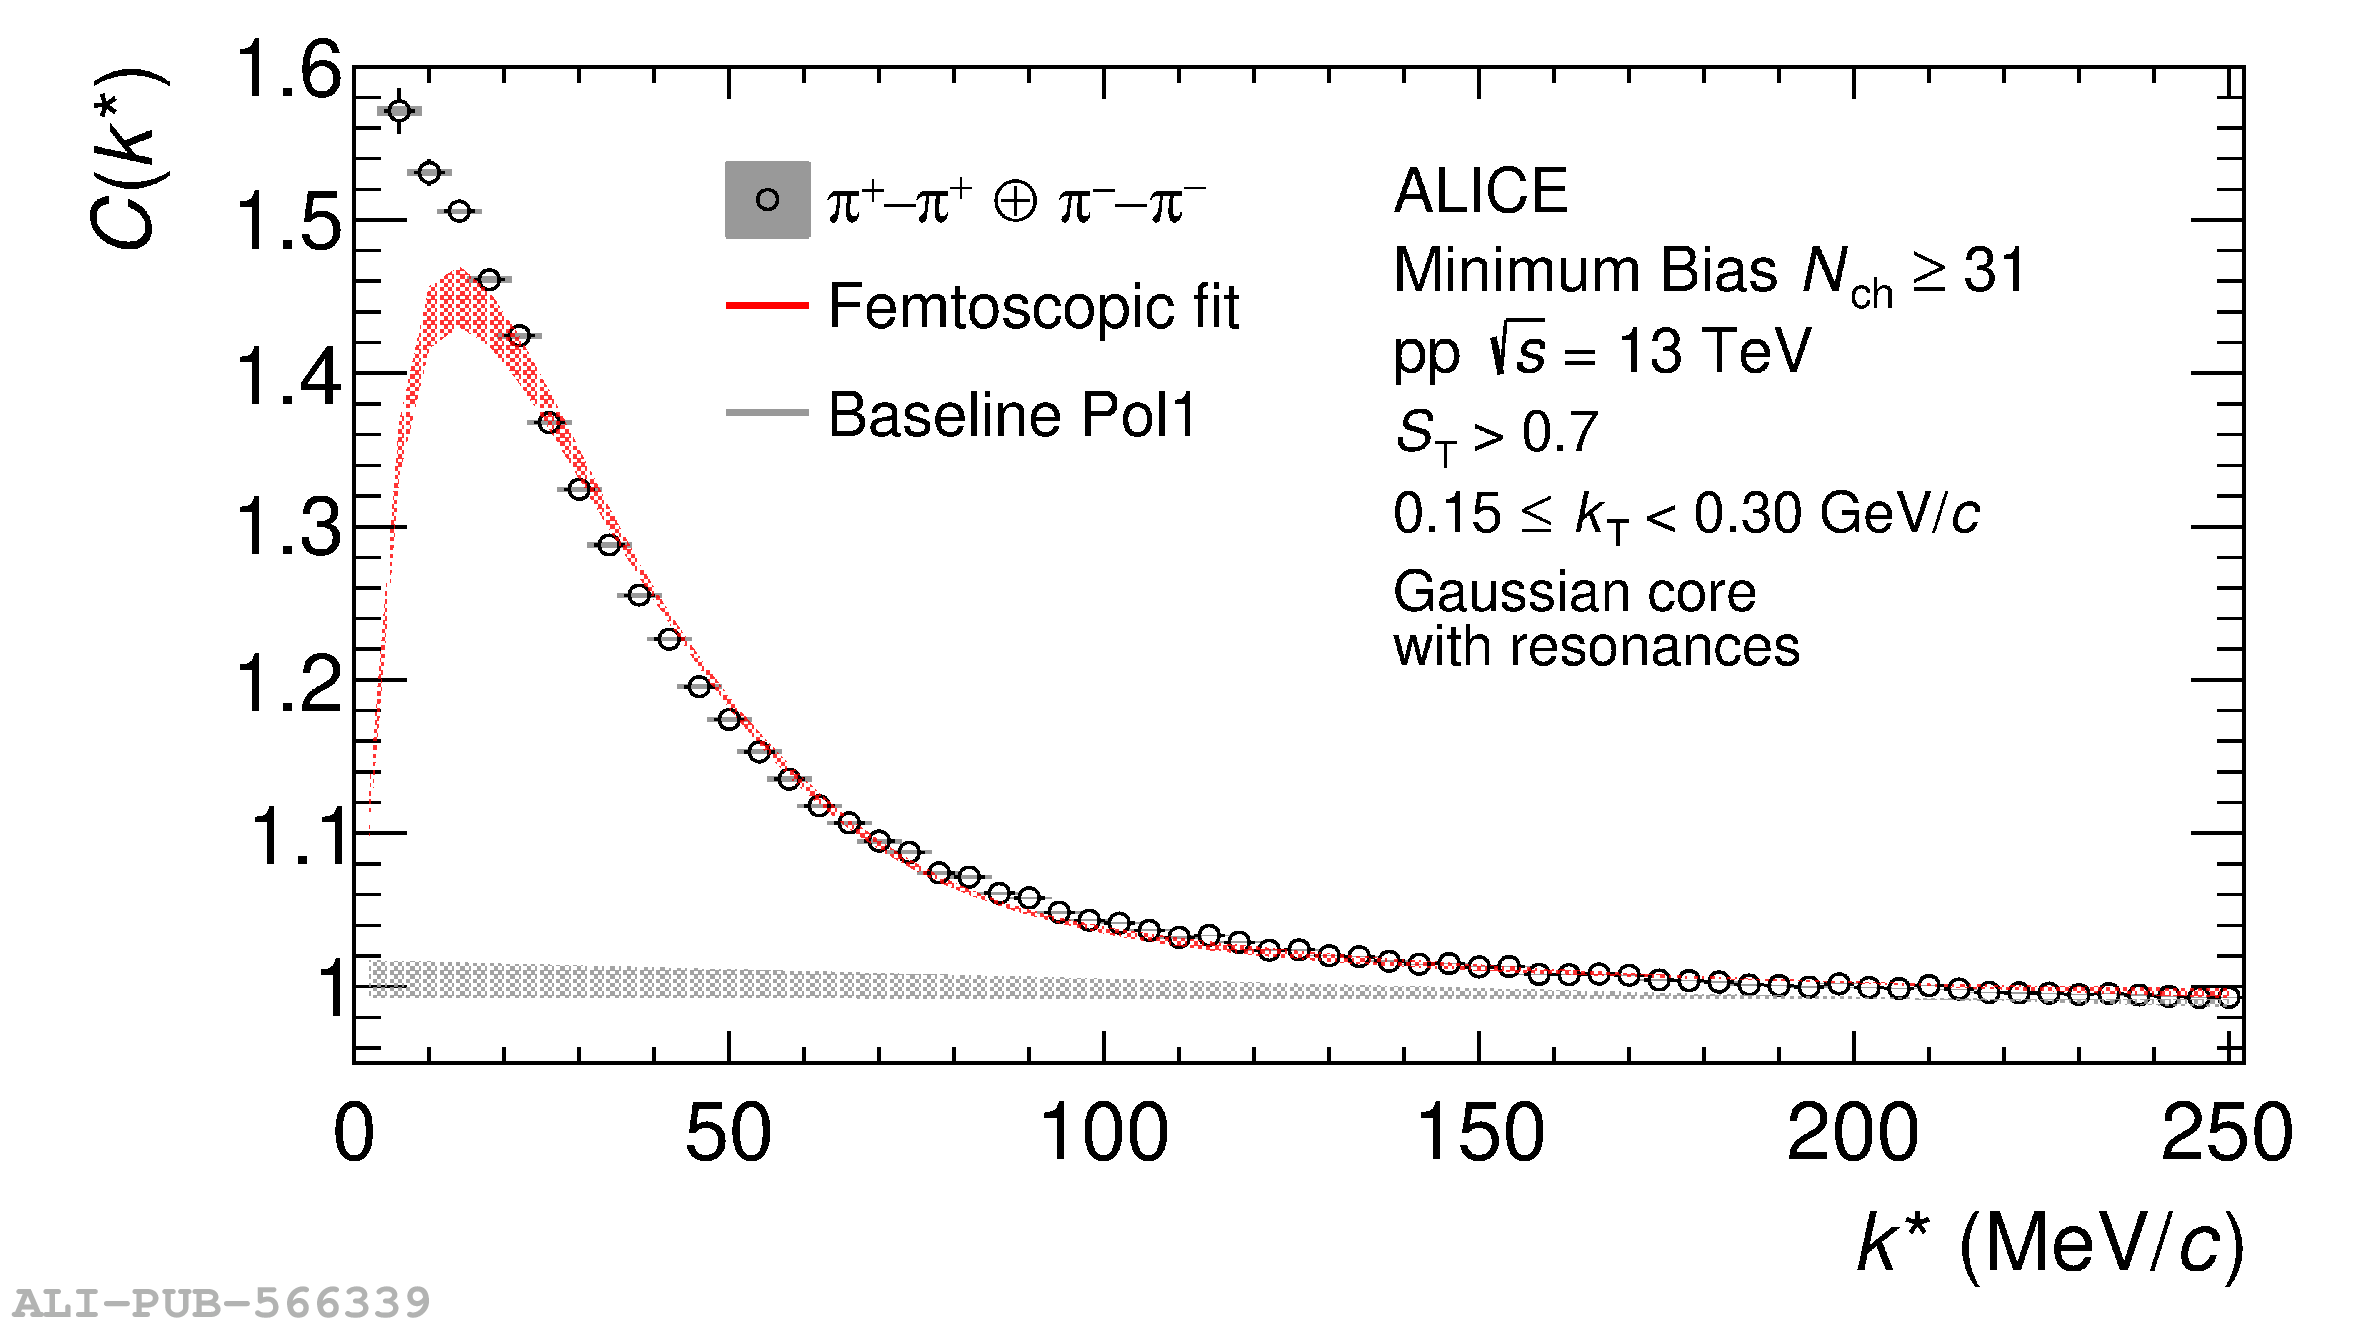 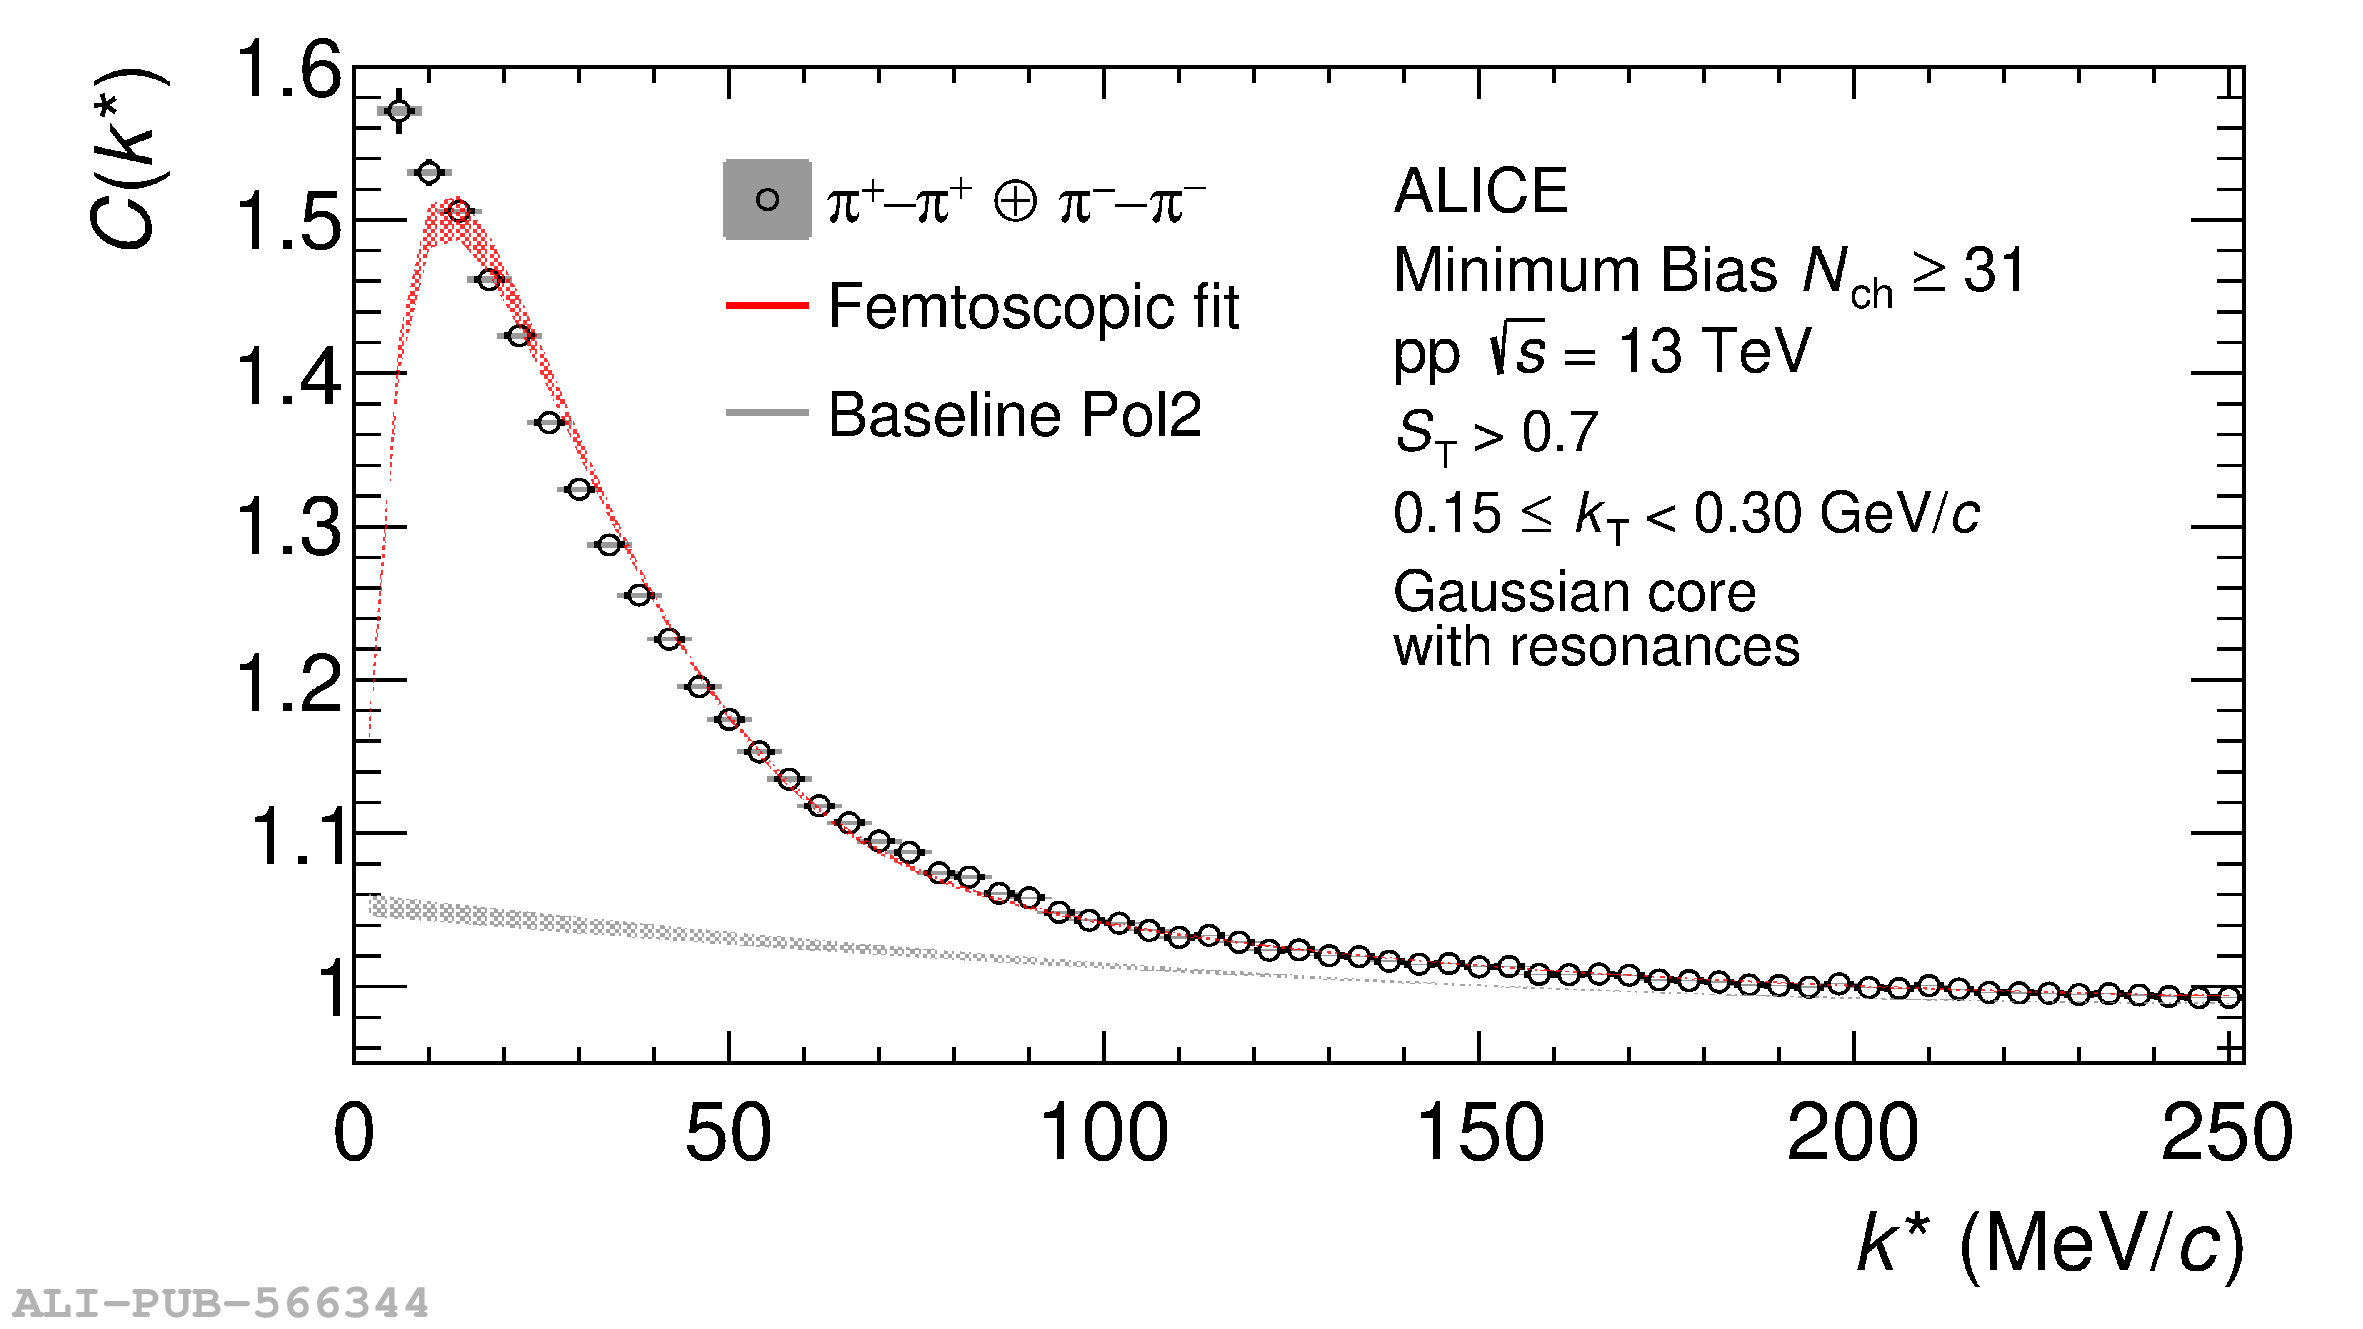 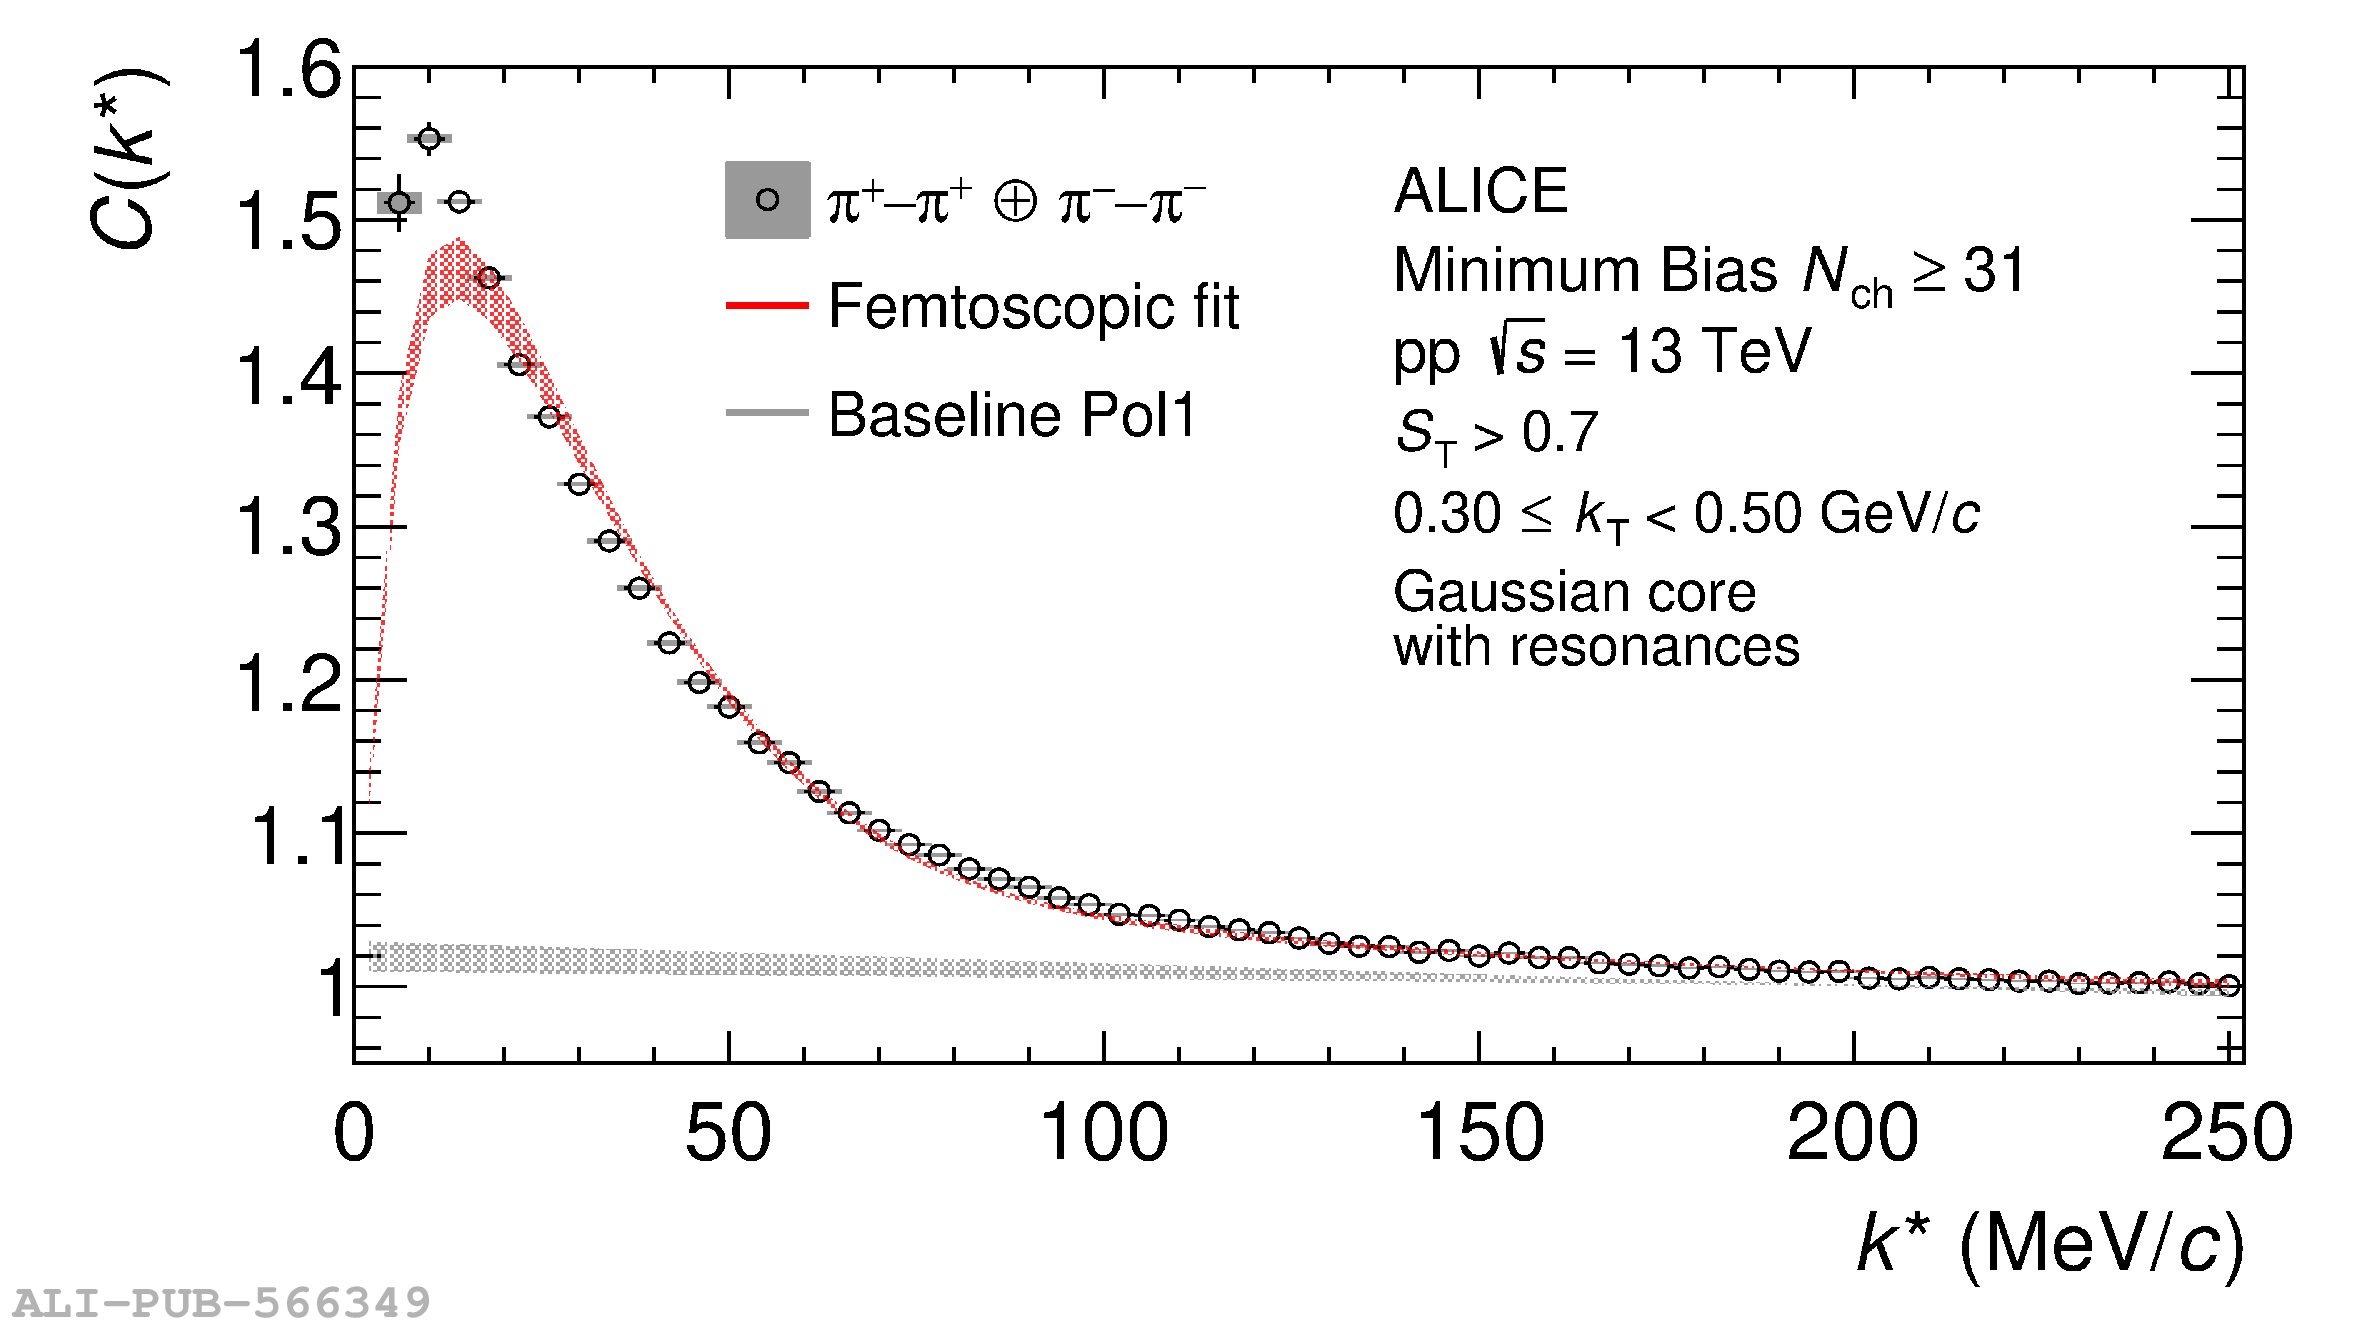 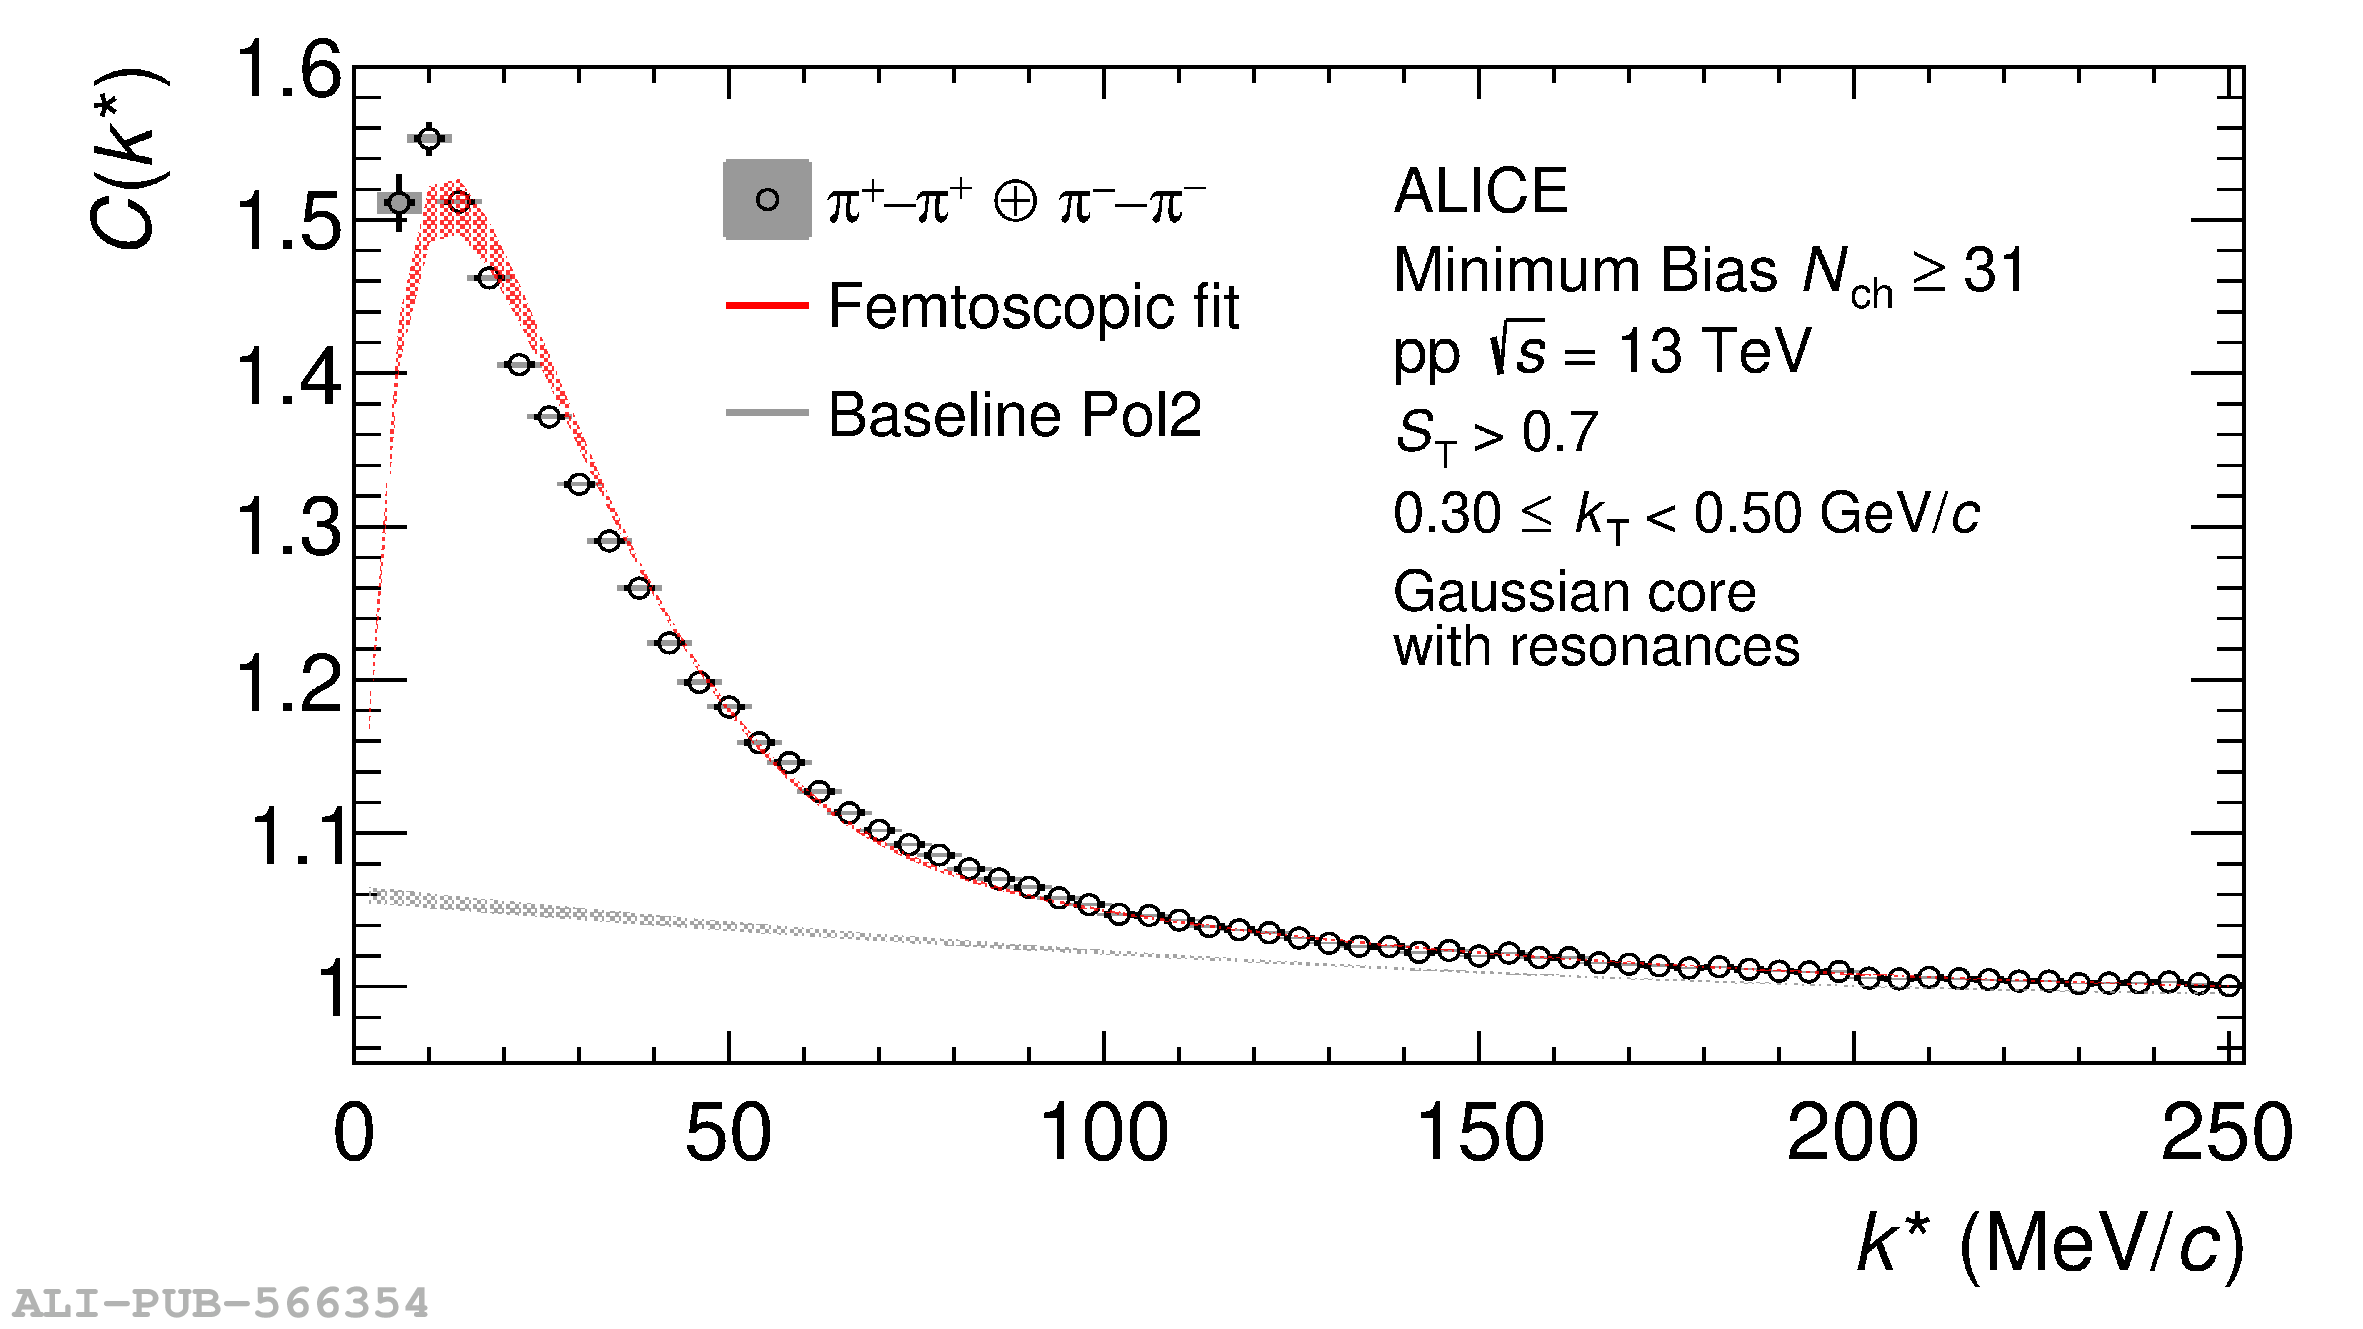 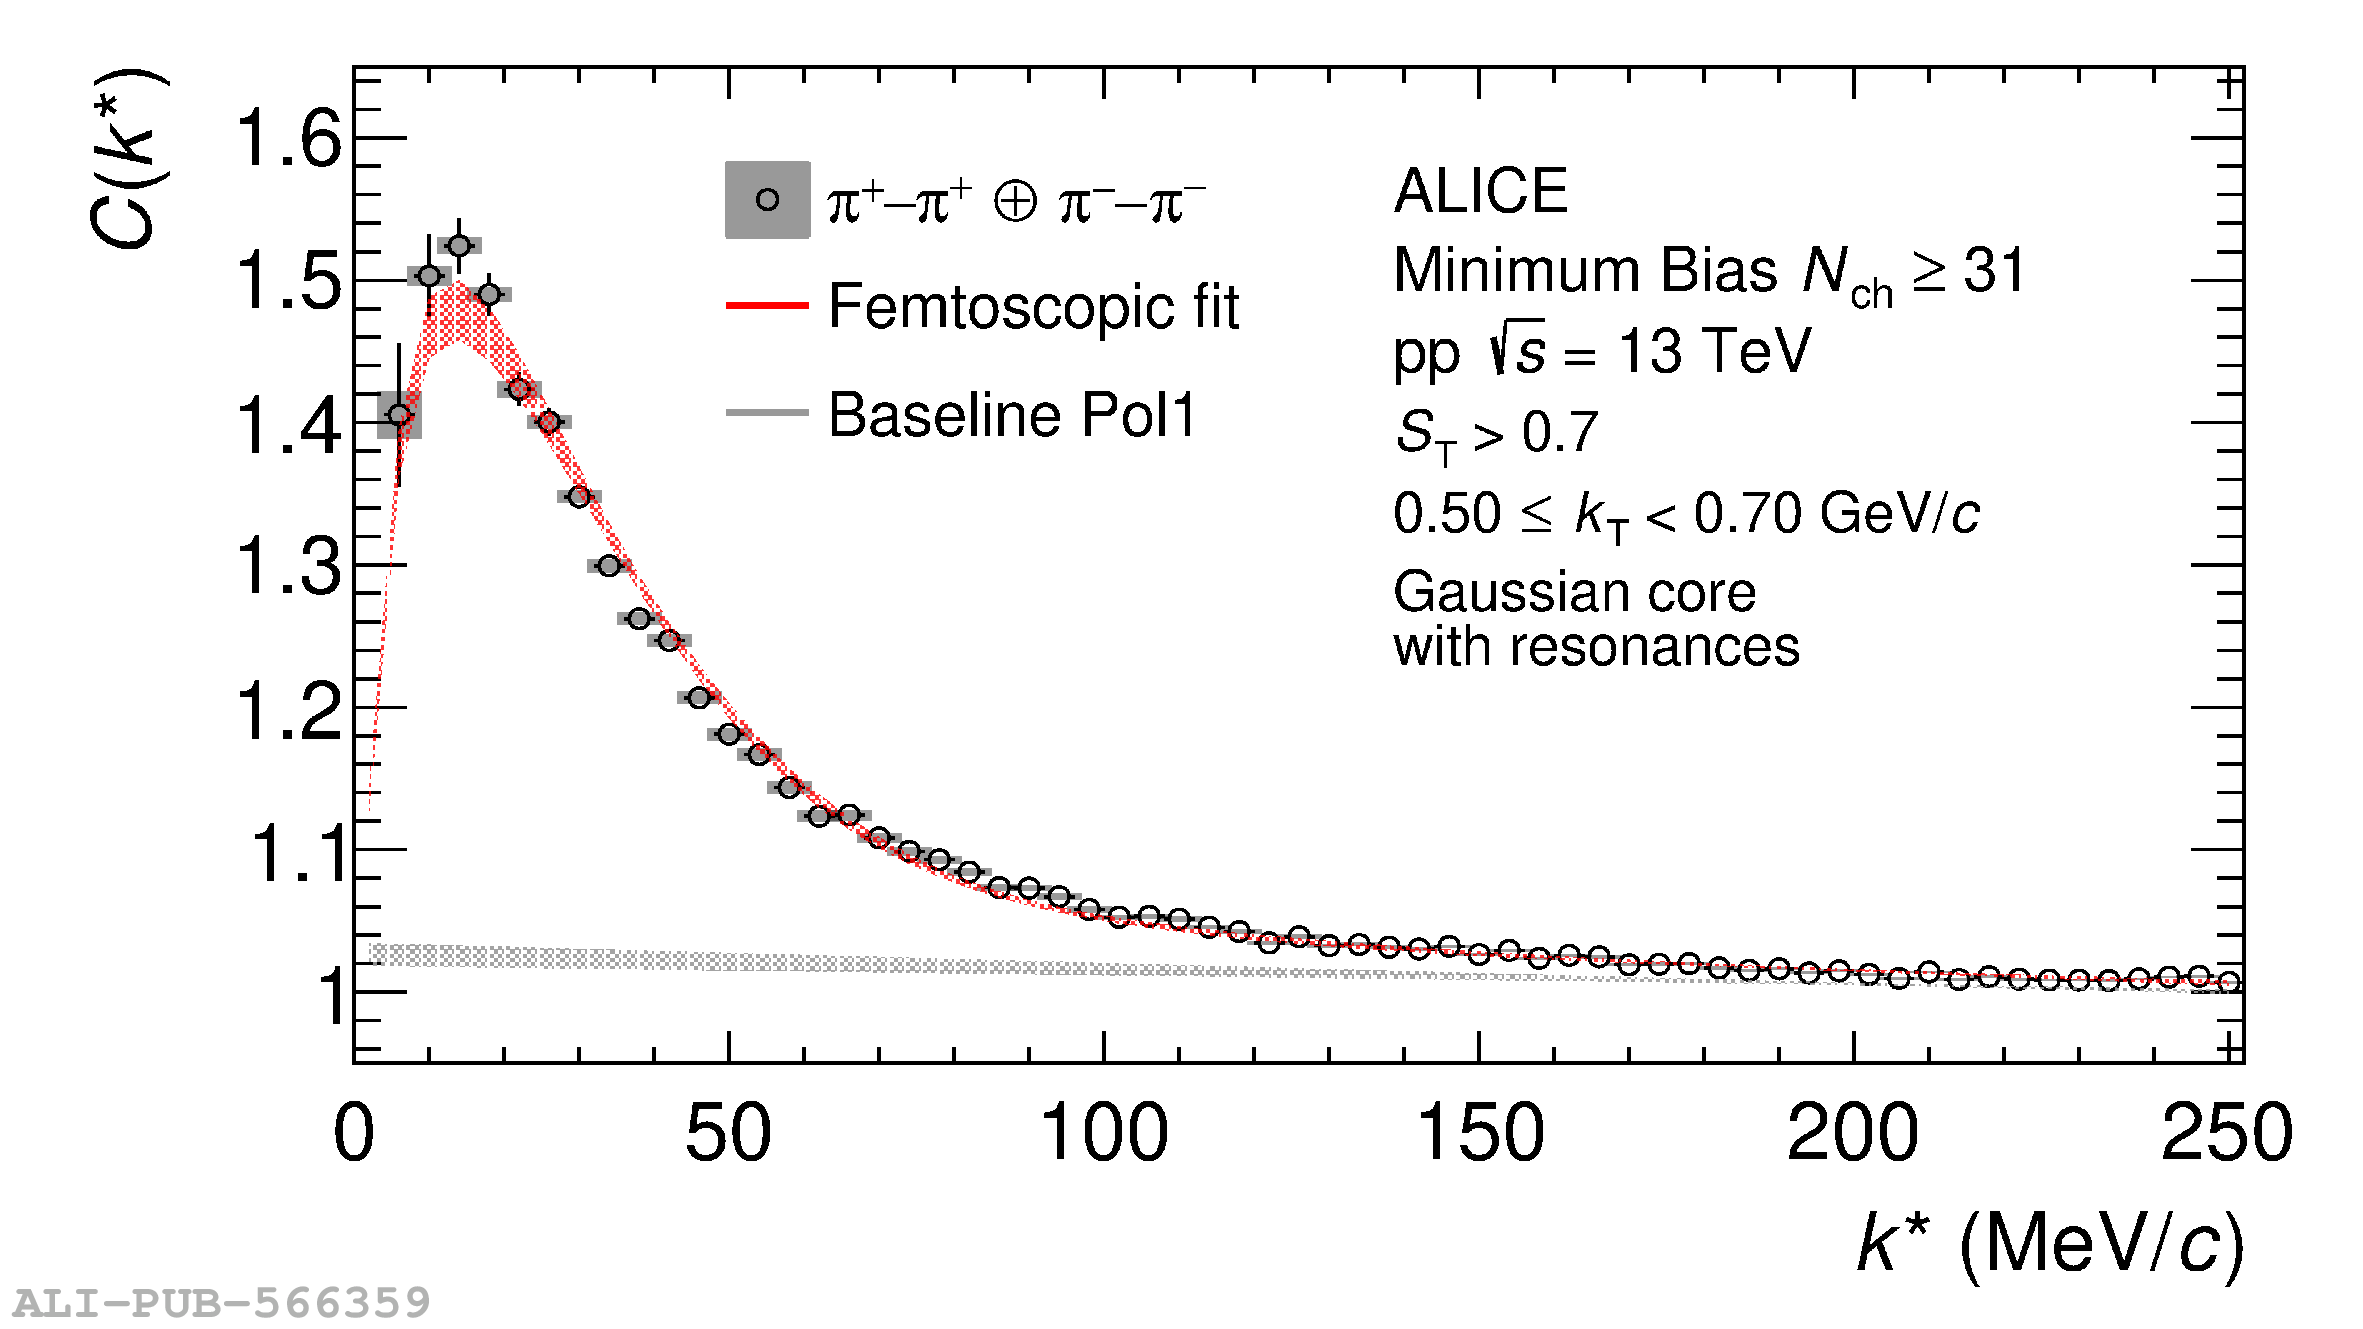  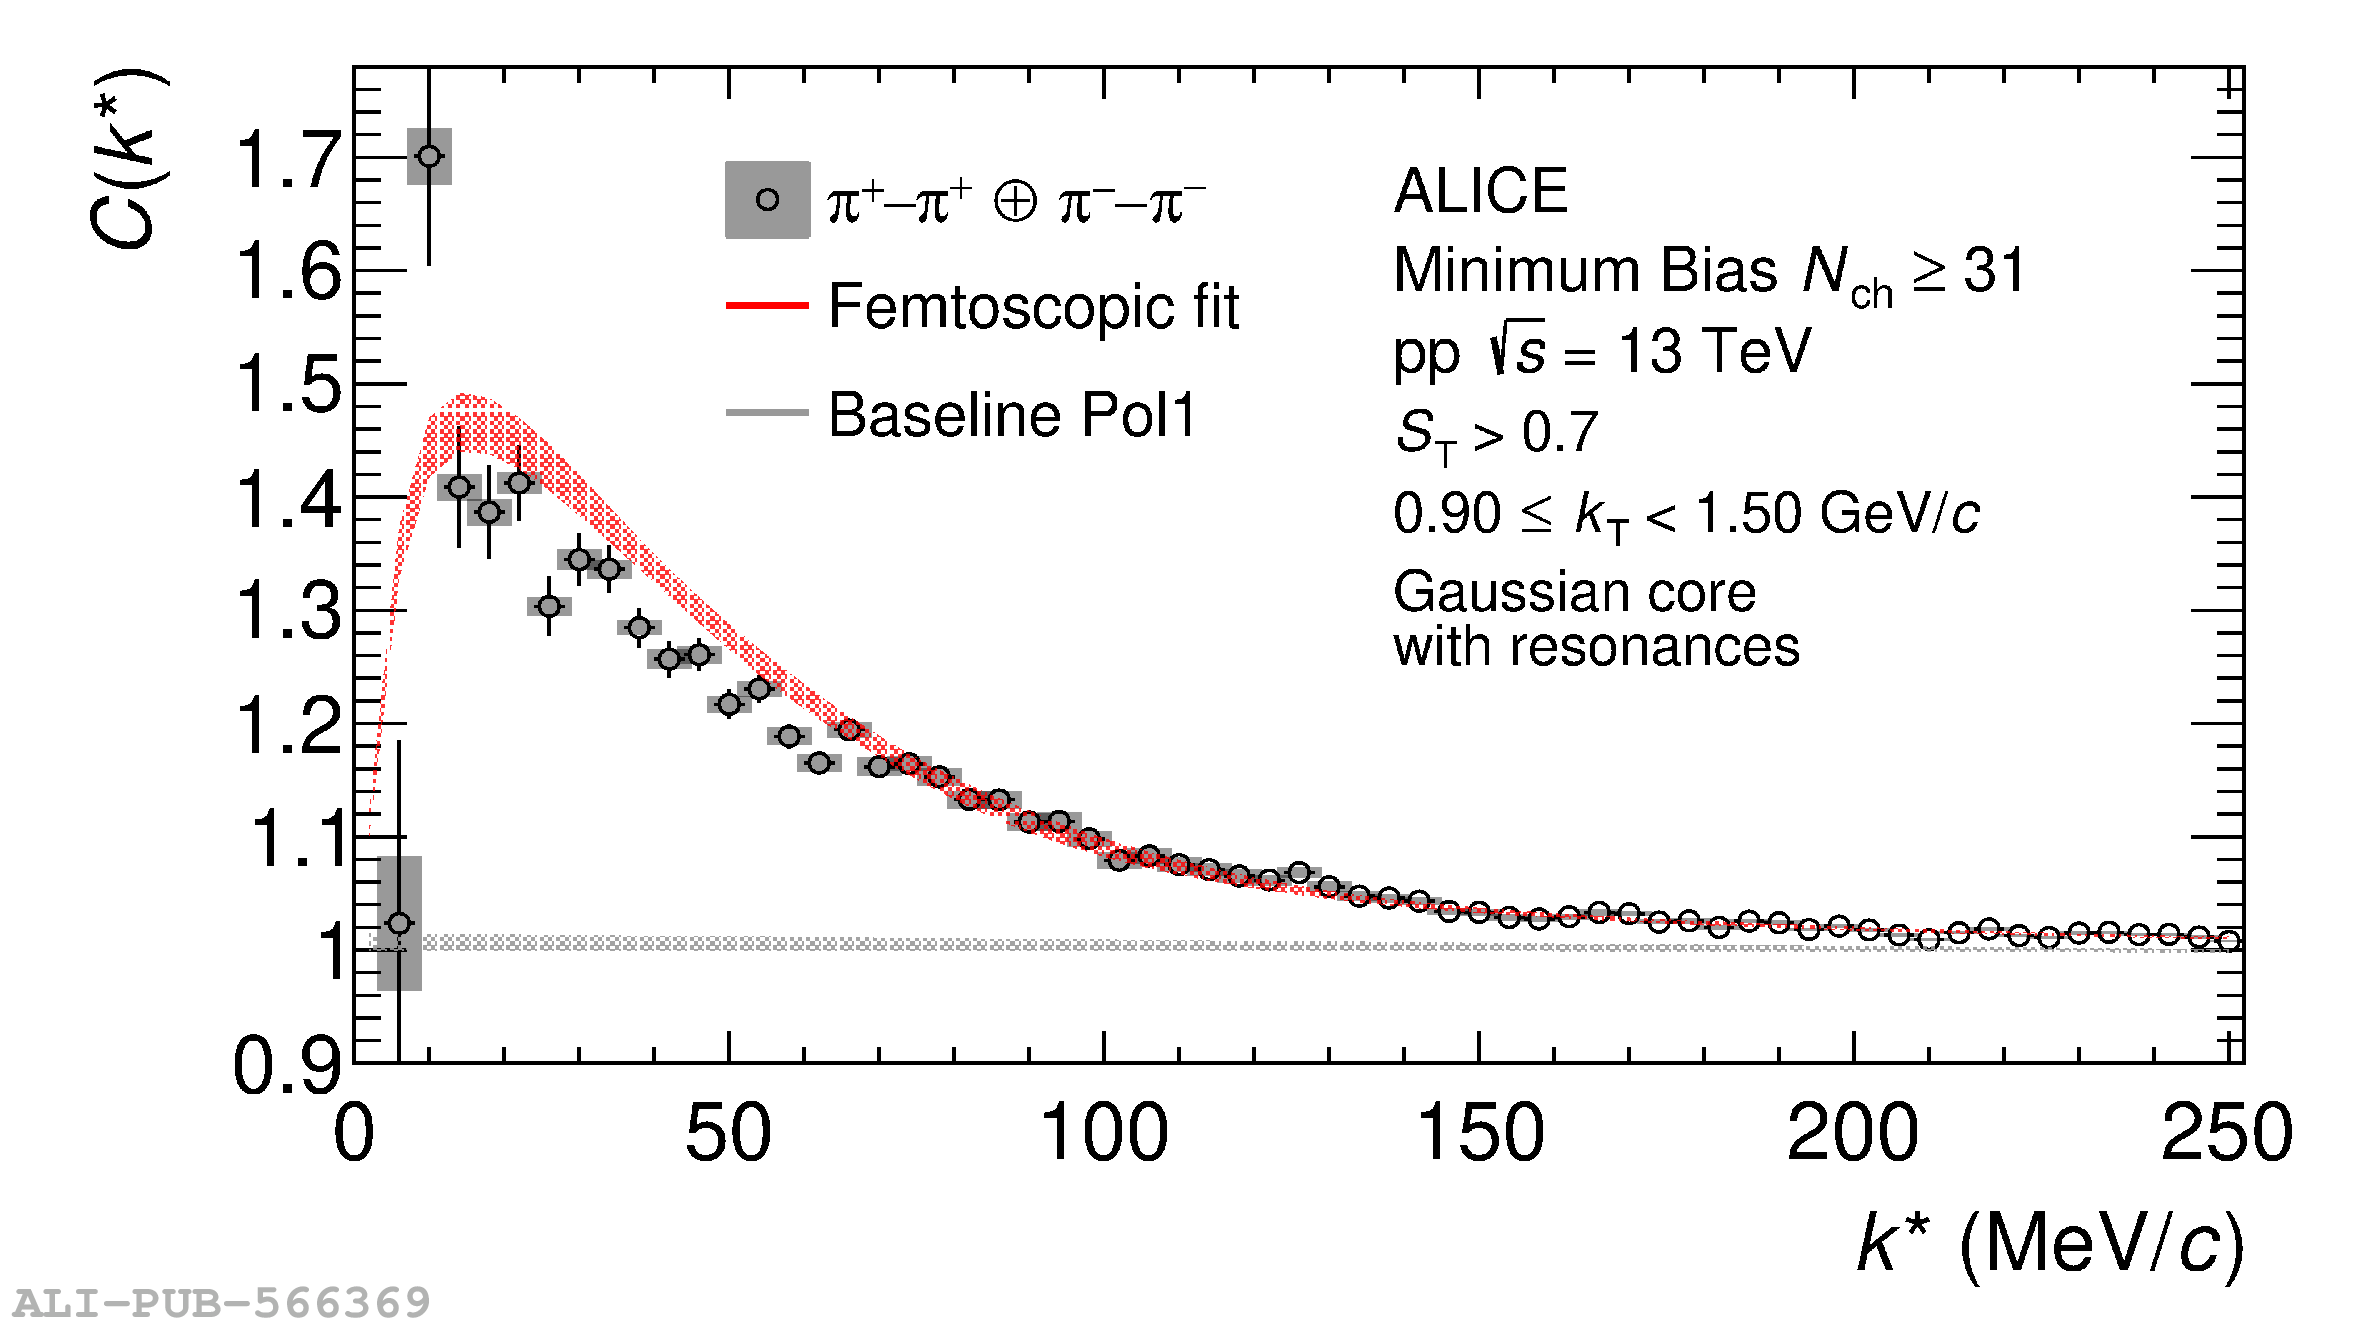 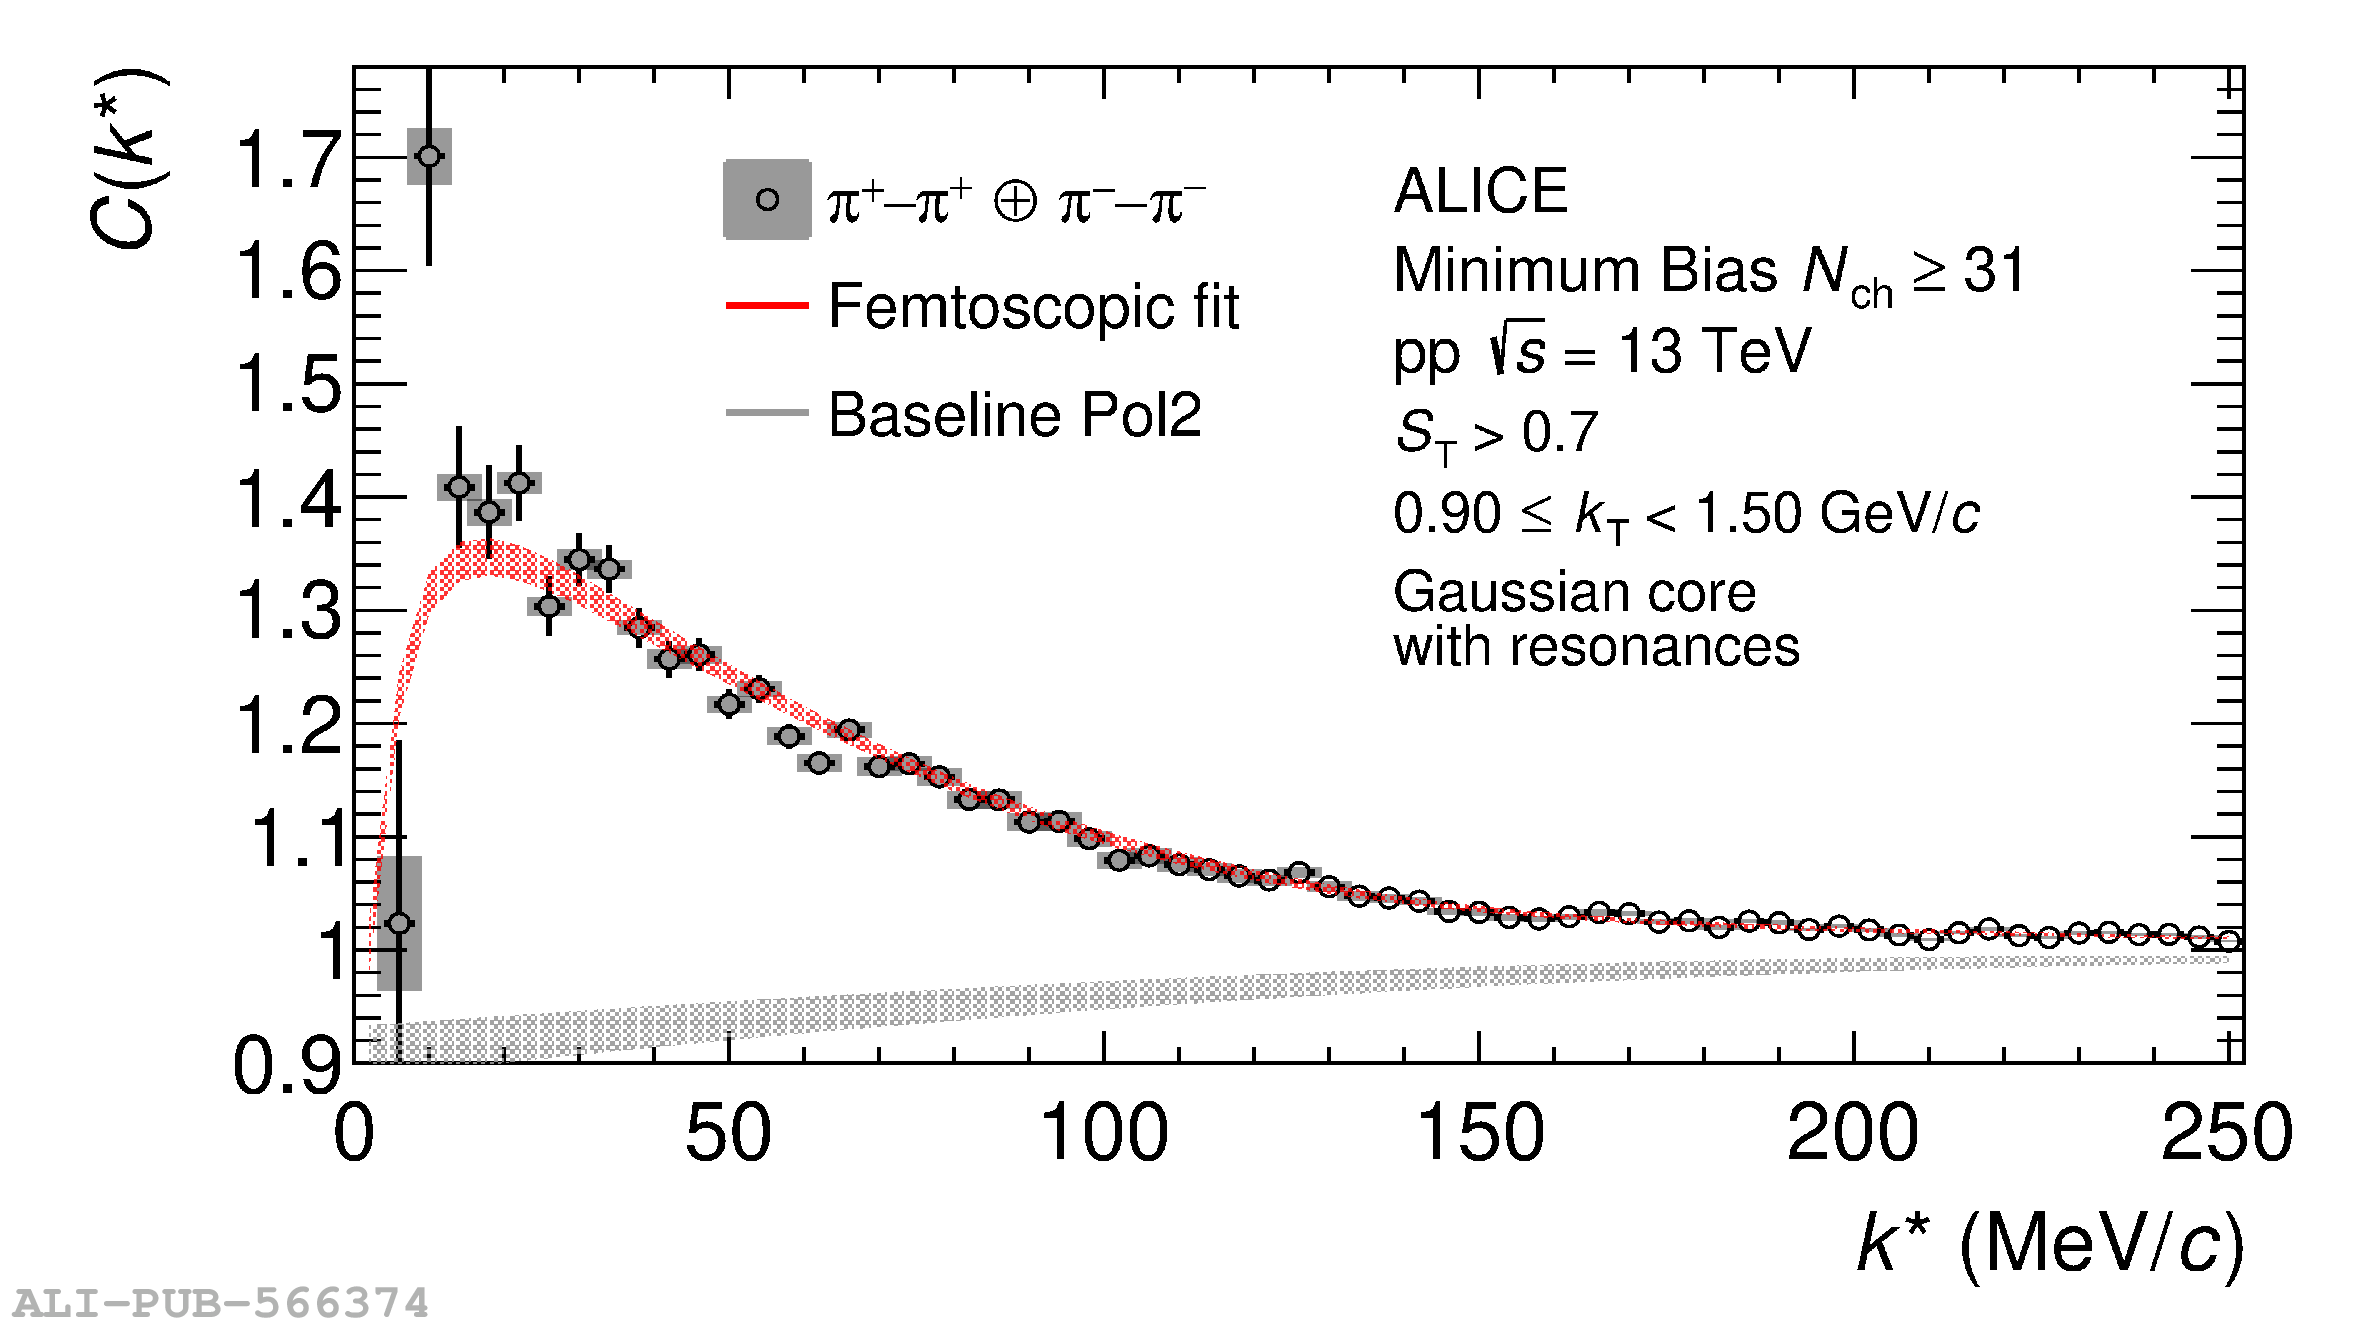 |
Figure A.4
Correlation functions of $\pi-\pi$ in bins of $k_{\rm T}$ for HM collisions, the fits on the left (right) are performed using CATS employing the RSM and assuming a polynomial of first (second) degree as background. The uncertainties of the data points are obtained by varying the selection criteria as described in the text. The uncertainty bands of the fit function are obtained by employing a bootstrap procedure. | 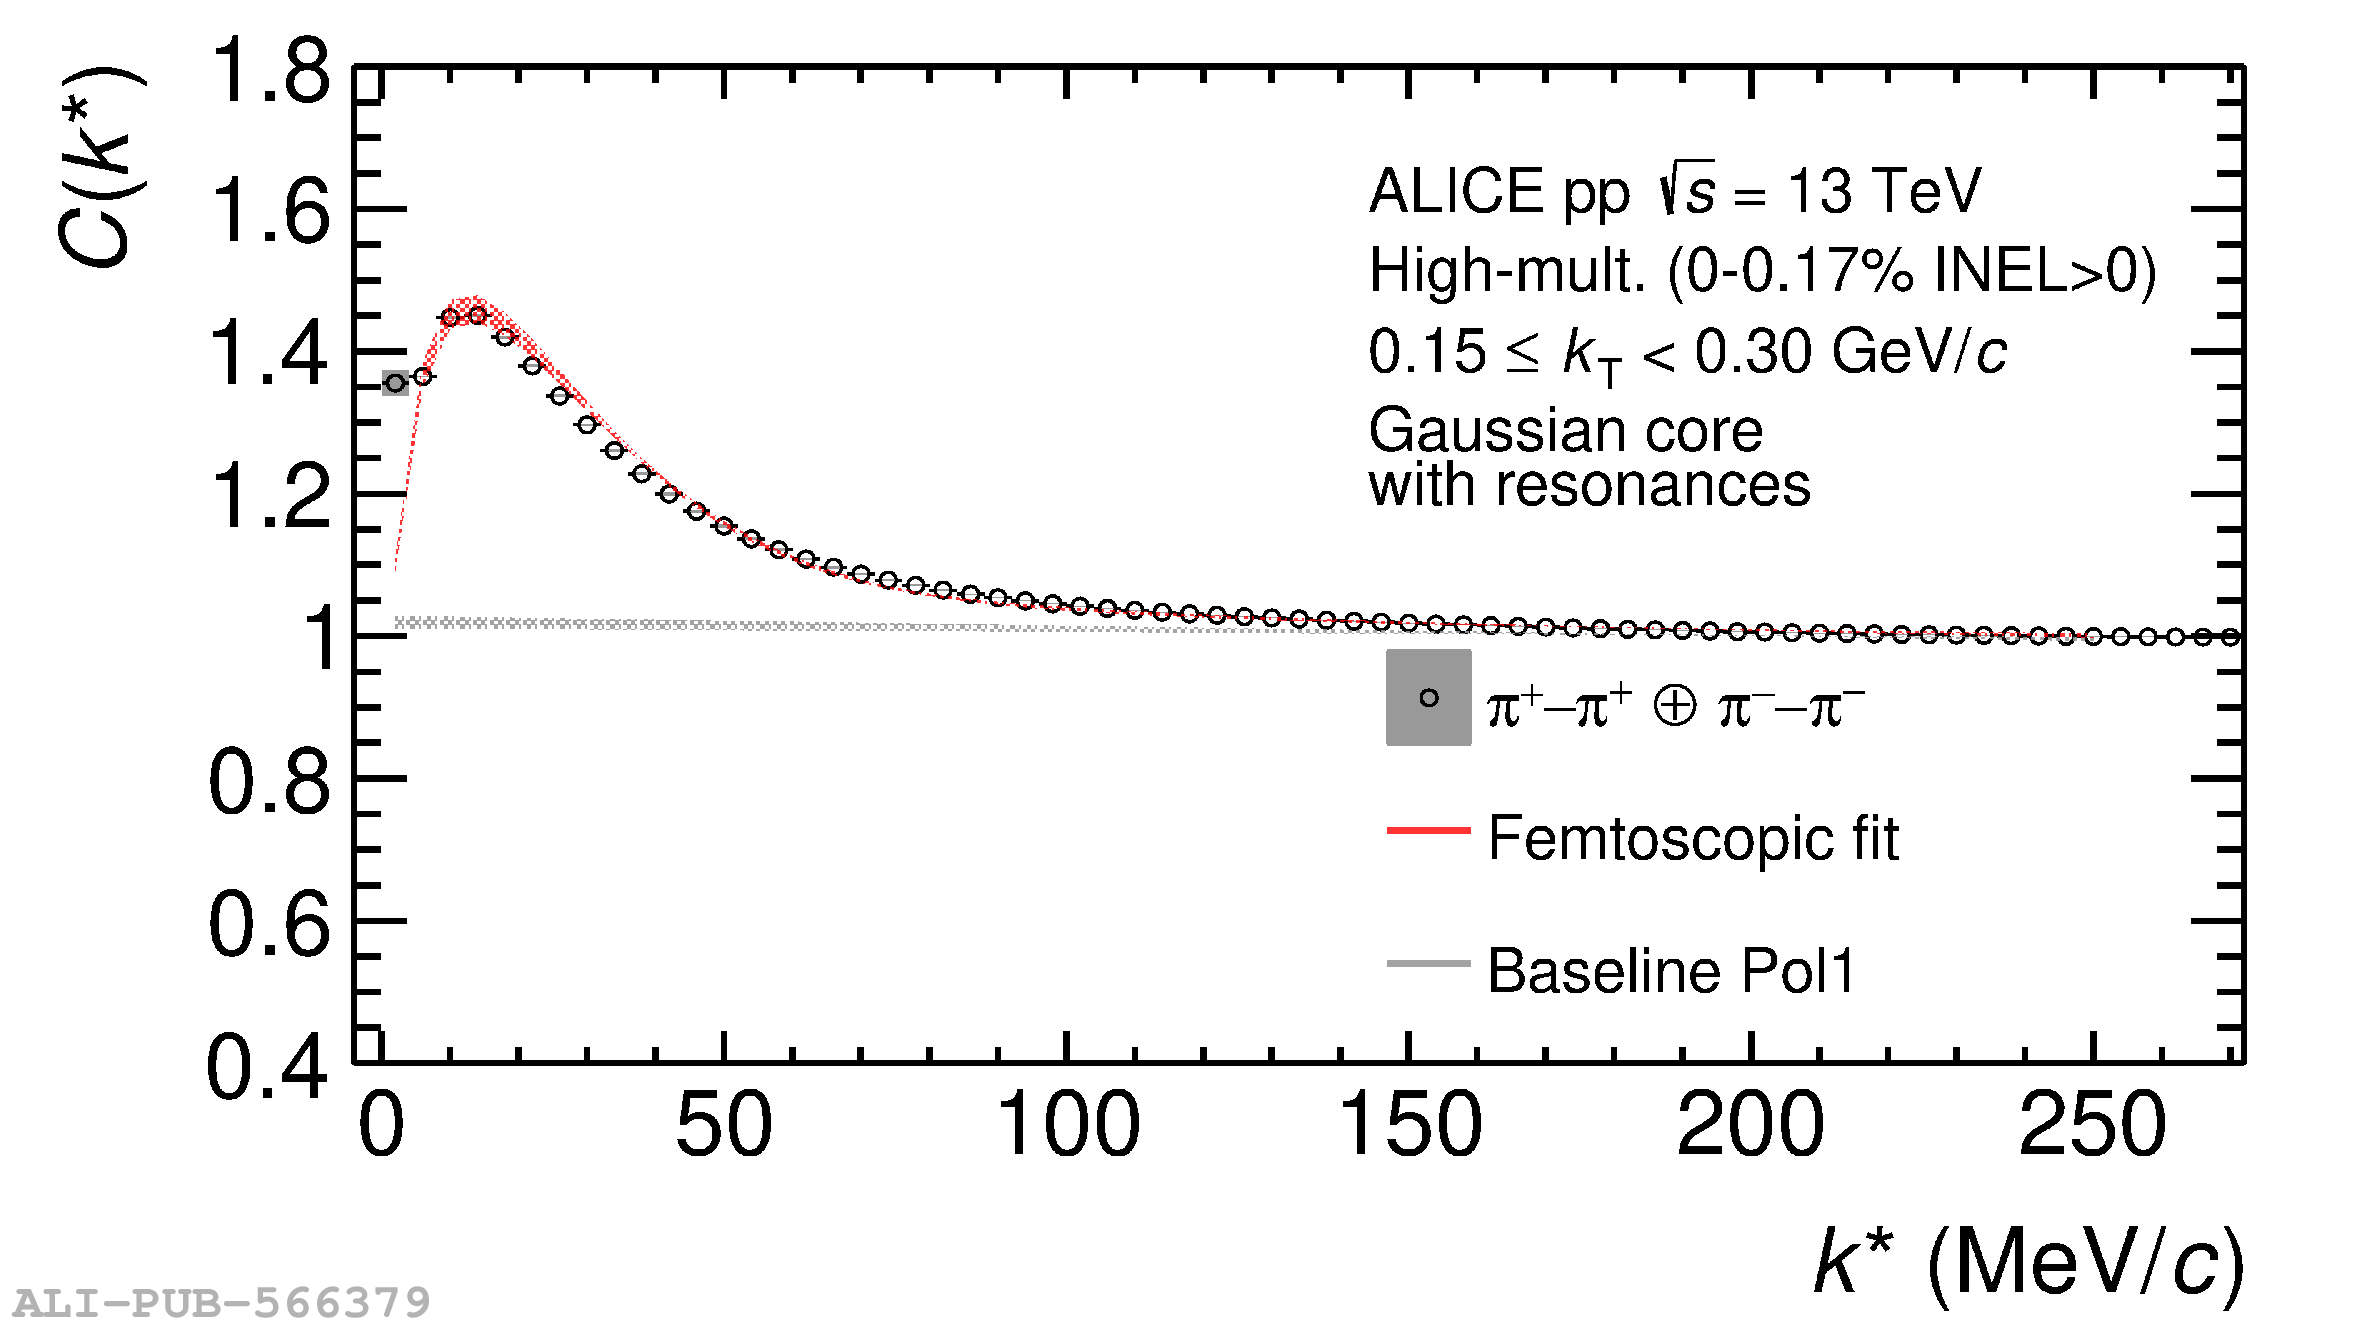 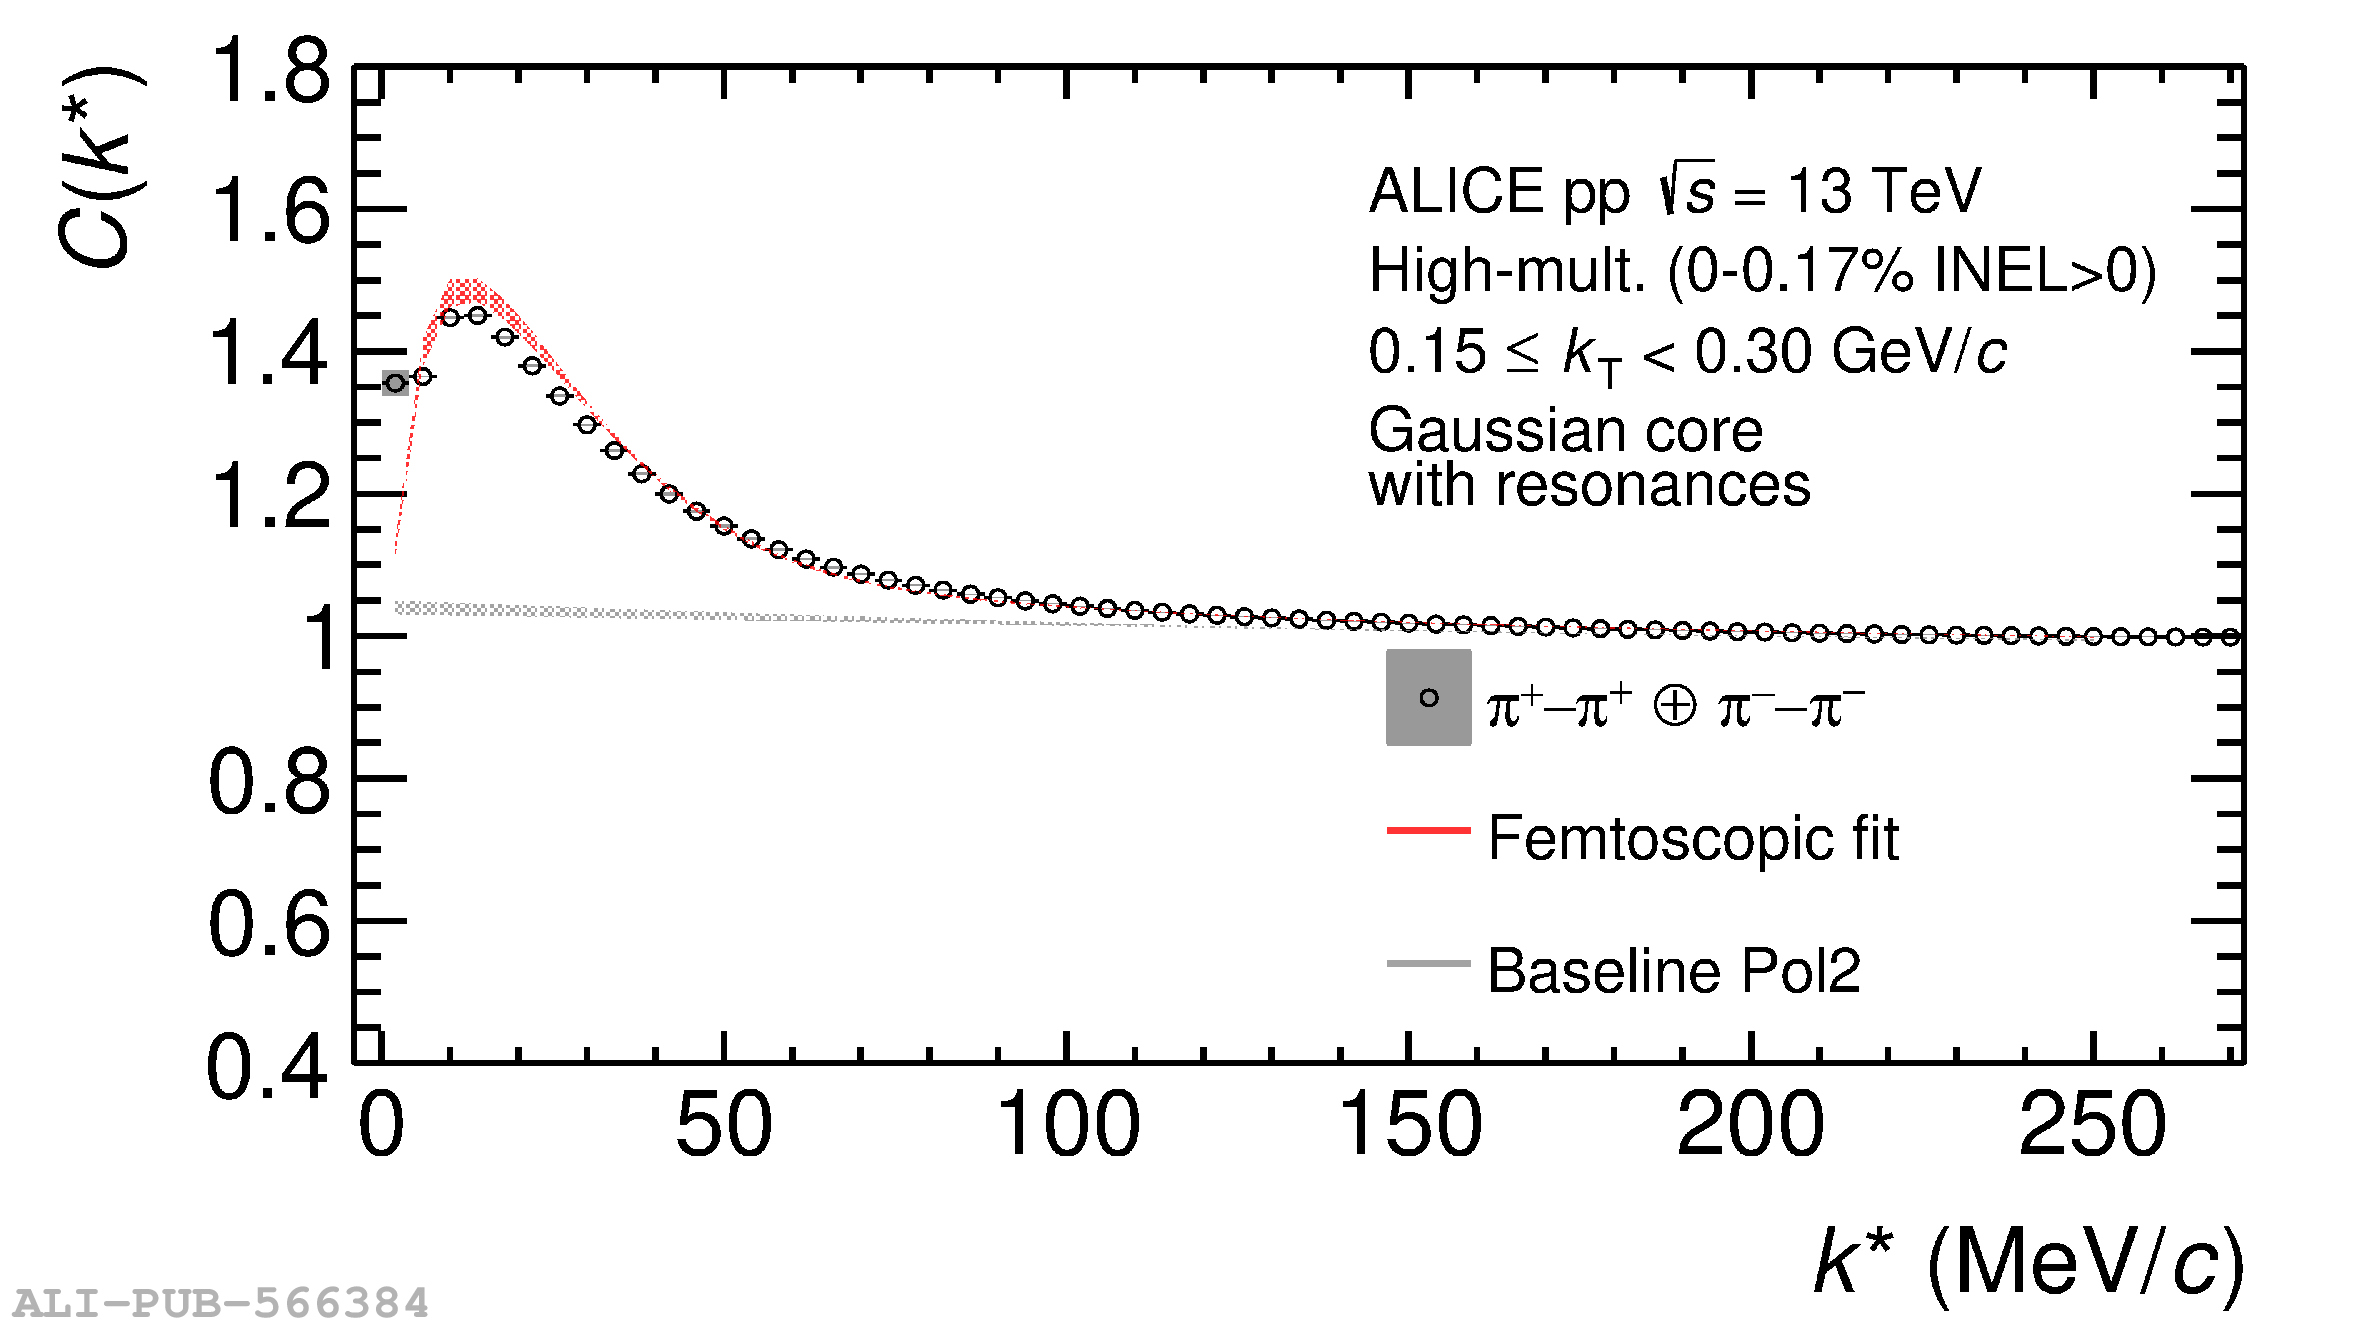 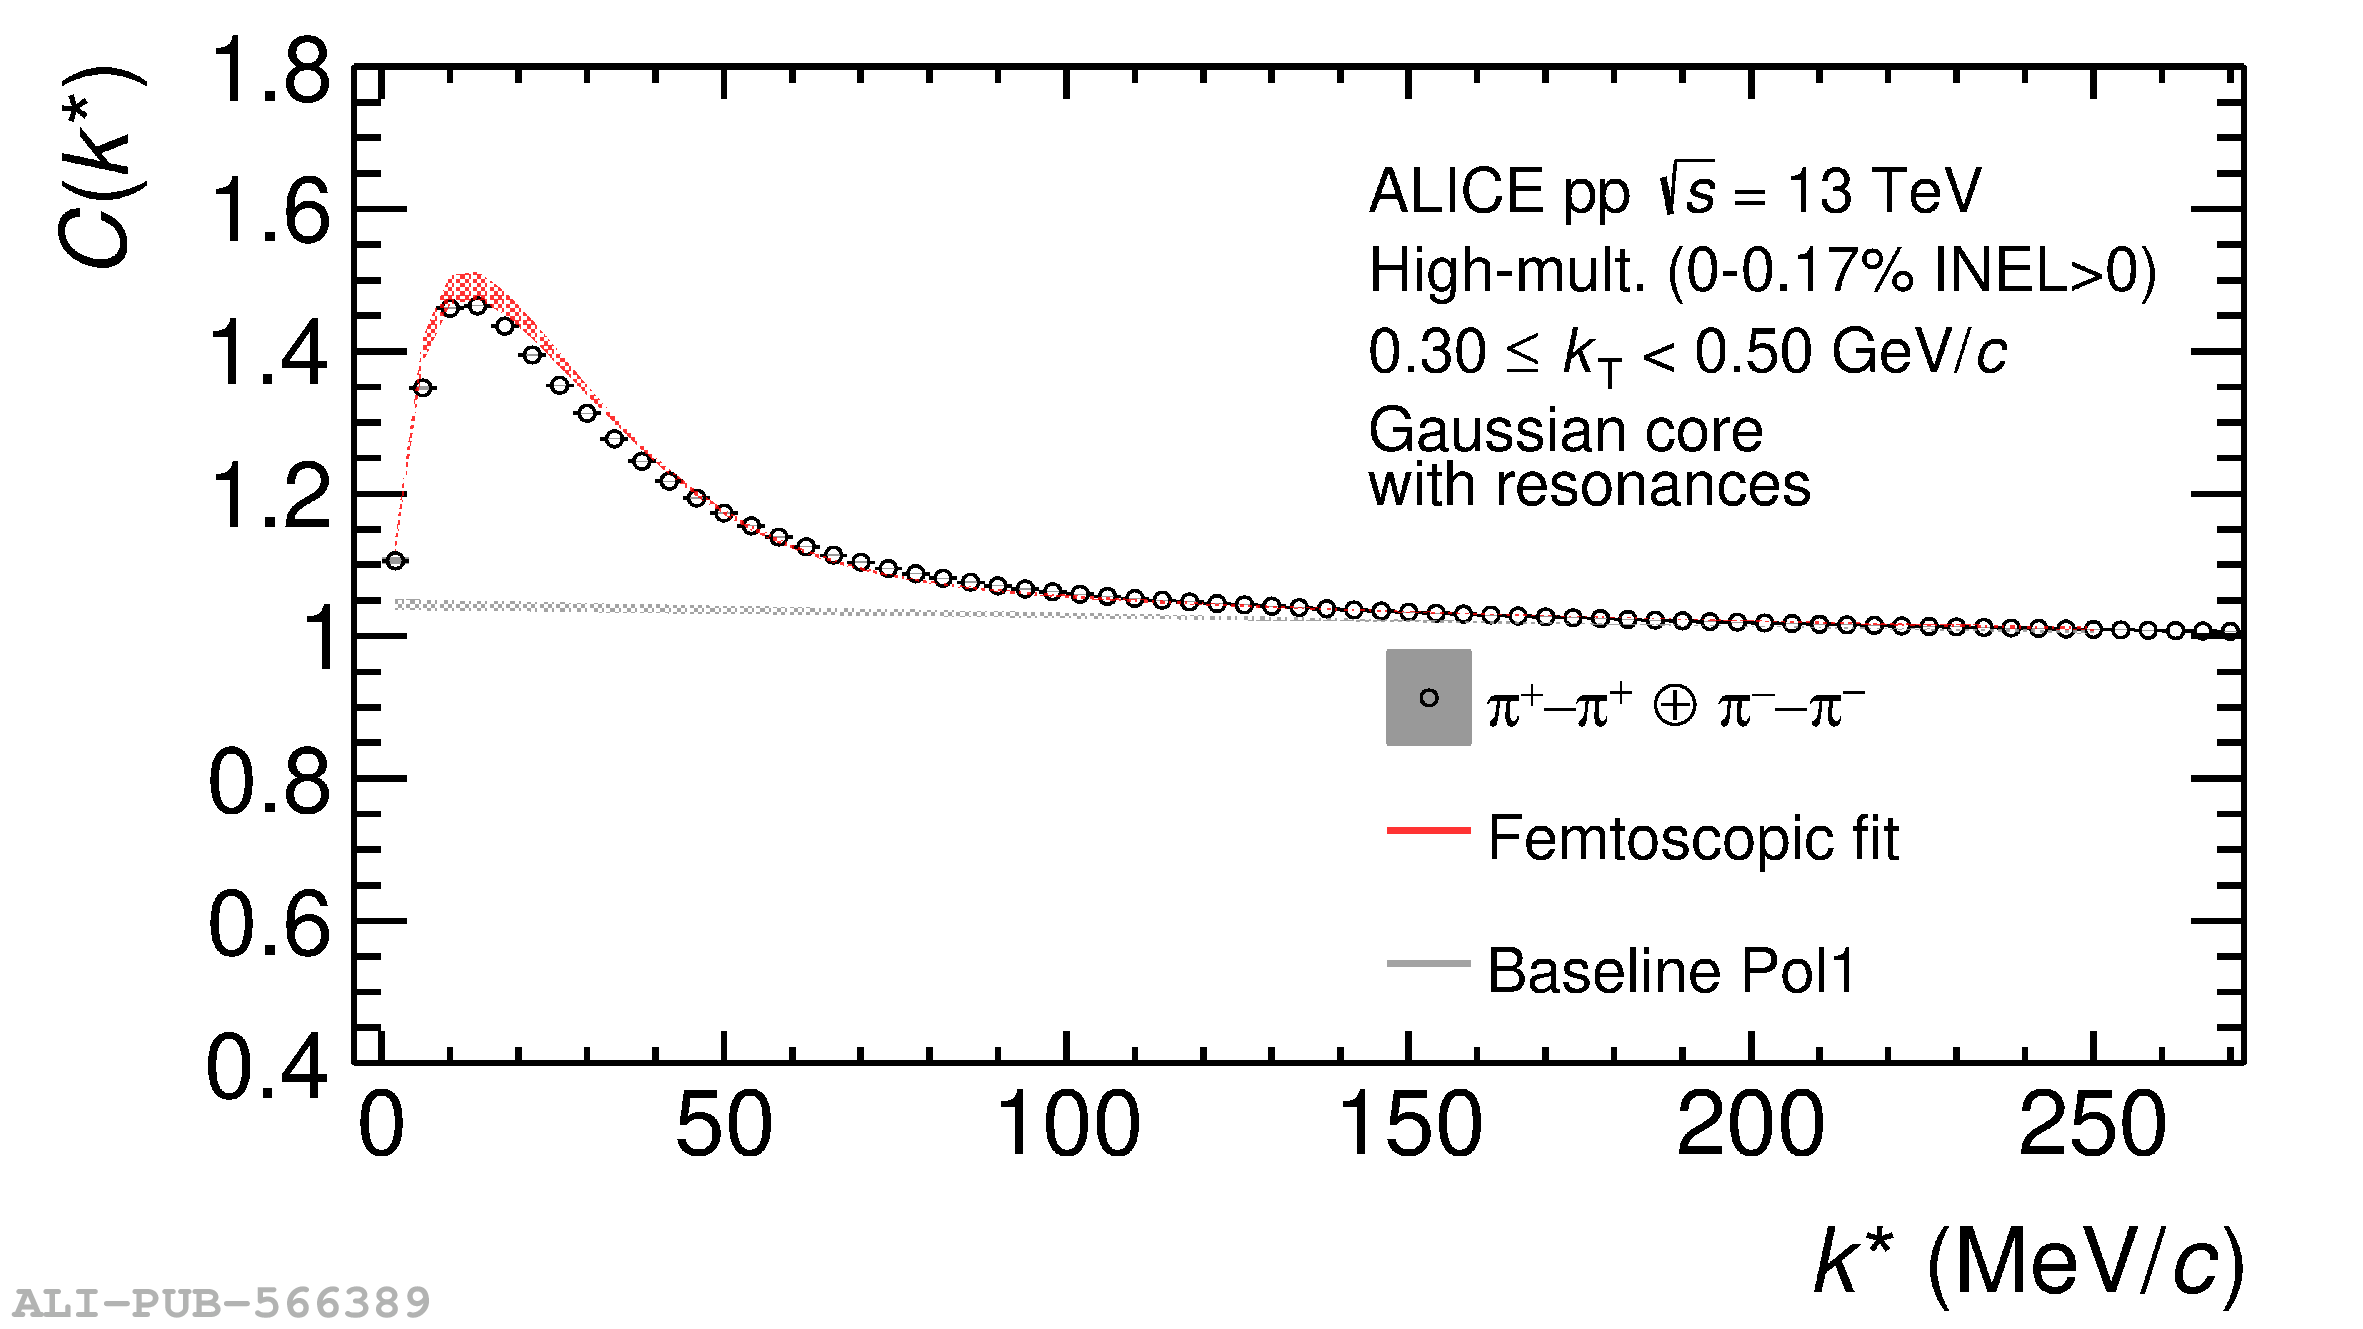  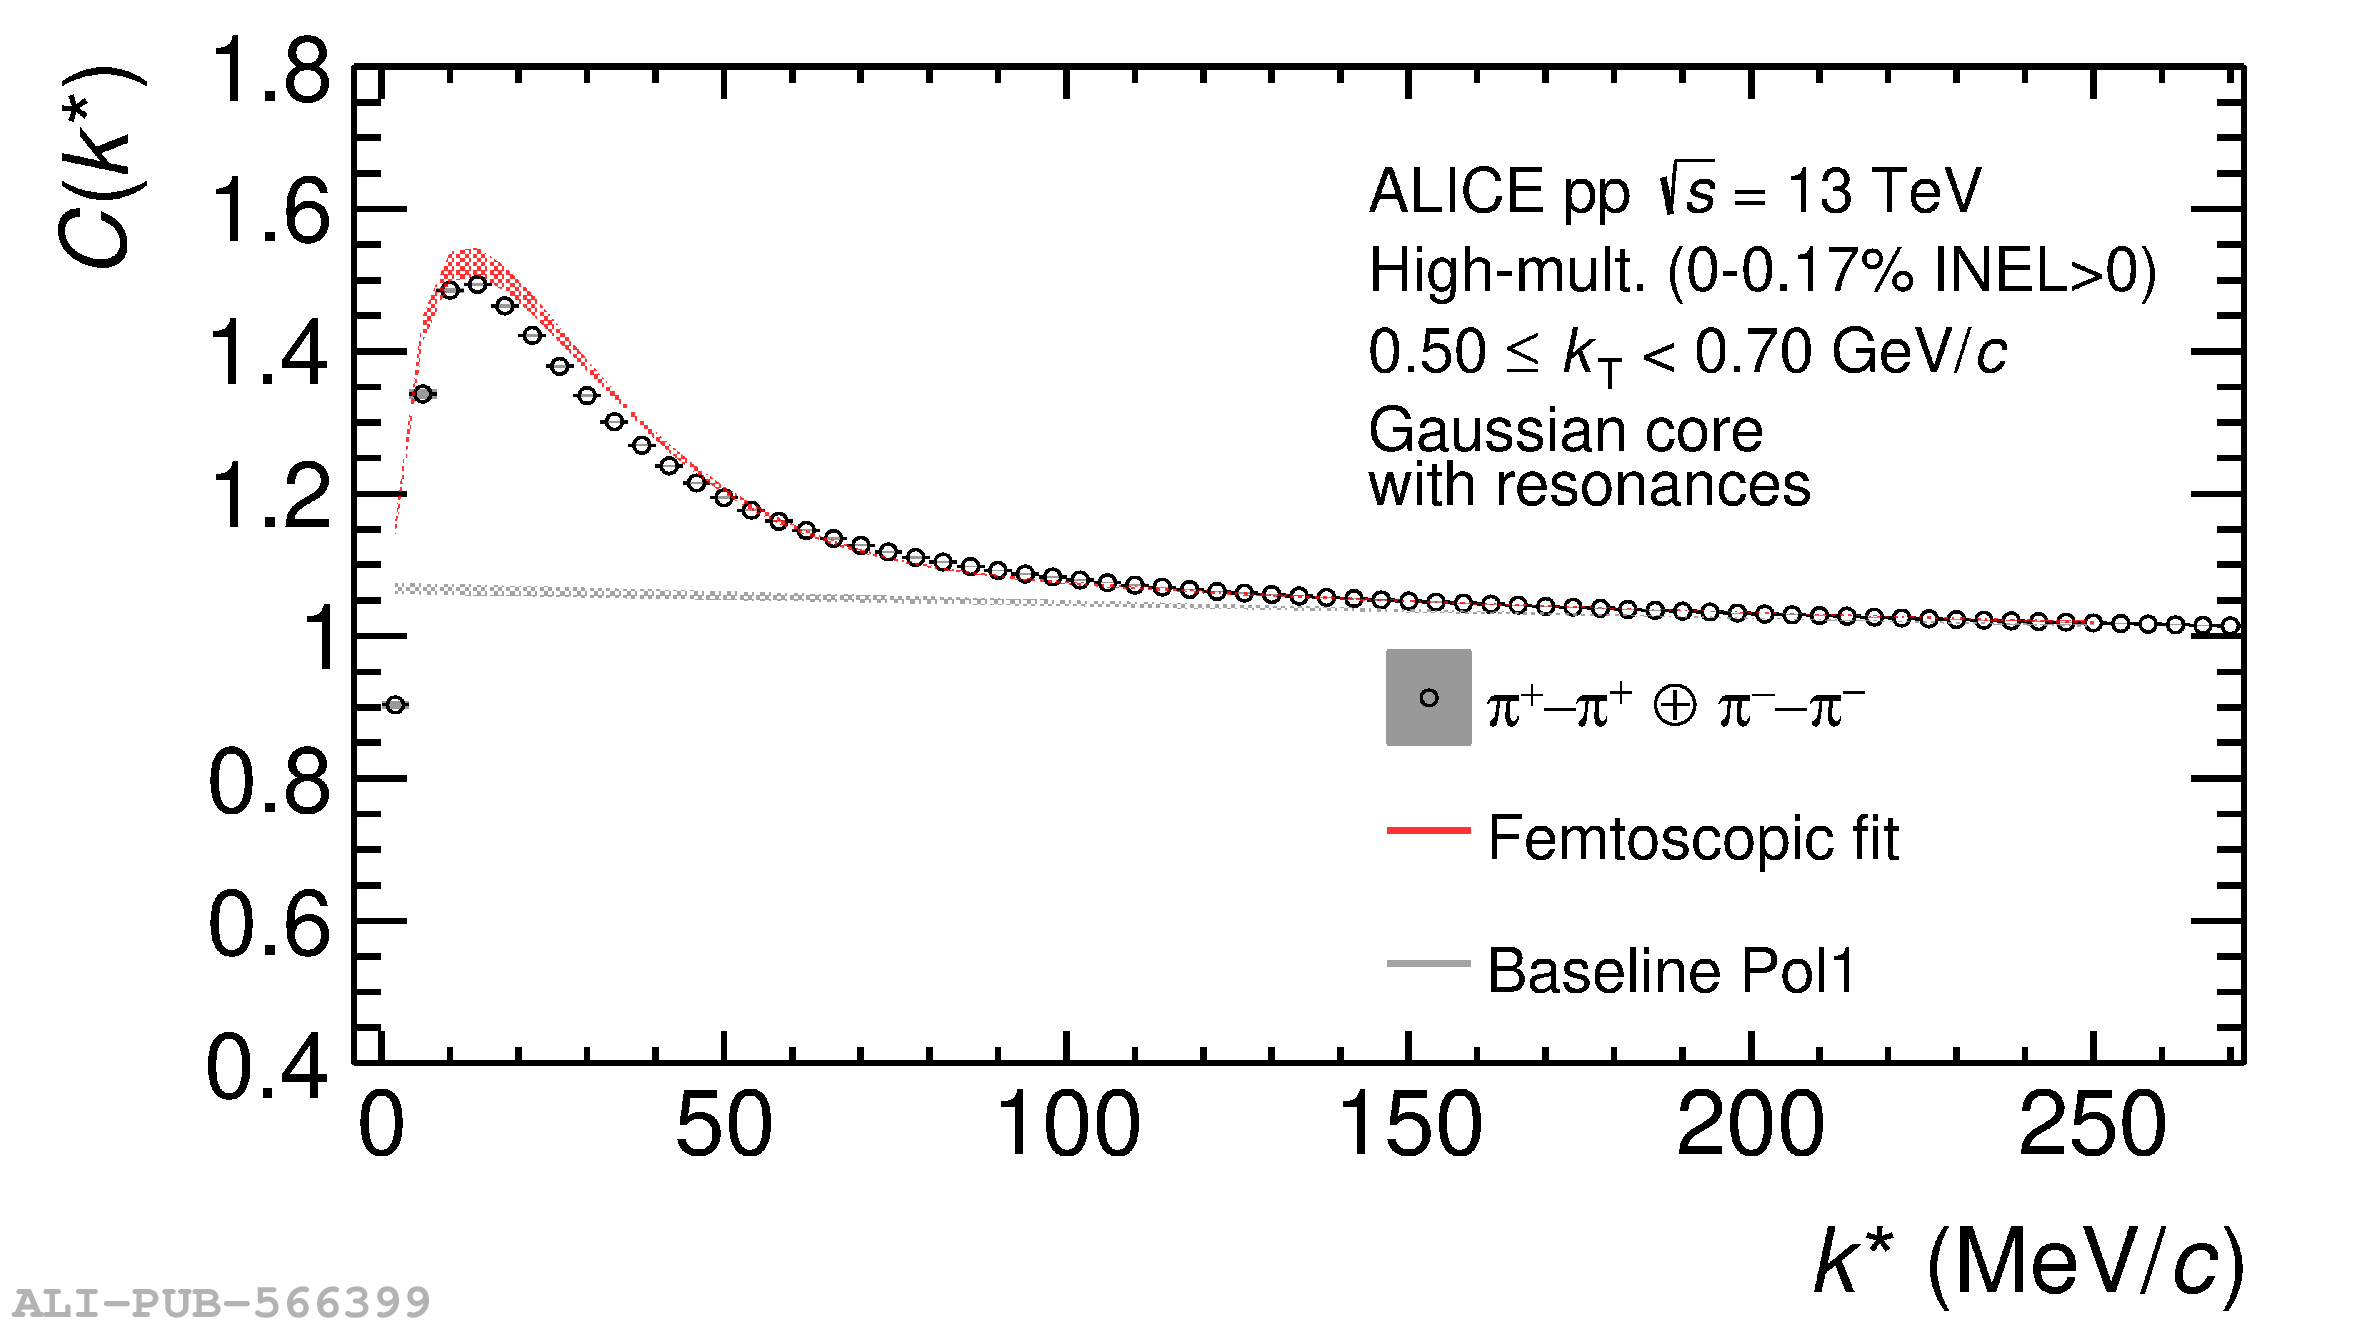 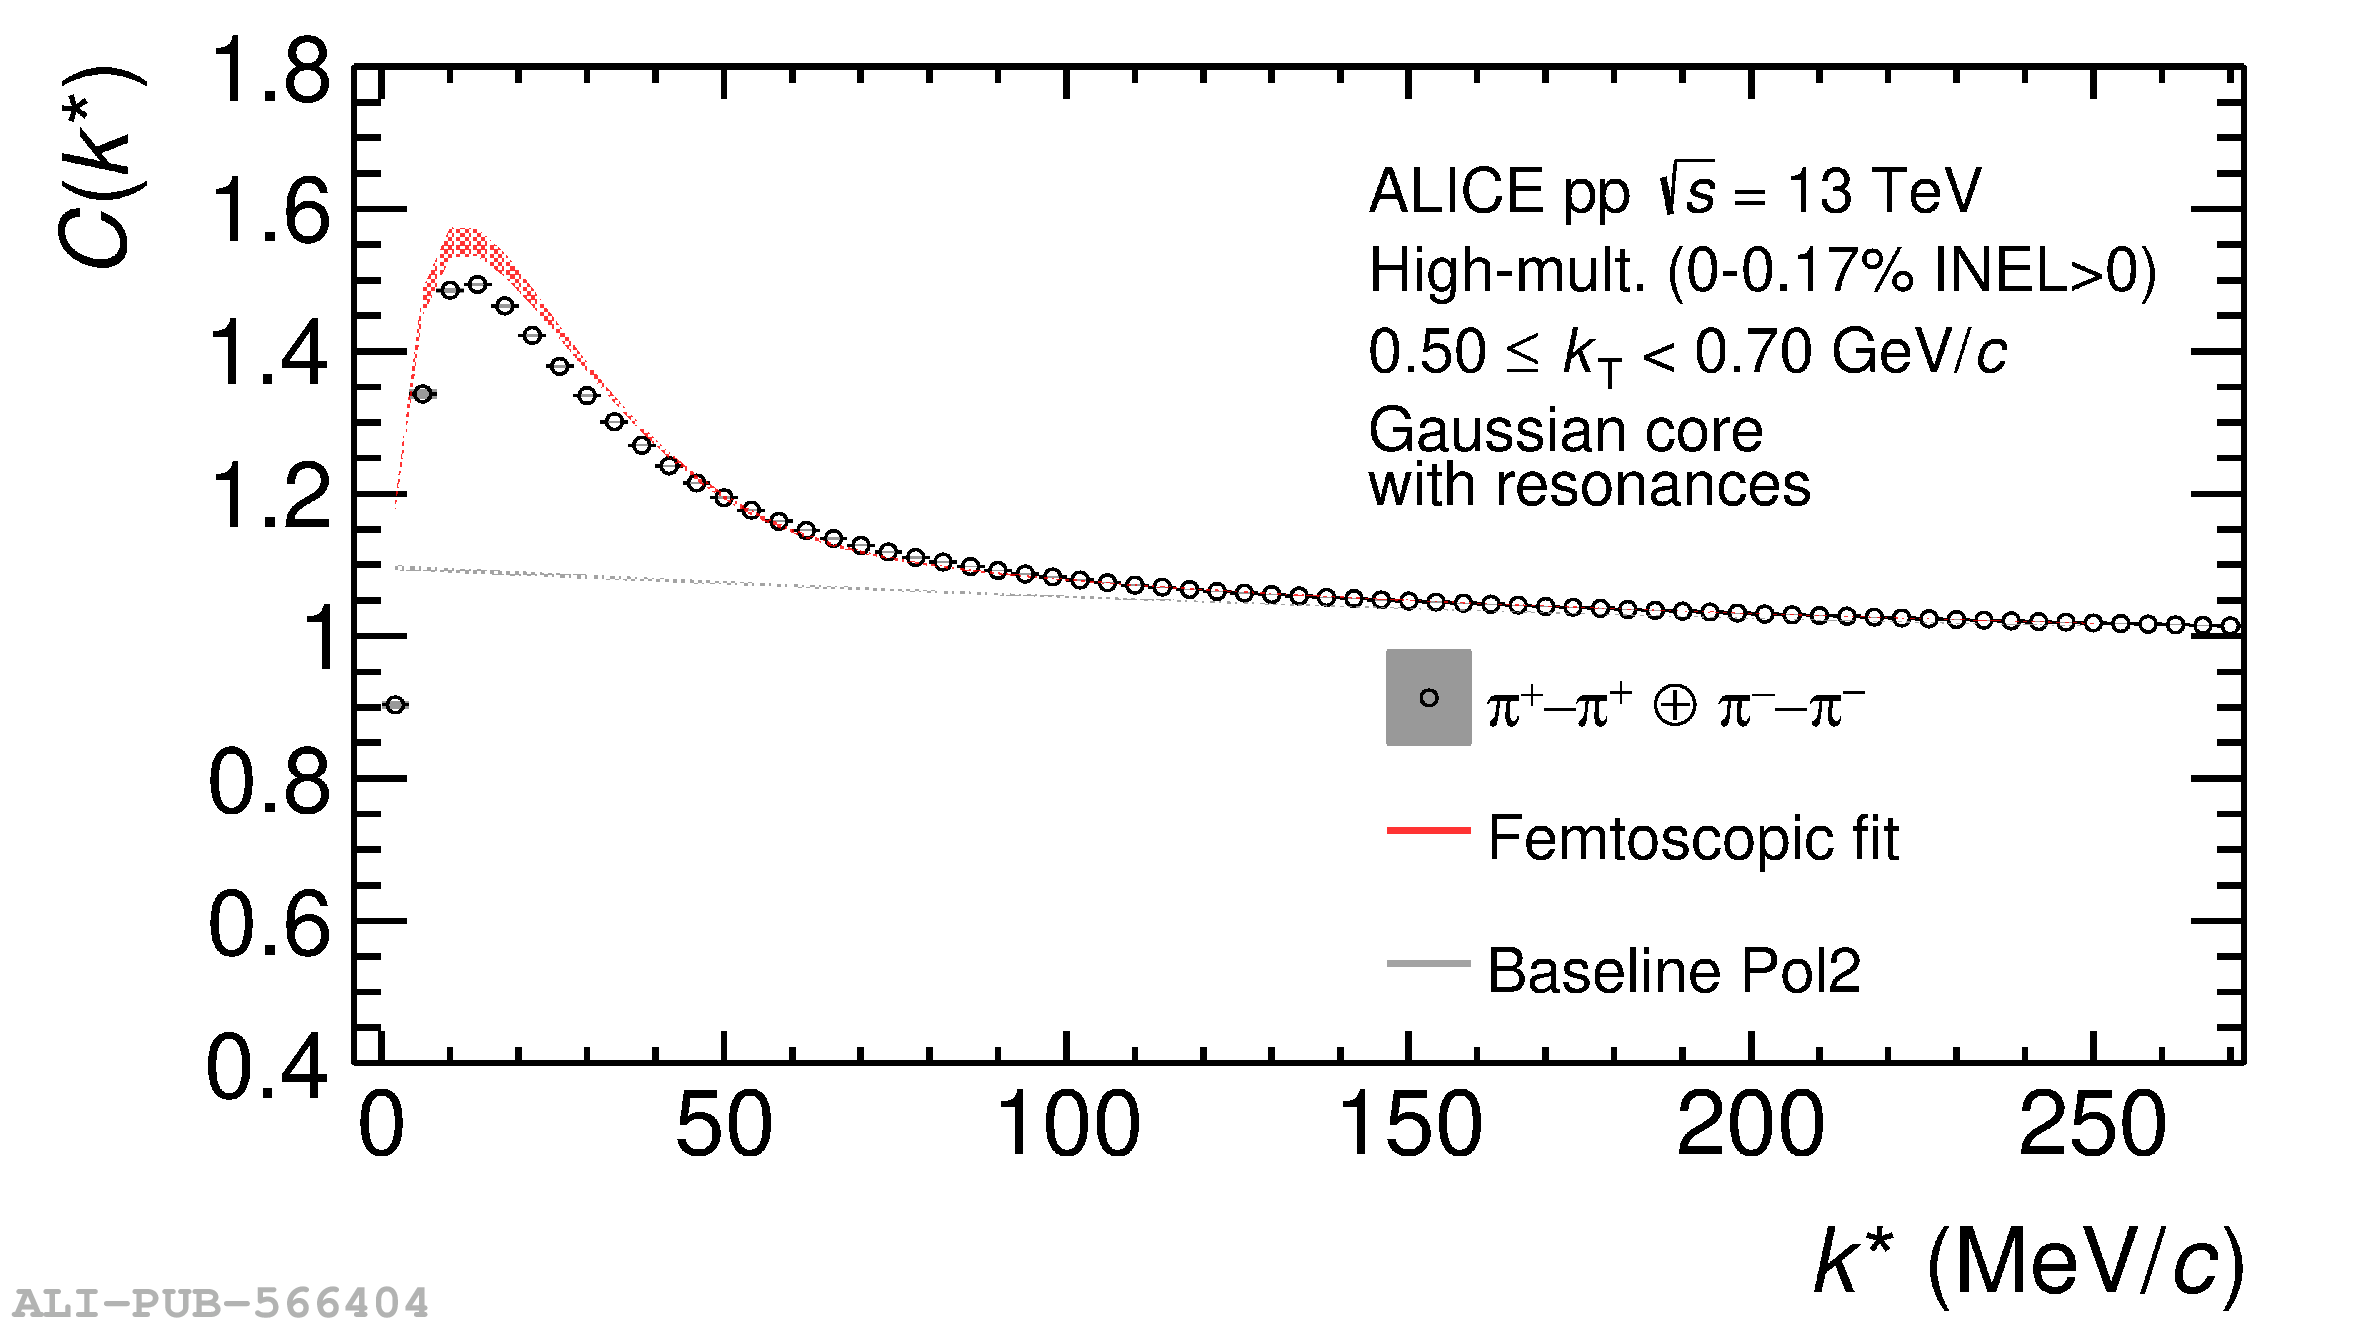 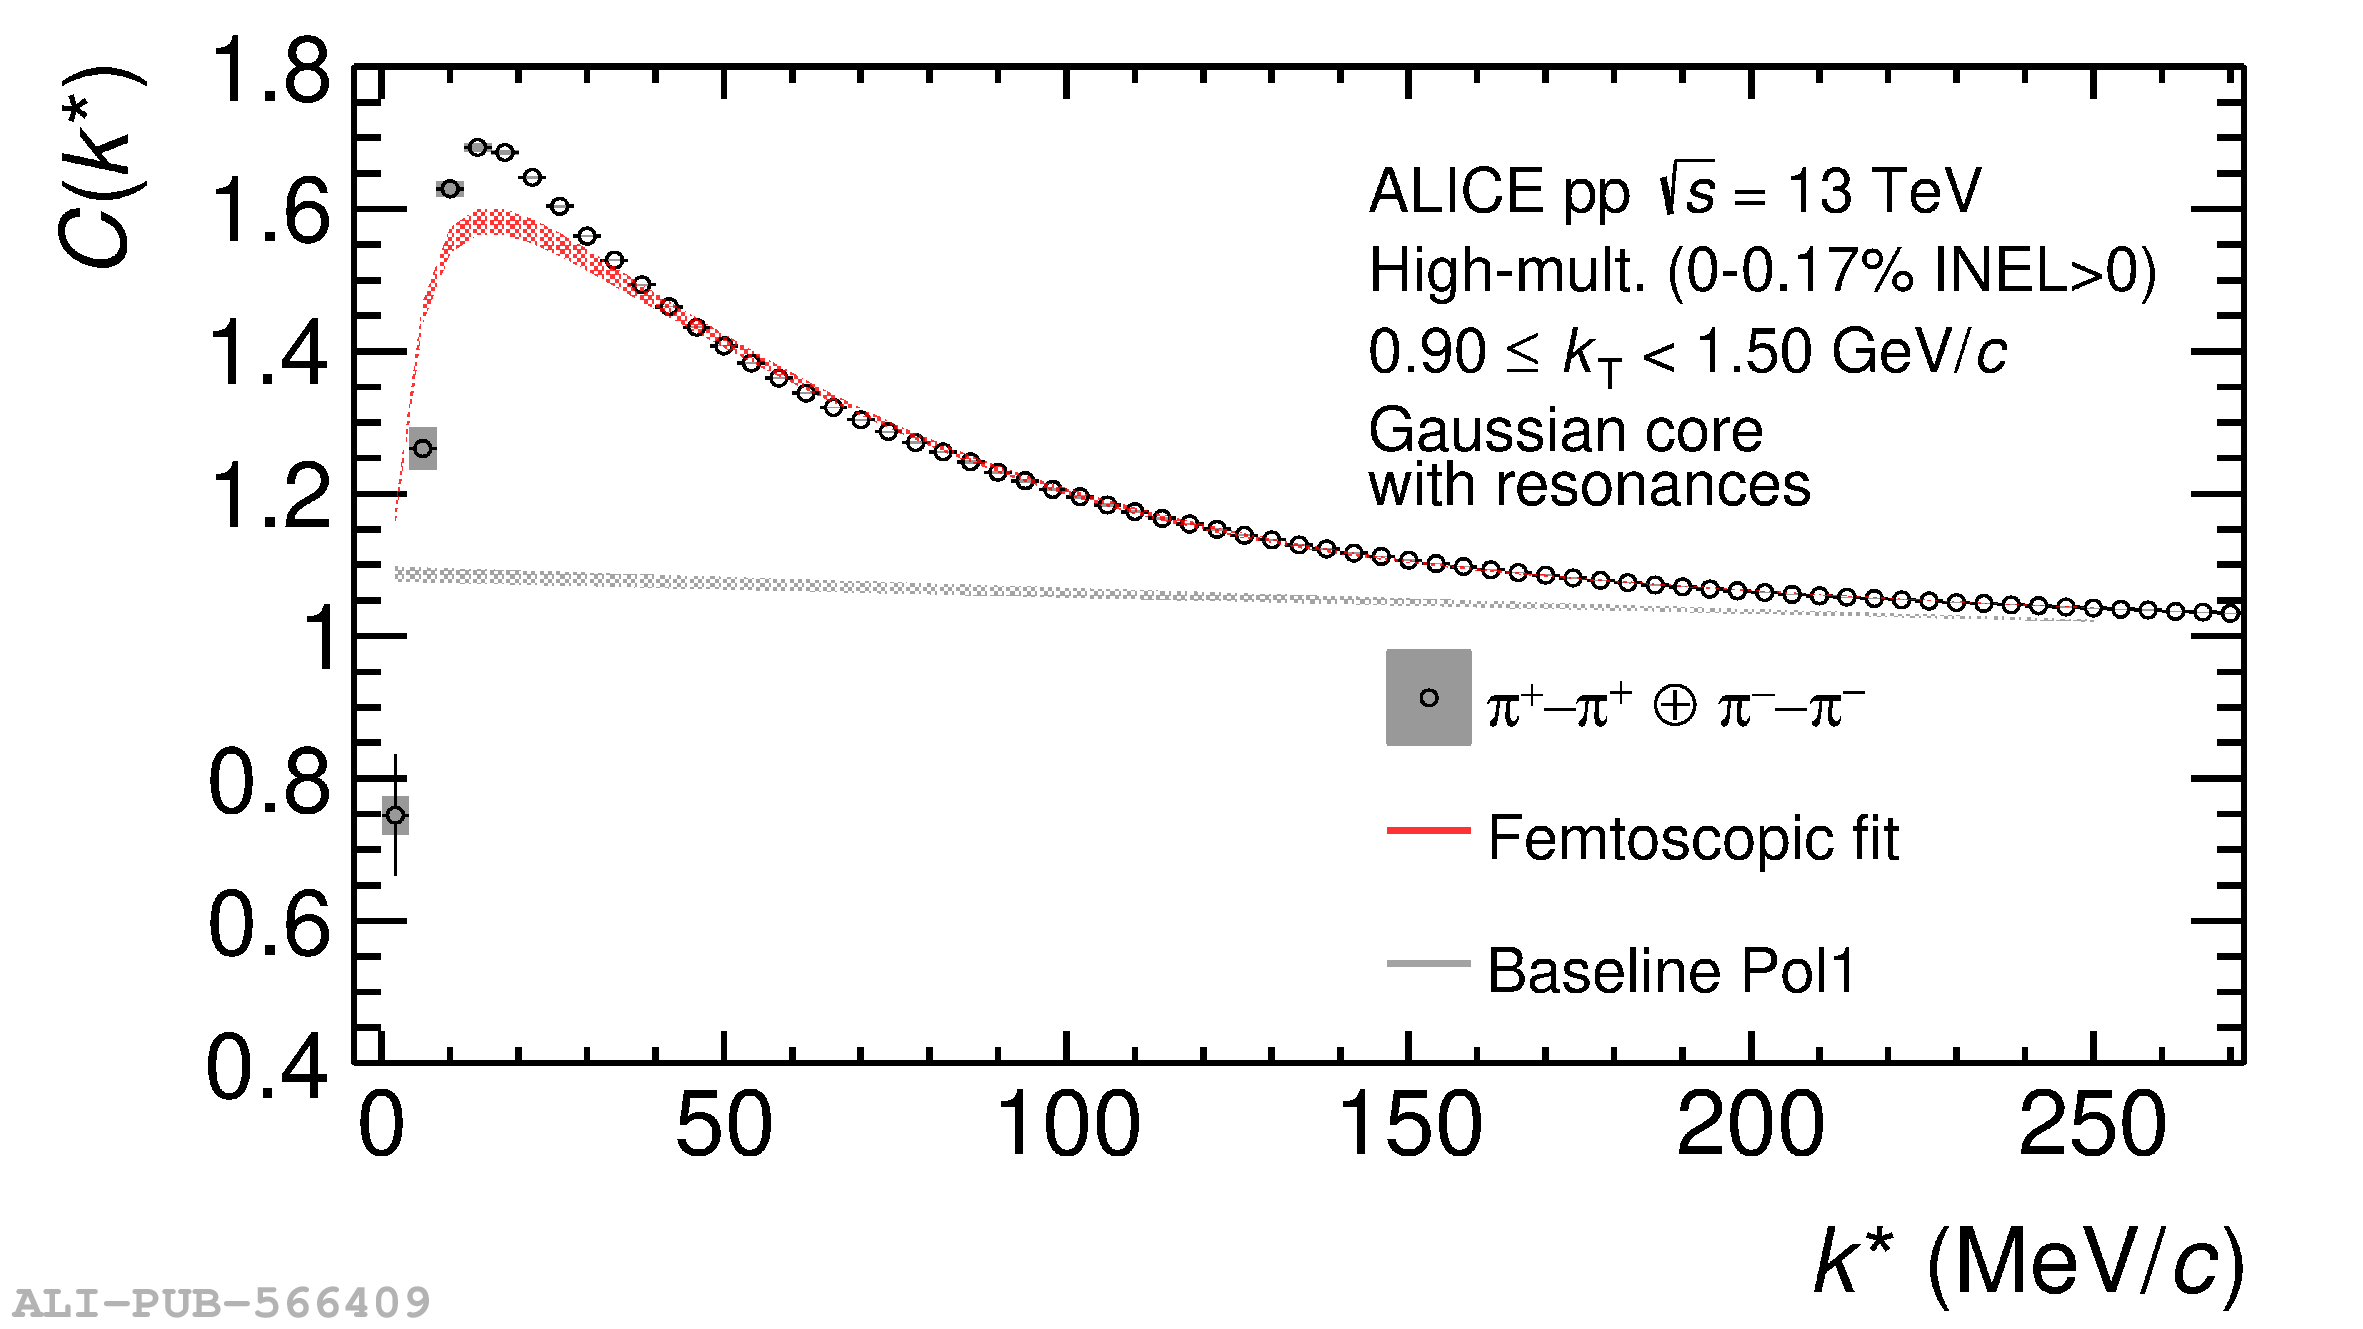 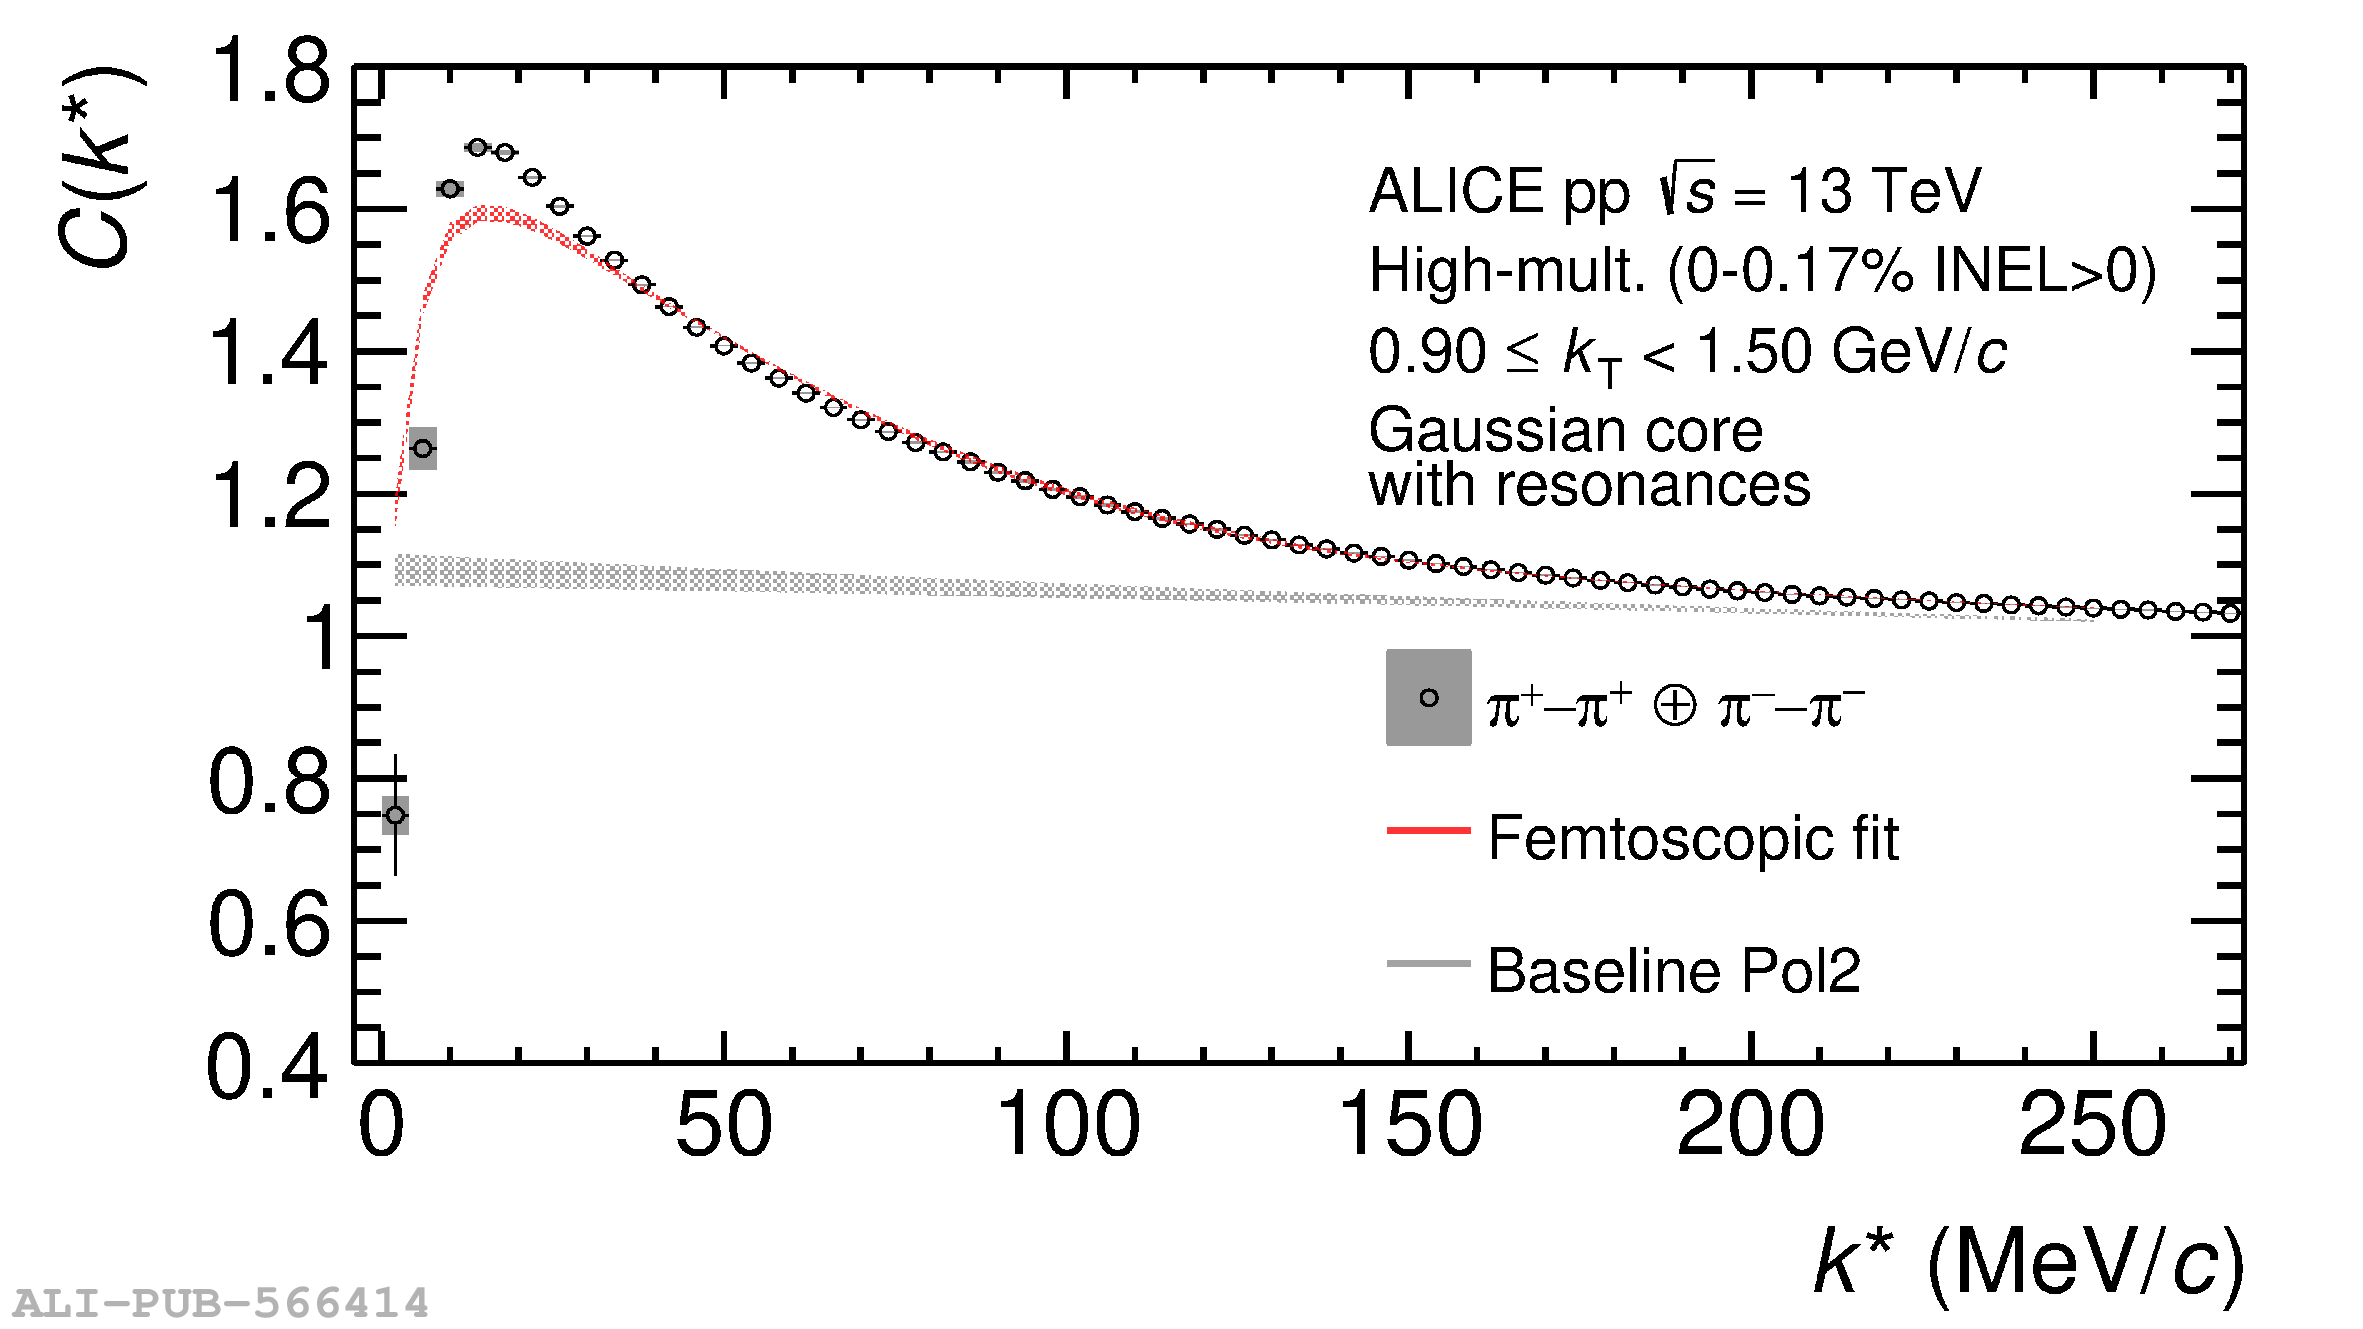 |