Correlation functions of \Kp pairs in different ranges of \mt for HM pp collisions as indicated in each panel. Vertical bars represent statistical uncertainties while boxes systematic uncertainties, respectively. The fits are performed using CATS employing the root mean square deviation for a uniform distribution in each \ks interval. The uncertainty bands of the fit function are obtained by employing a bootstrap procedure. | 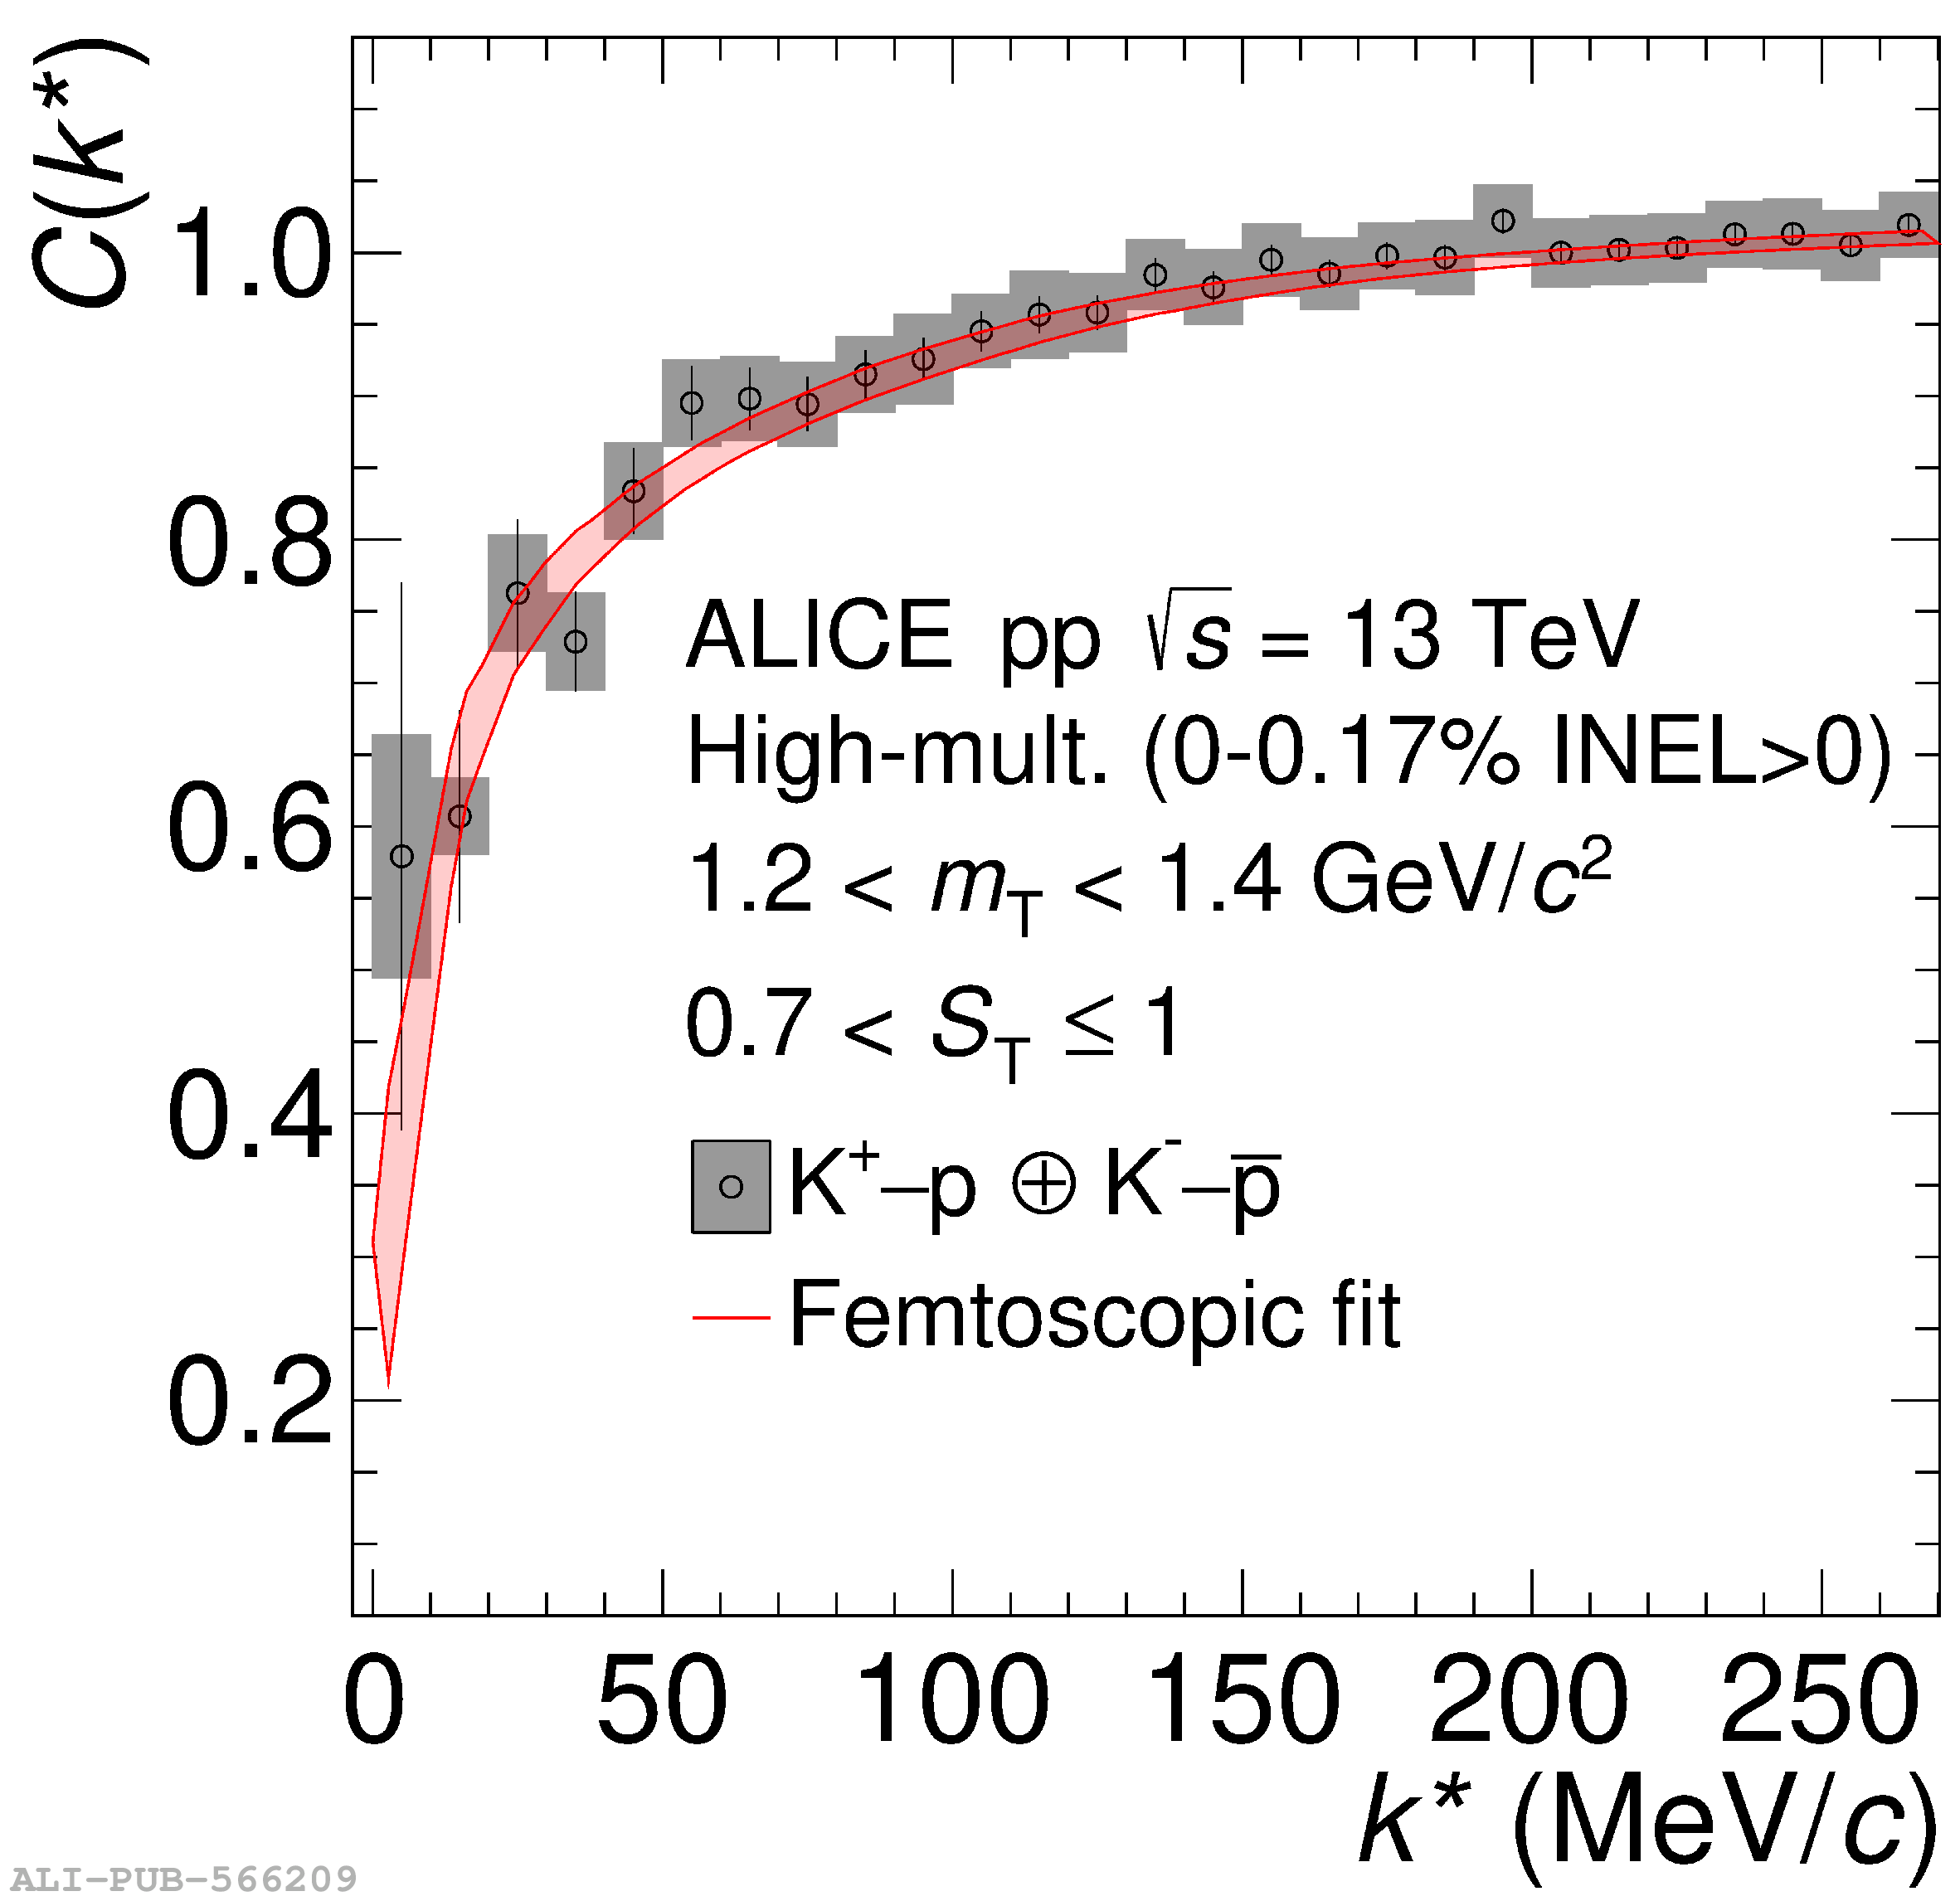 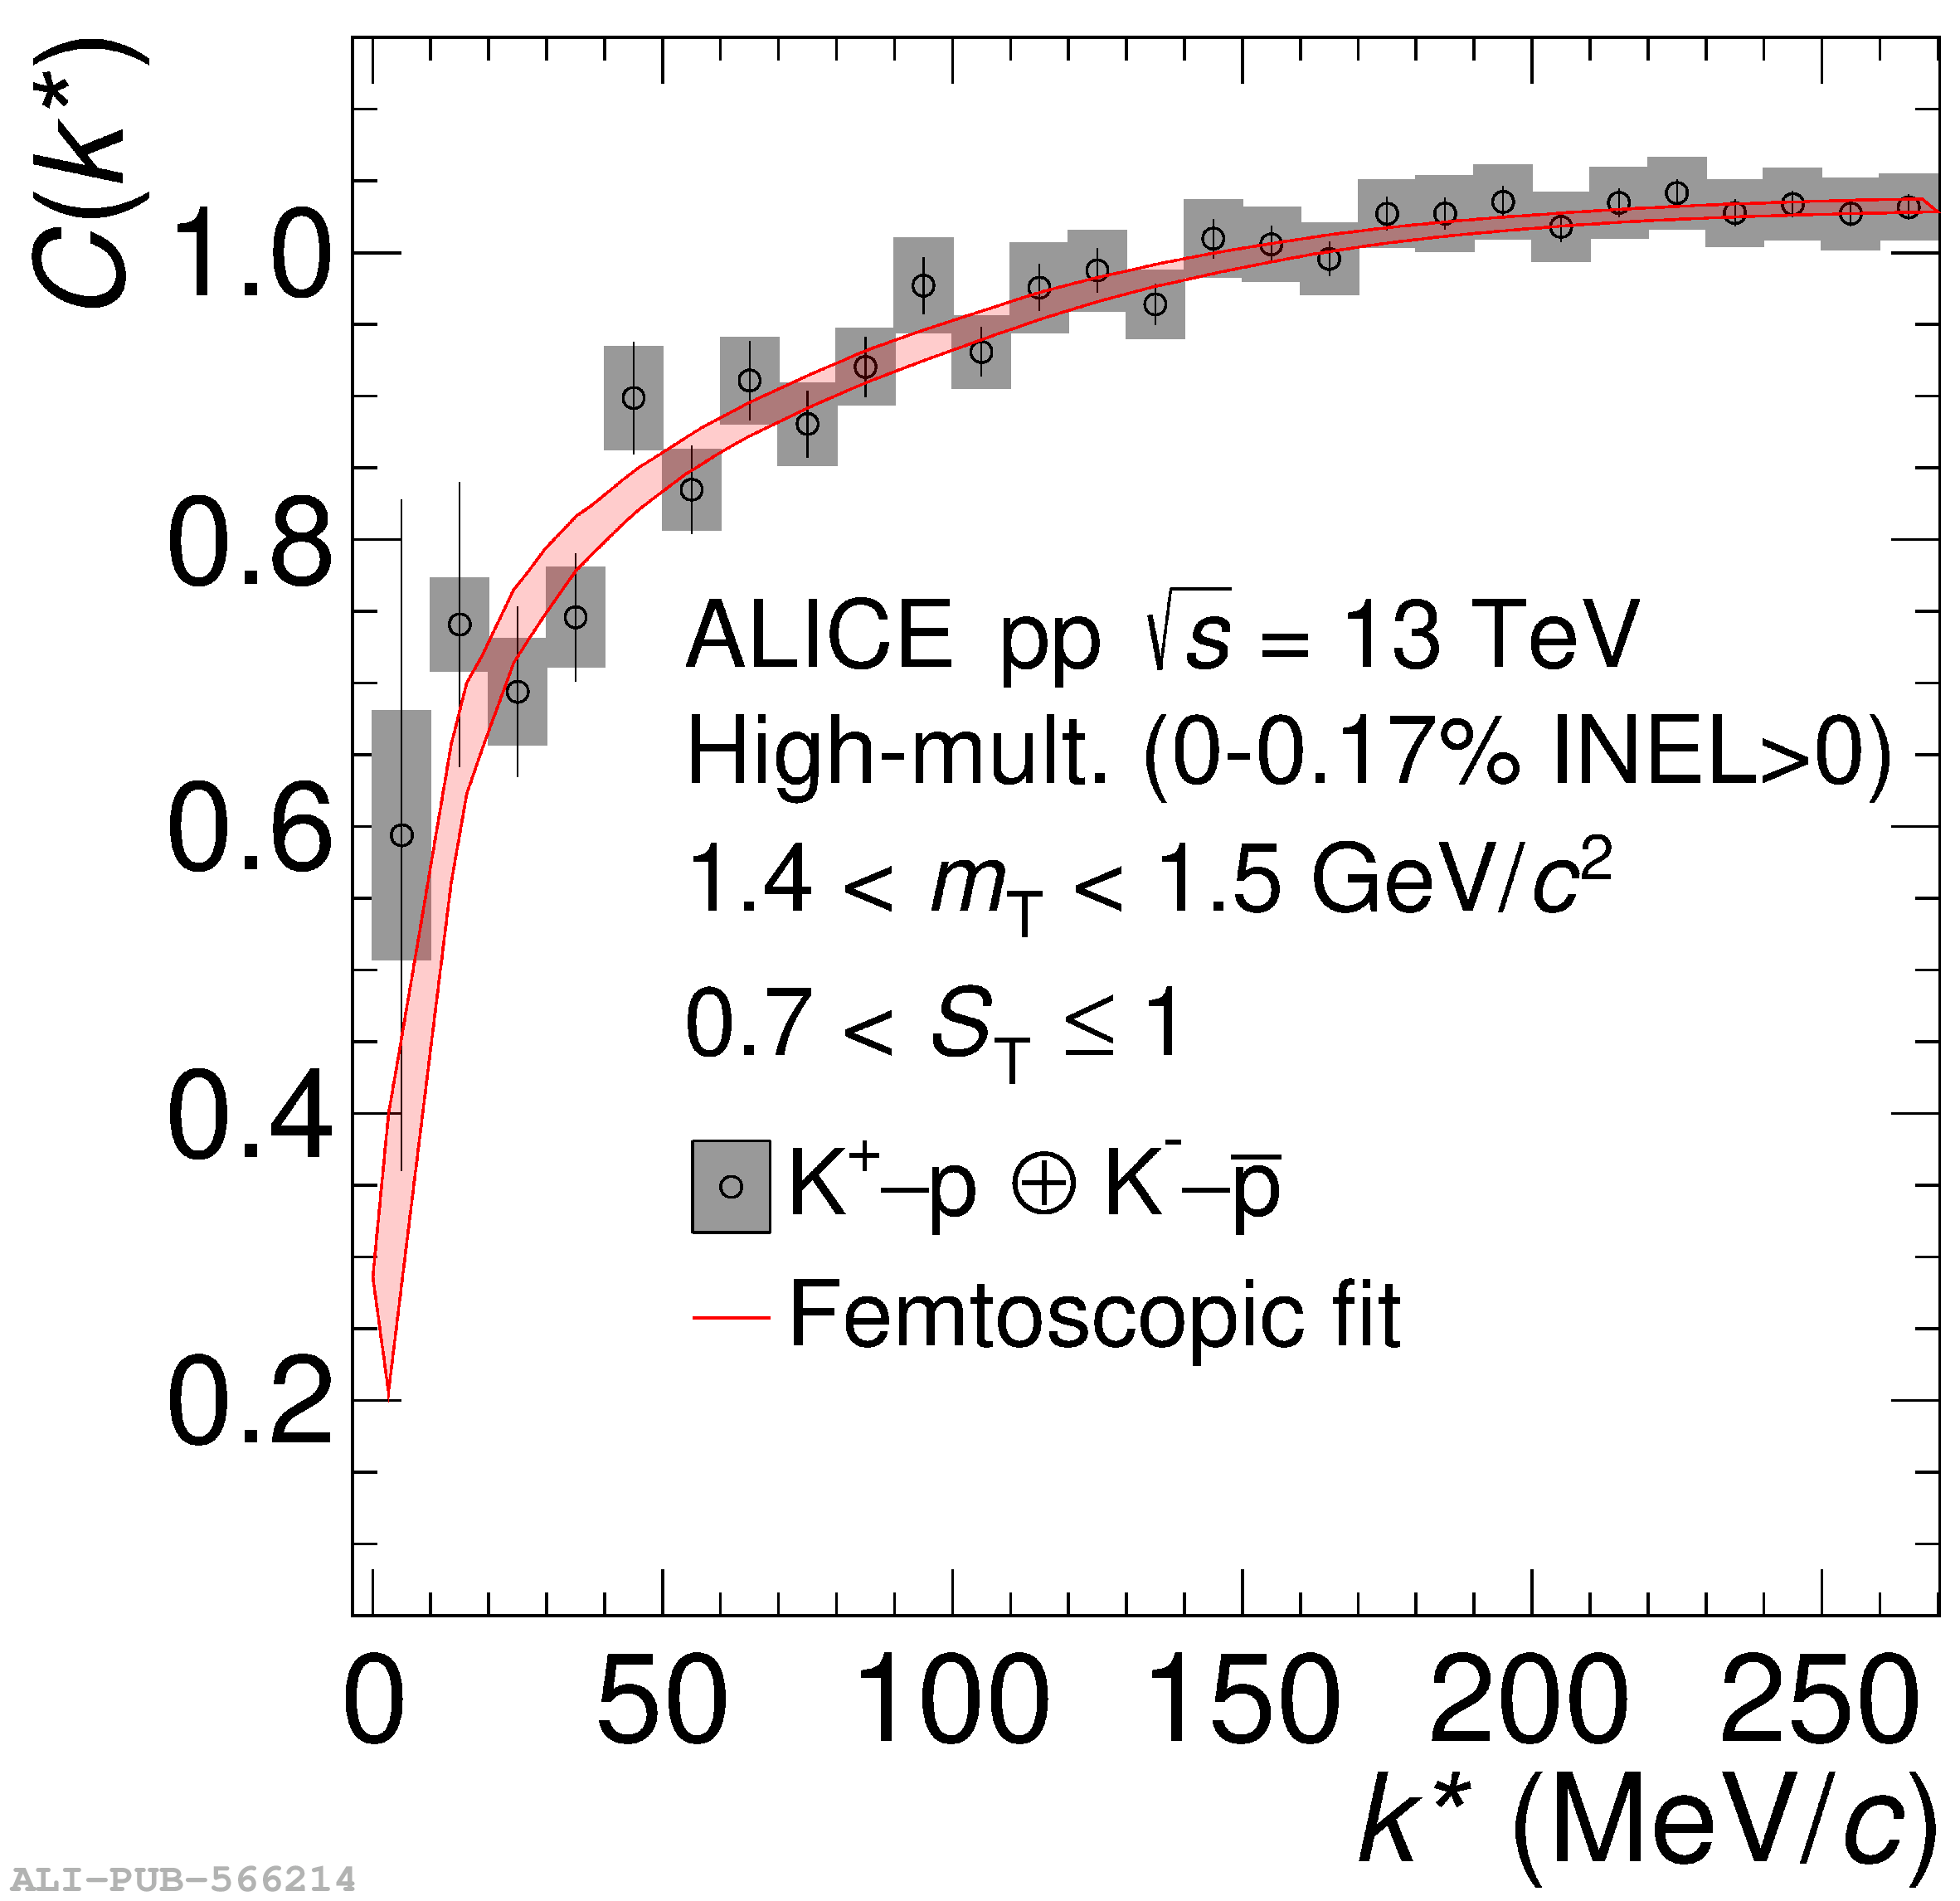 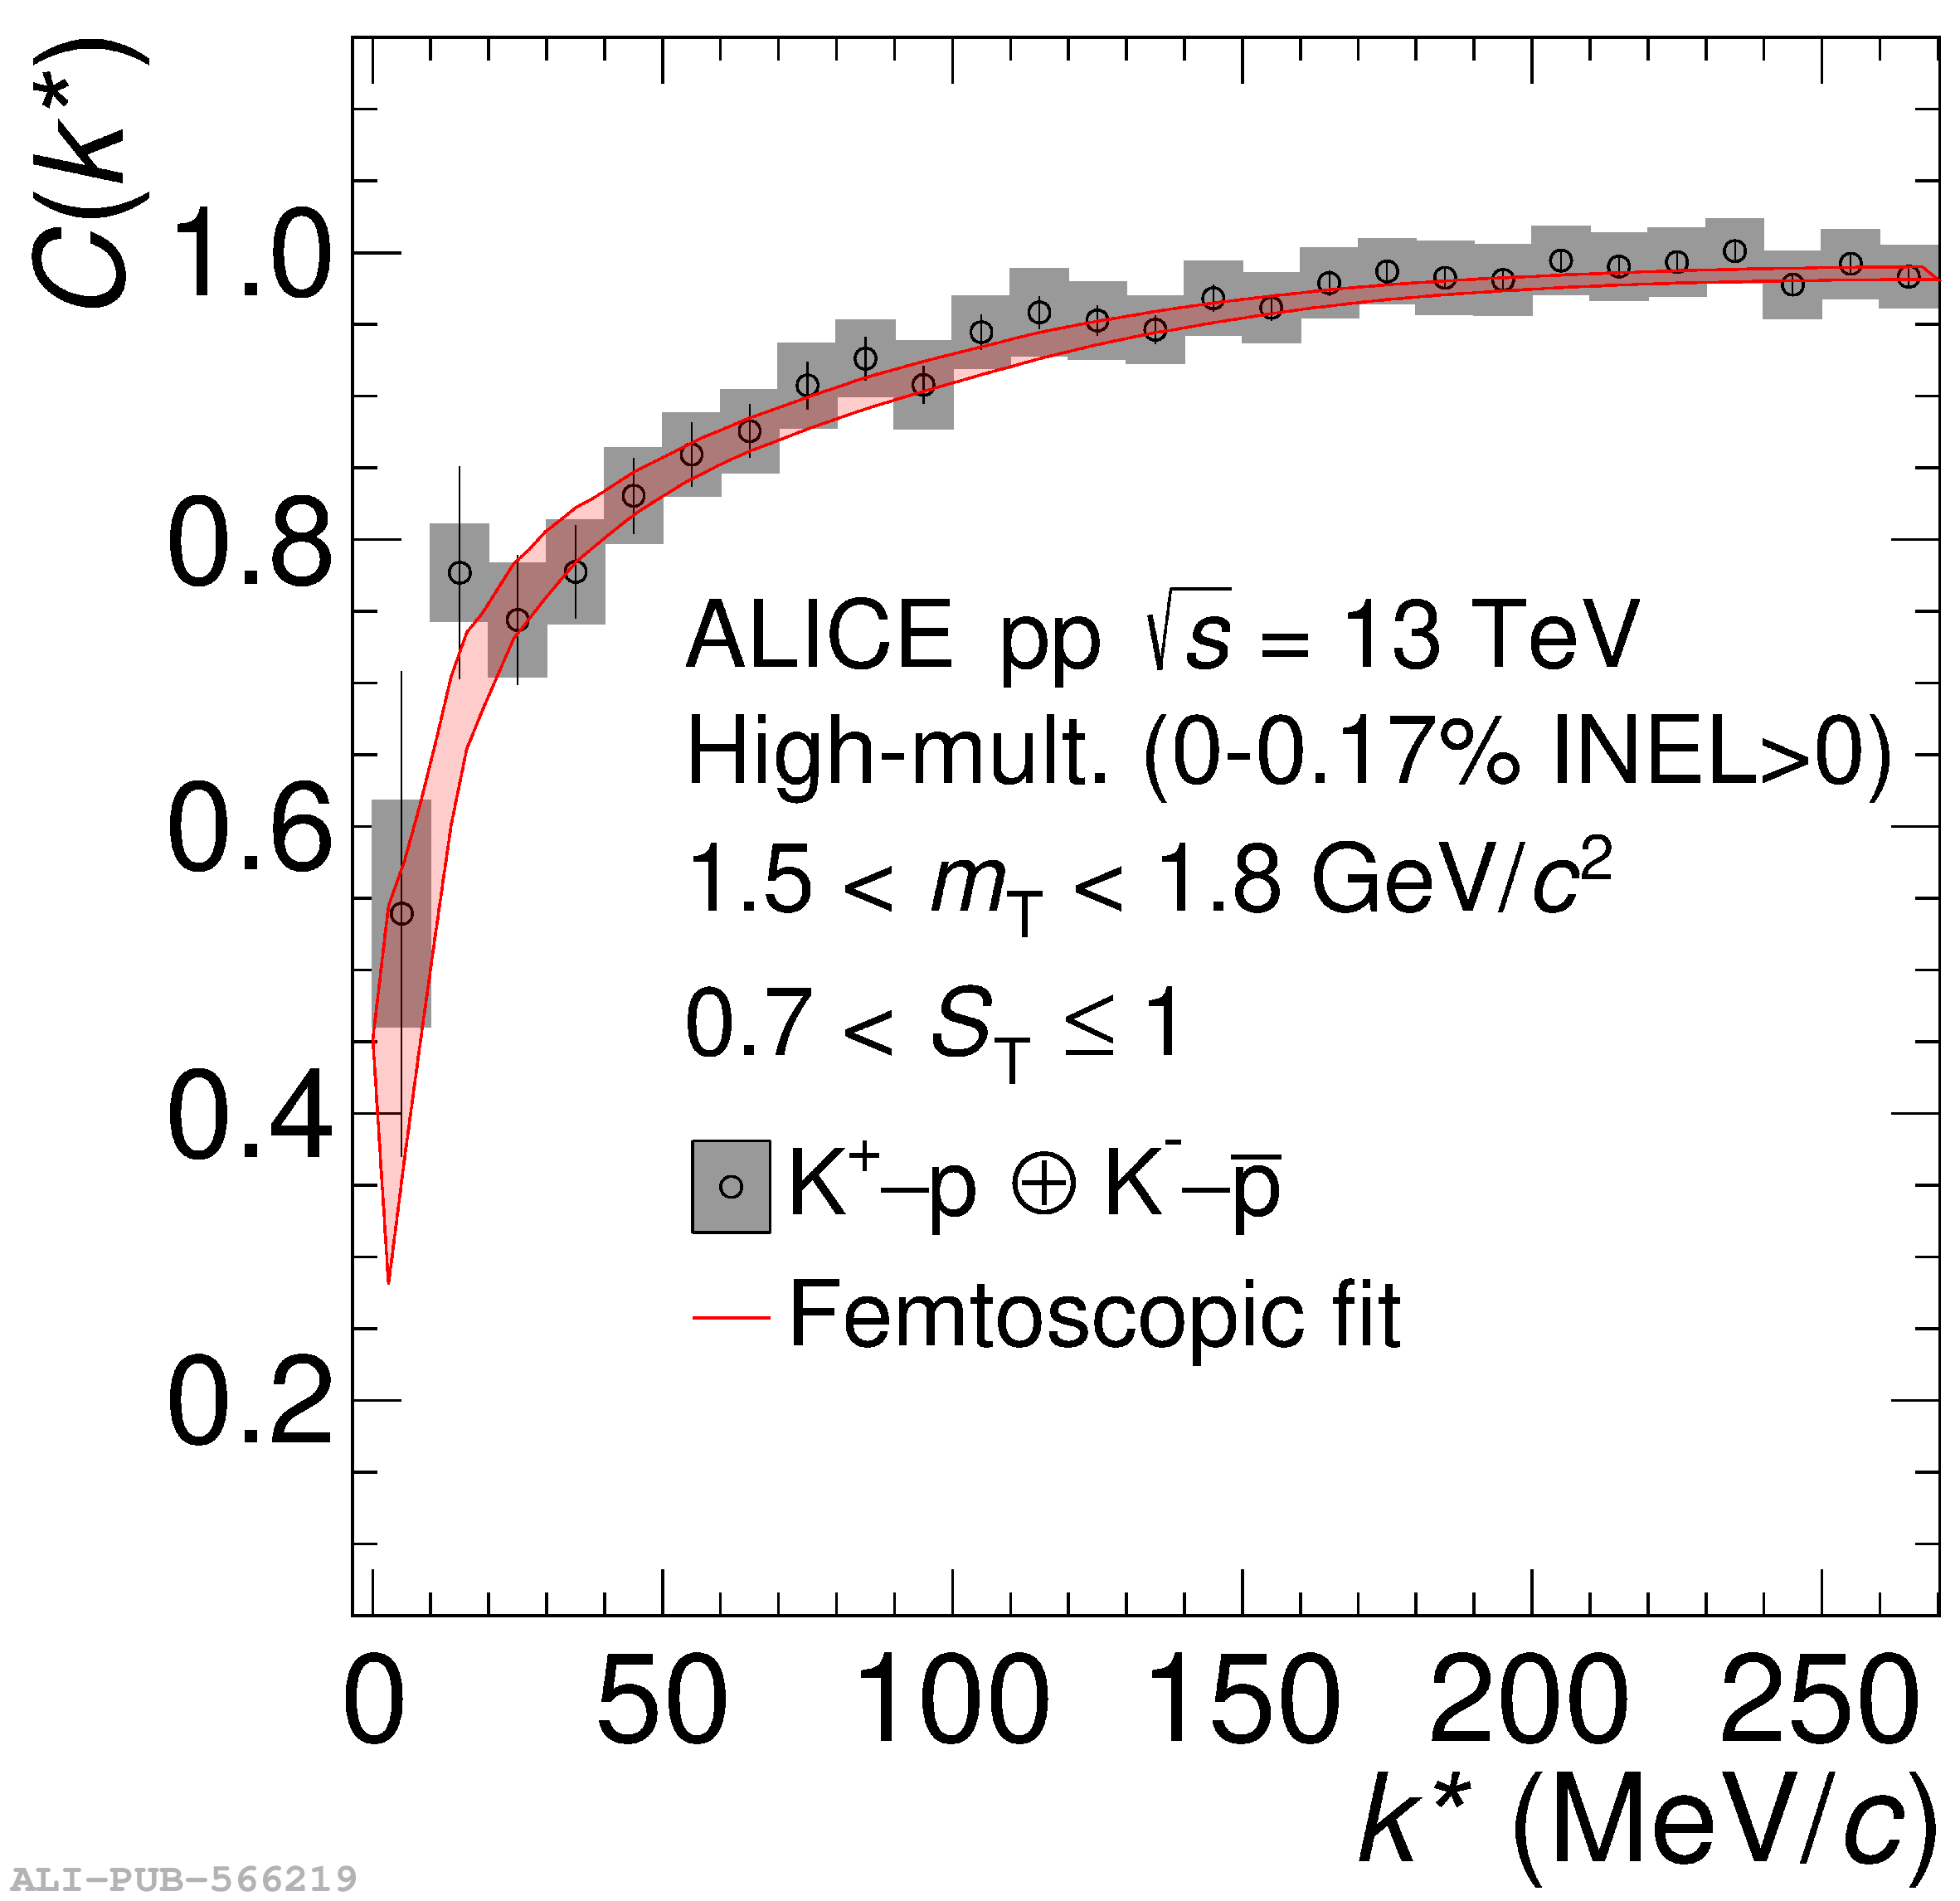 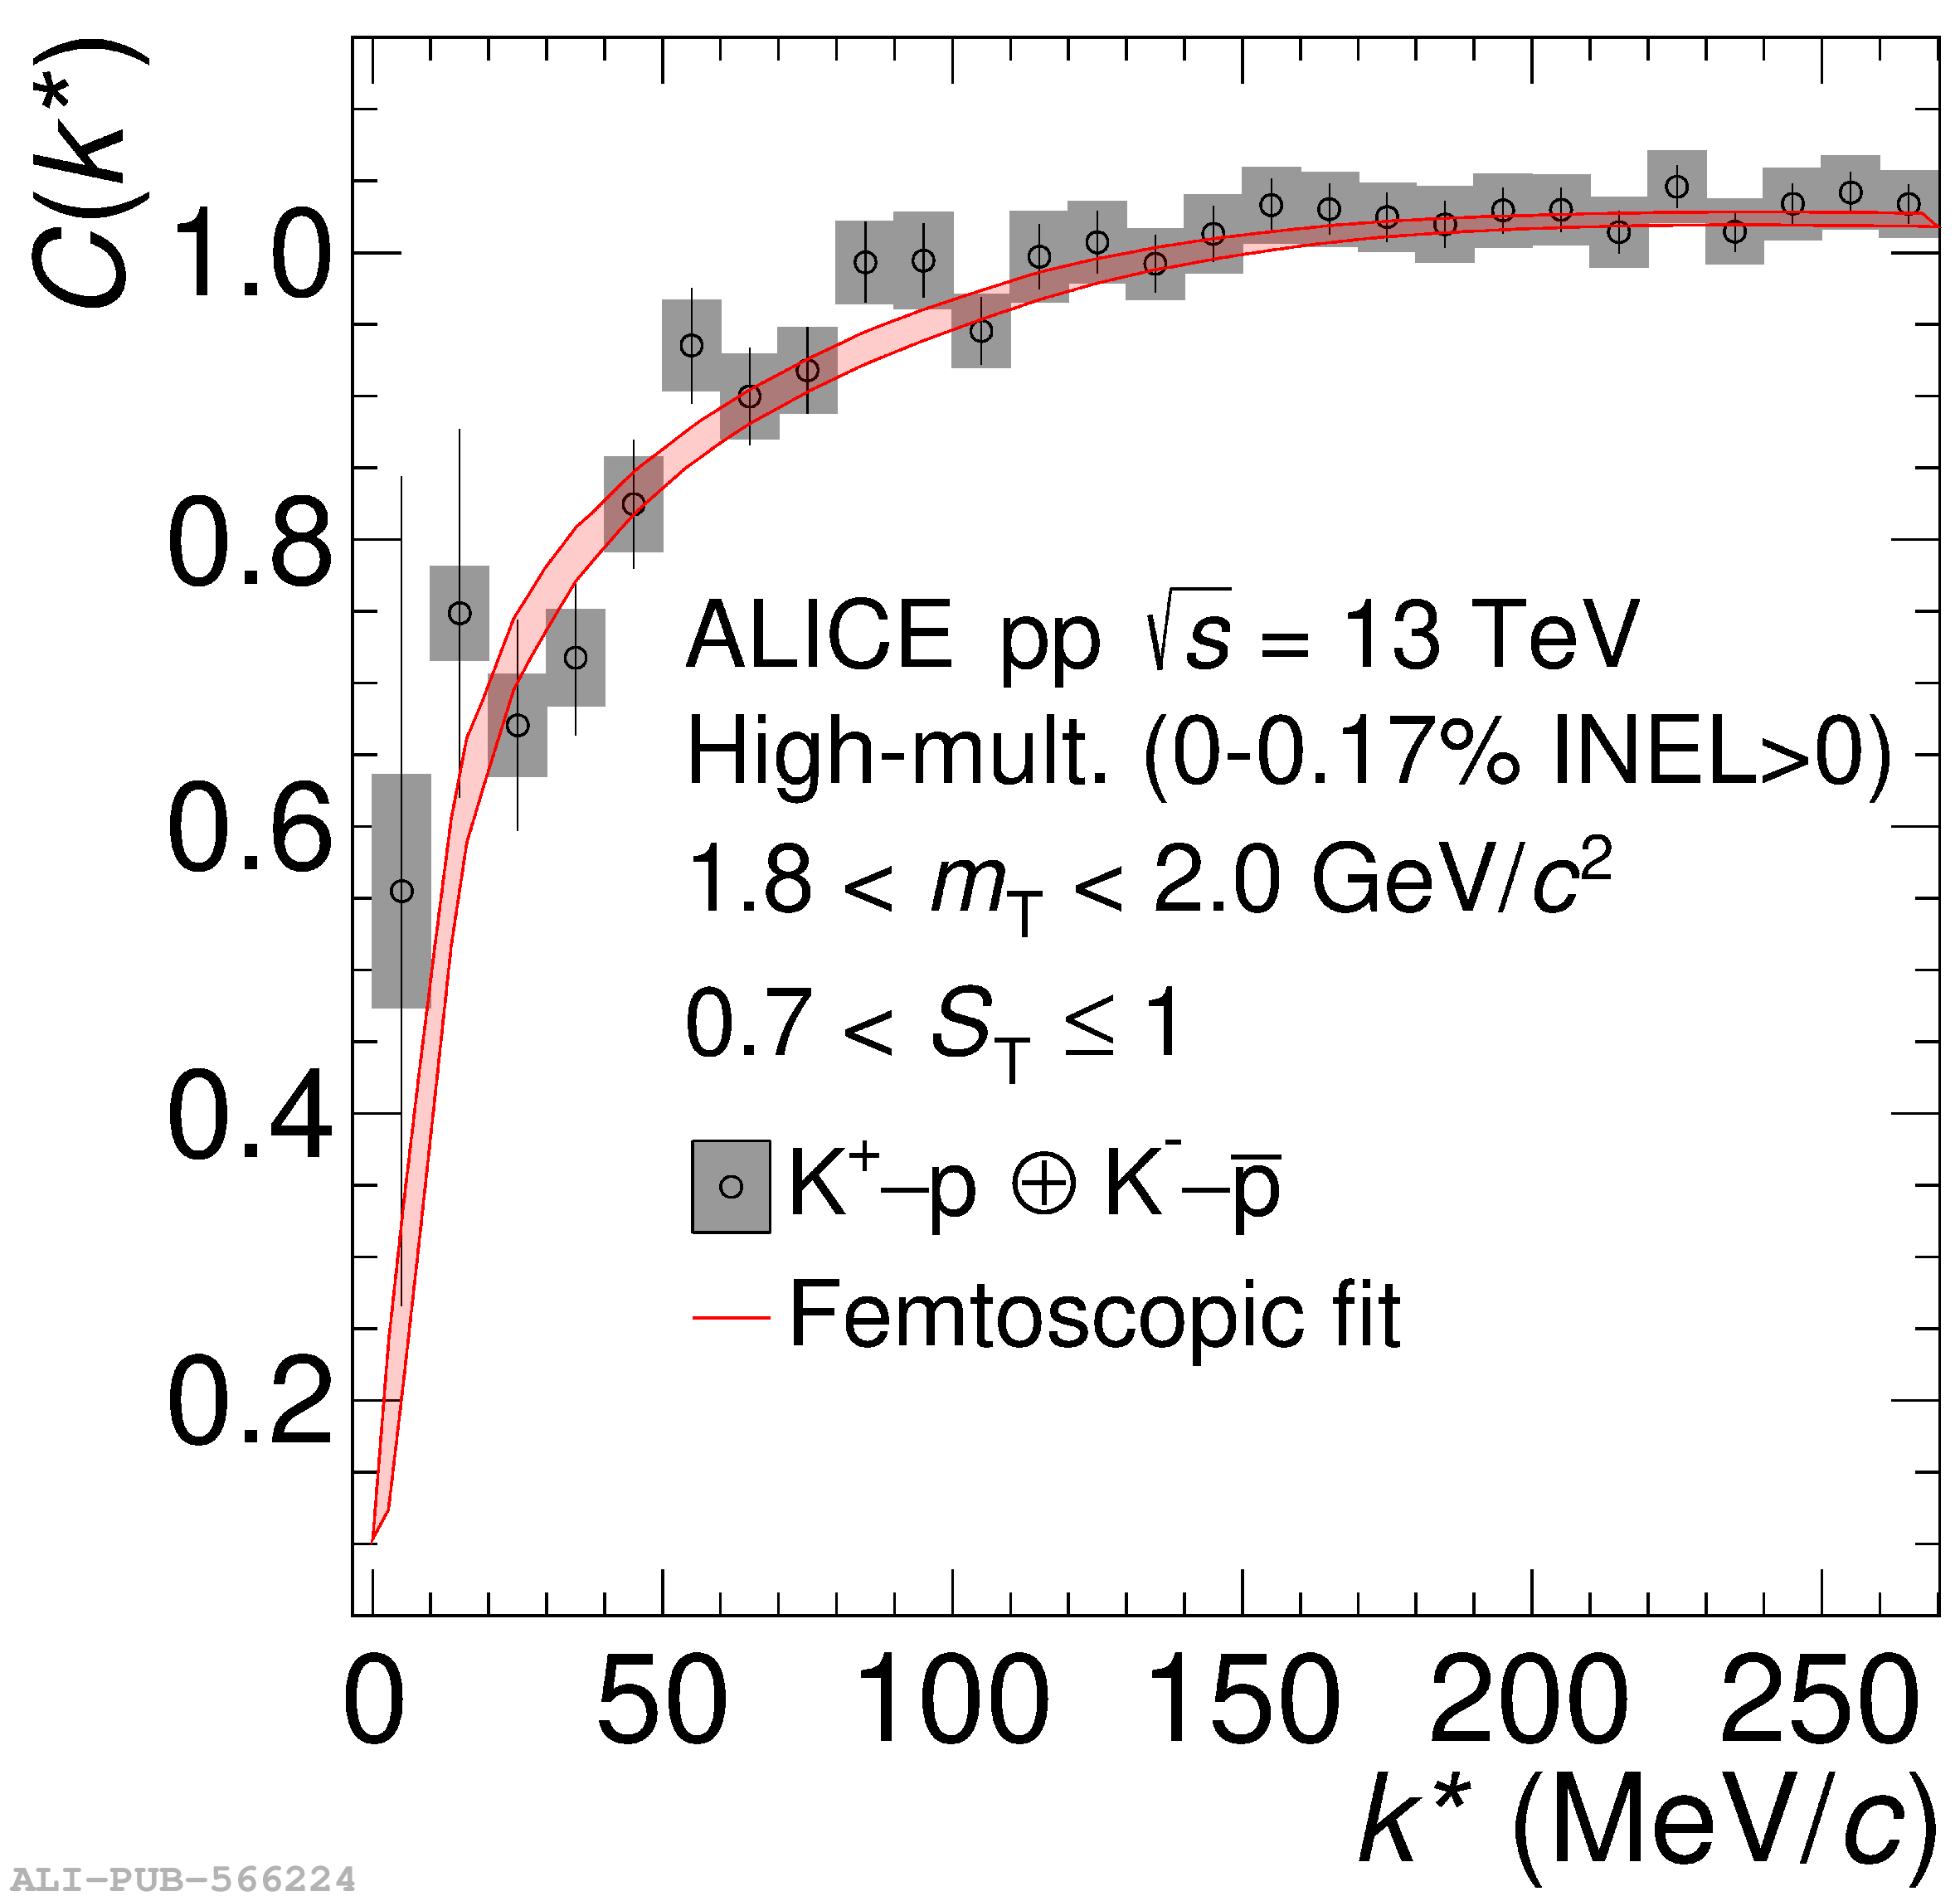 |