Correlation function of \spipi pairs in the fourth (0.70--0.90 \GeVc) \kt interval for HM collisions, the fits on the left (right) are performed using CATS employing the RSM and assuming a polynomial of first (second) degree as background. The statistical and systematic uncertainties are represented by the bars and rectangles, respectively. The uncertainty bands of the fit function are obtained by employing a bootstrap procedure. | 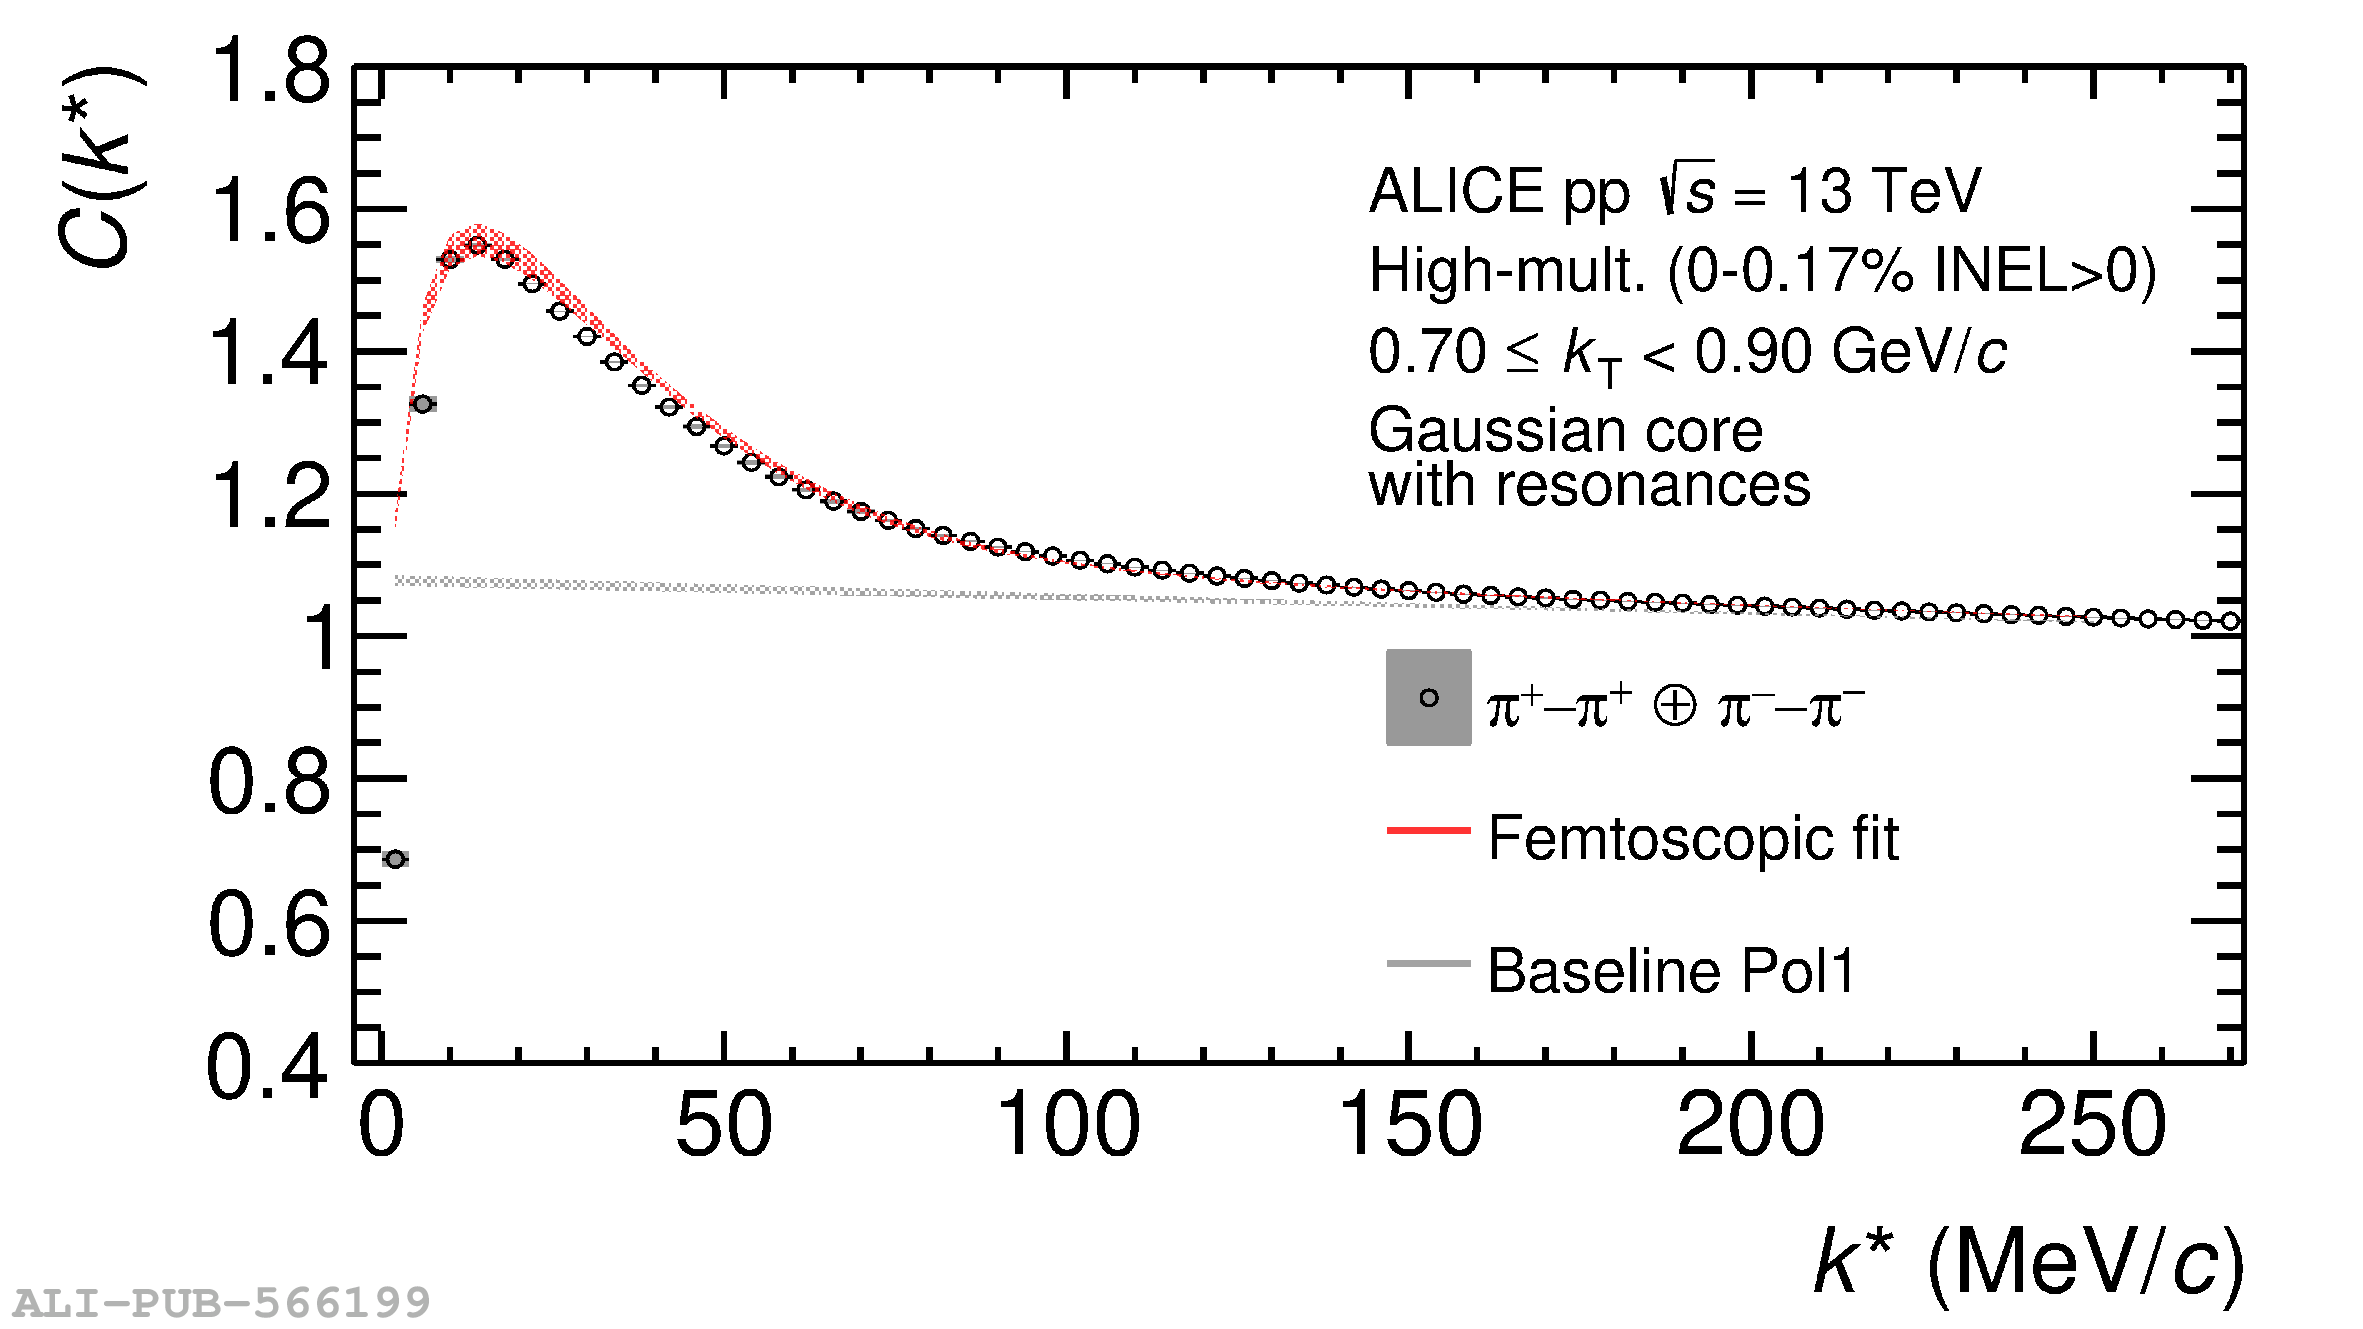 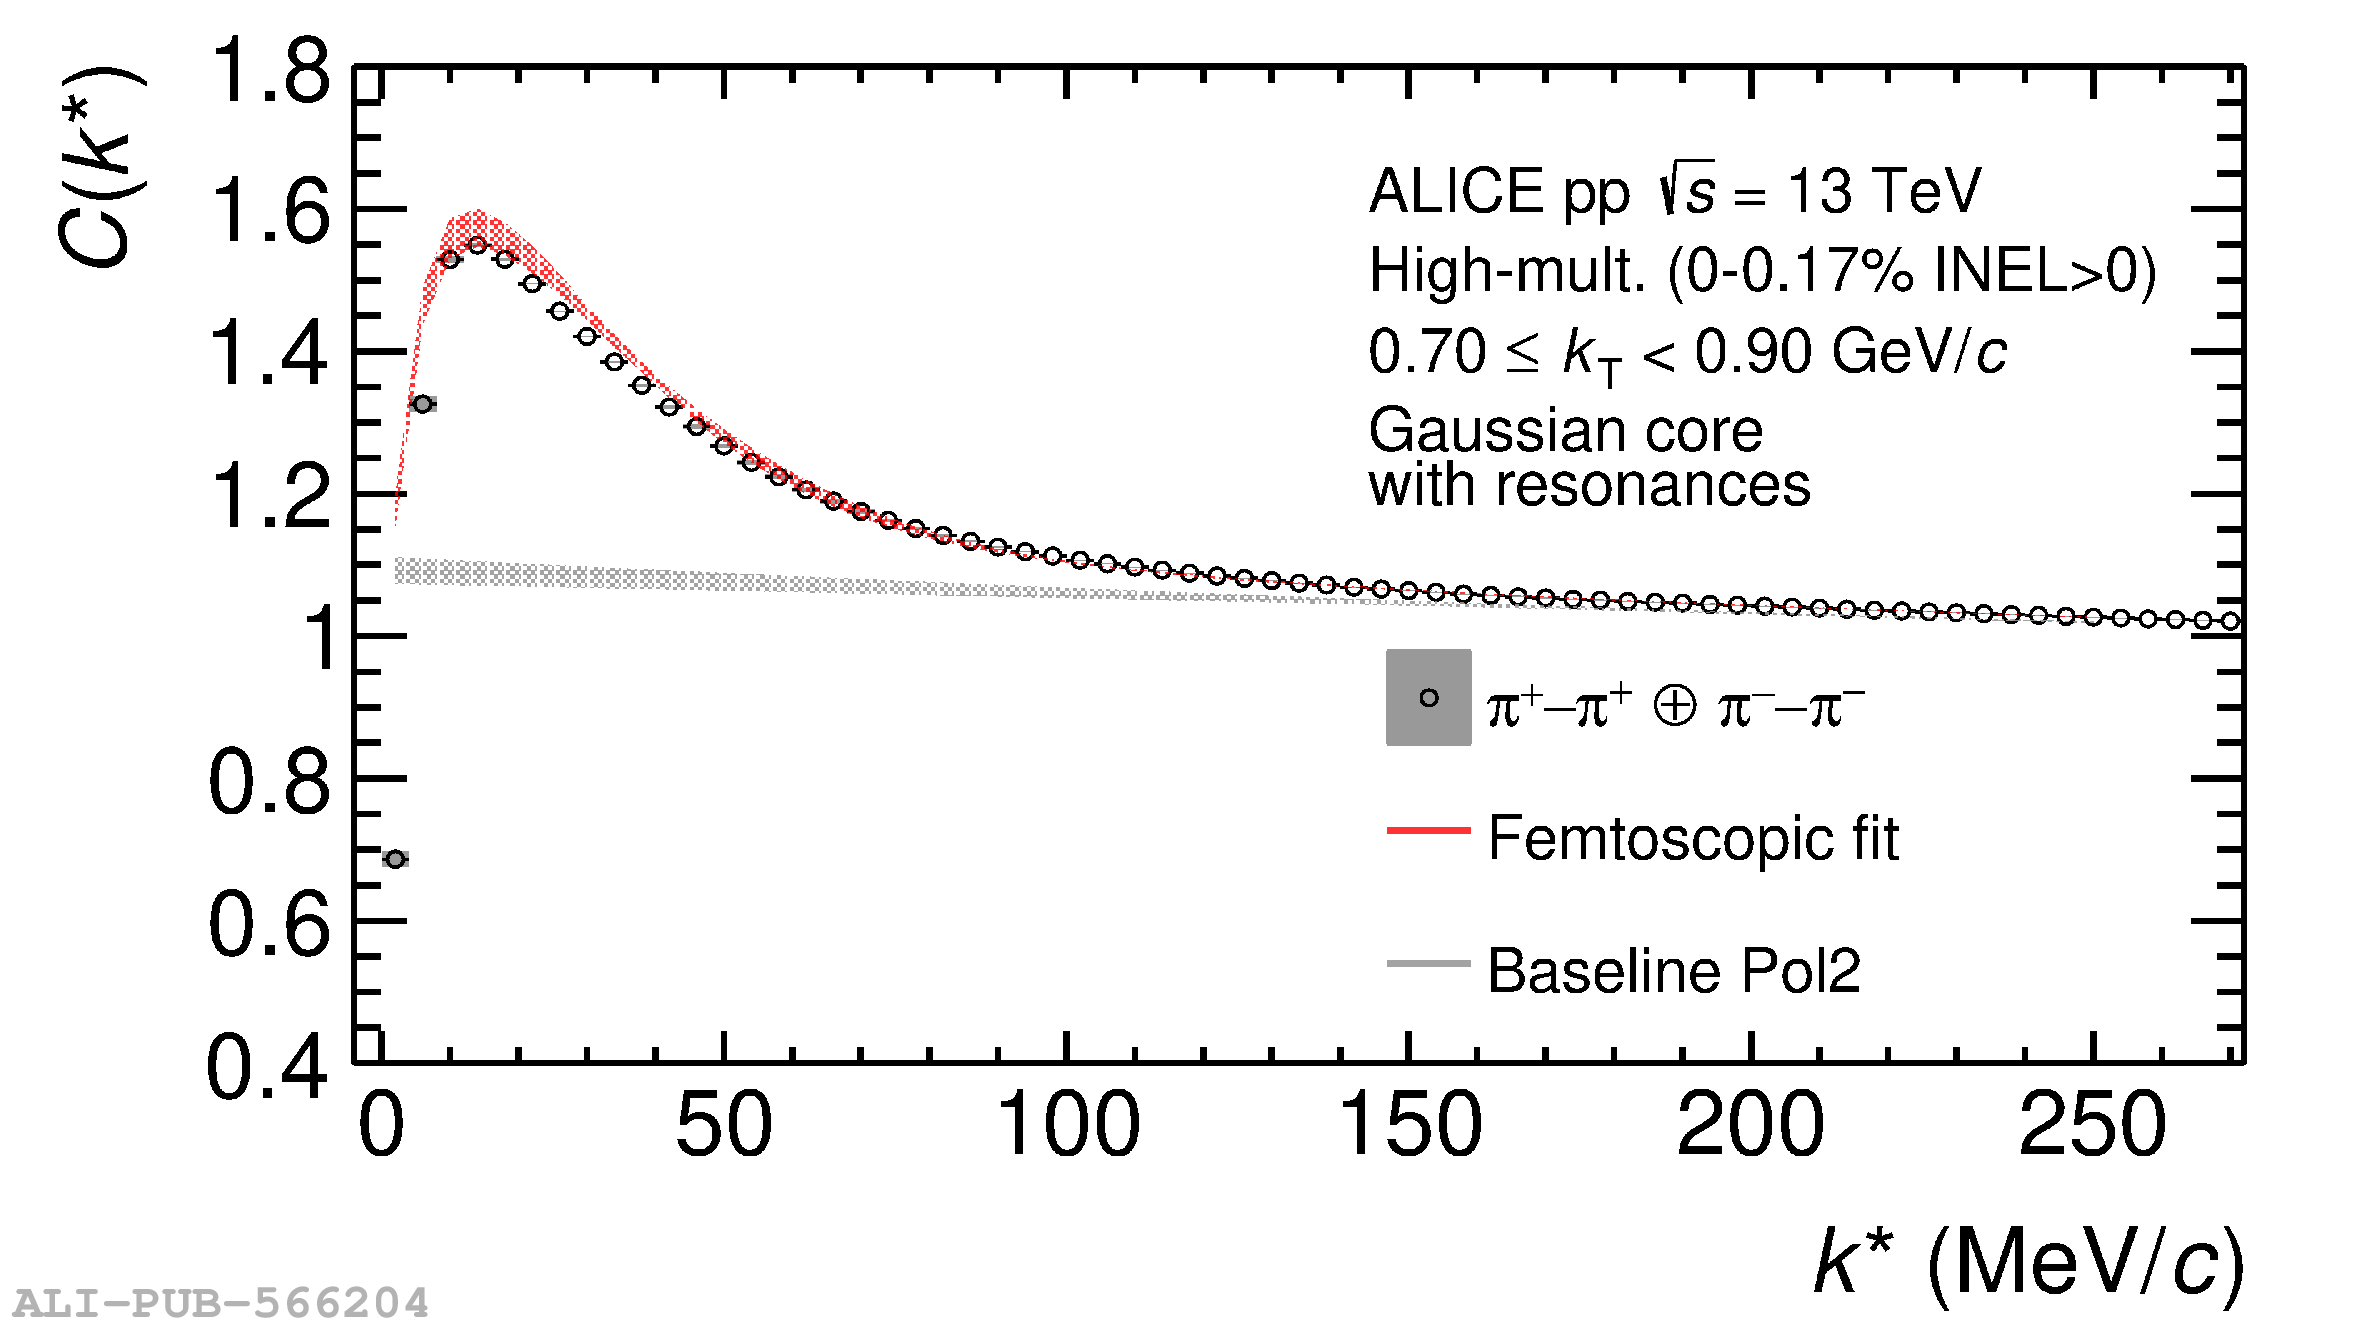 |