Results on the transverse spherocity dependence of light-flavor particle production ($\pi$, K, p, $\phi$, ${\rm K^{*0}}$, ${\rm K}^{0}_{\rm{S}}$, $\Lambda$, $\Xi$) at midrapidity in high-multiplicity pp collisions at $\sqrt{s} = 13$ TeV were obtained with the ALICE apparatus. The transverse spherocity estimator ($S_{{\rm O}}^{{\it p}_{\rm T}=1}$) categorizes events by their azimuthal topology. Utilizing narrow selections on $S_{\text{O}}^{{\it p}_{\rm T}=1}$, it is possible to contrast particle production in collisions dominated by many soft initial interactions with that observed in collisions dominated by one or more hard scatterings. Results are reported for two multiplicity estimators covering different pseudorapidity regions. The $S_{{\rm O}}^{{\it p}_{\rm T}=1}$ estimator is found to effectively constrain the hardness of the events when the midrapidity ($\left | \eta \right |<~ 0.8$) estimator is used. The production rates of strange particles are found to be slightly higher for soft isotropic topologies, and severely suppressed in hard jet-like topologies. These effects are more pronounced for hadrons with larger mass and strangeness content, and observed when the topological selection is done within a narrow multiplicity interval. This demonstrates that an important aspect of the universal scaling of strangeness enhancement with final-state multiplicity is that high-multiplicity collisions are dominated by soft, isotropic processes. On the contrary, strangeness production in events with jet-like processes is significantly reduced. The results presented in this article are compared with several QCD-inspired Monte Carlo event generators. Models that incorporate a two-component phenomenology, either through mechanisms accounting for string density, or thermal production, are able to describe the observed strangeness enhancement as a function of $S_{{\rm O}}^{{\it p}_{\rm T}=1}$.
JHEP 05 (2024) 184
HEP Data
e-Print: arXiv:2310.10236 | PDF | inSPIRE
CERN-EP-2023-215
Figure group
Figure 1
Upper panels: The measured and fully corrected $S_0^{p_{\rm T}=1}$ distributions. Lower panels: Ratio between model calculations and experimental data. These are presented for $N_{\rm tracklets}^{|\eta|< 0.8}$ I (top), I-III (middle) and V0M I (bottom). The roman numerals I (I-III) correspond the top 0--1\% (0--10\%) multiplicity for each respective estimator. The curves represent different model predictions, where the shaded area represents the statistical uncertainty of the models. The relative systematic uncertainty is shown as a gray area around unity in the lower panels. | 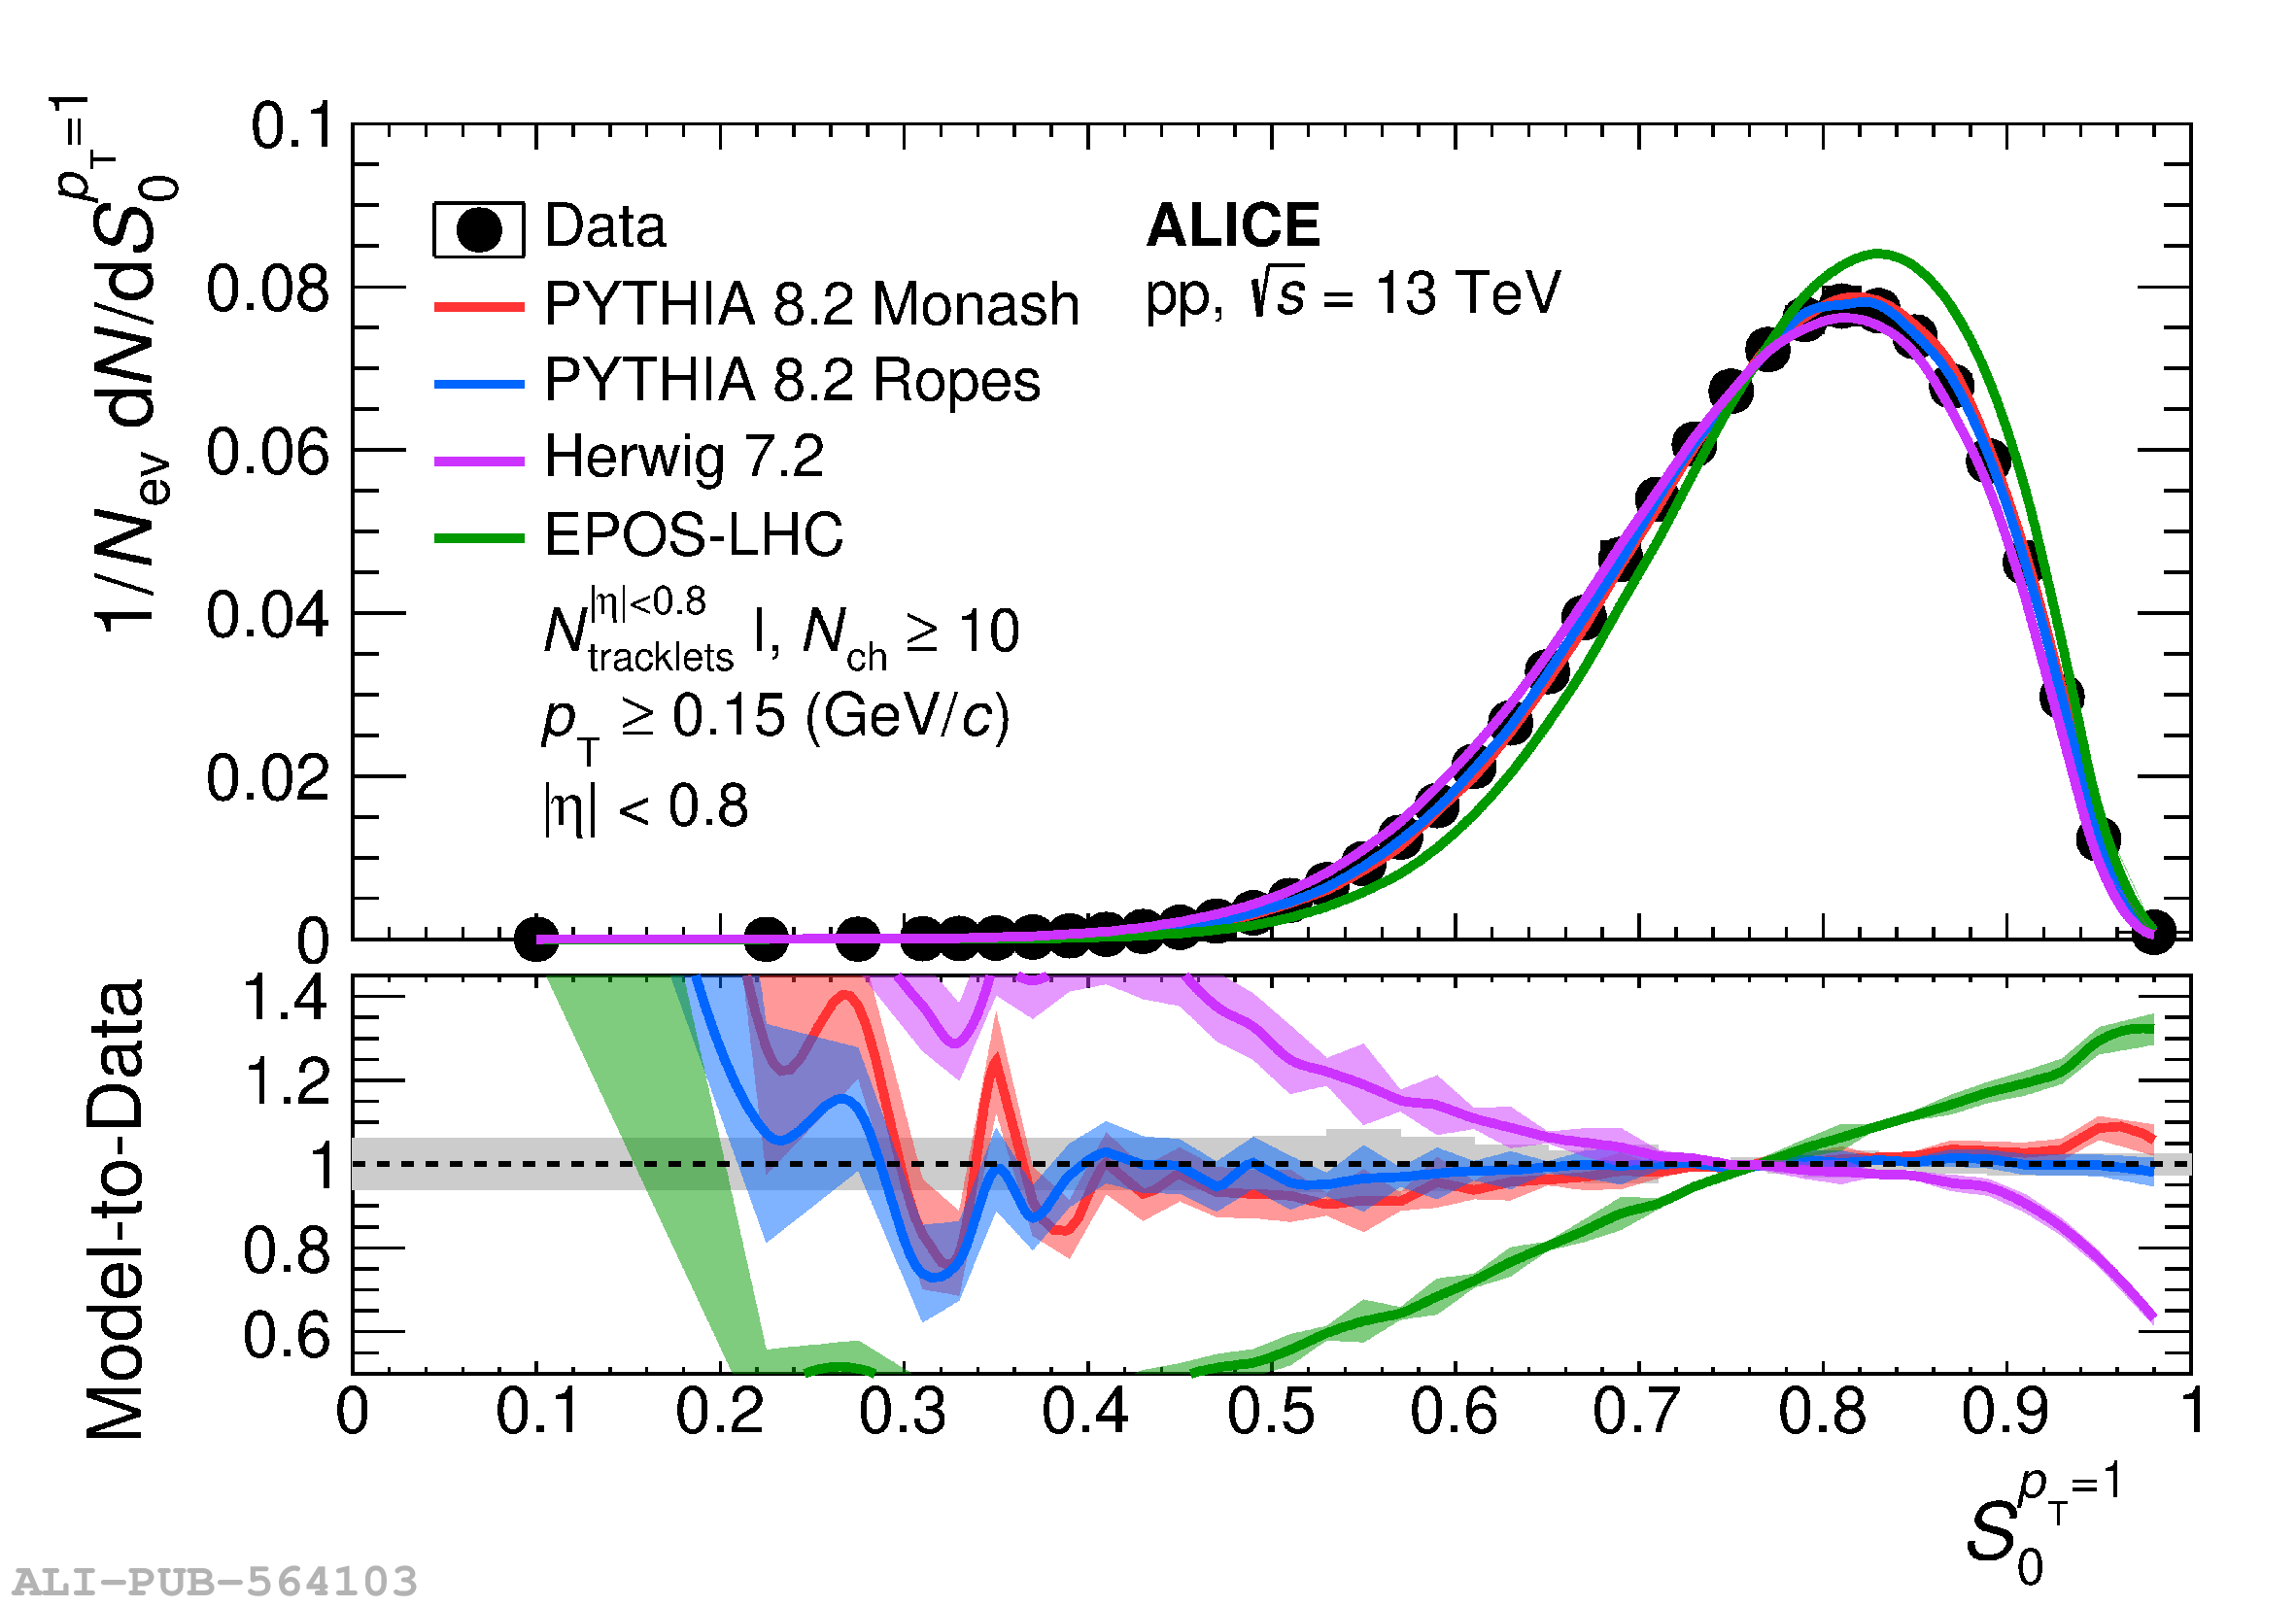 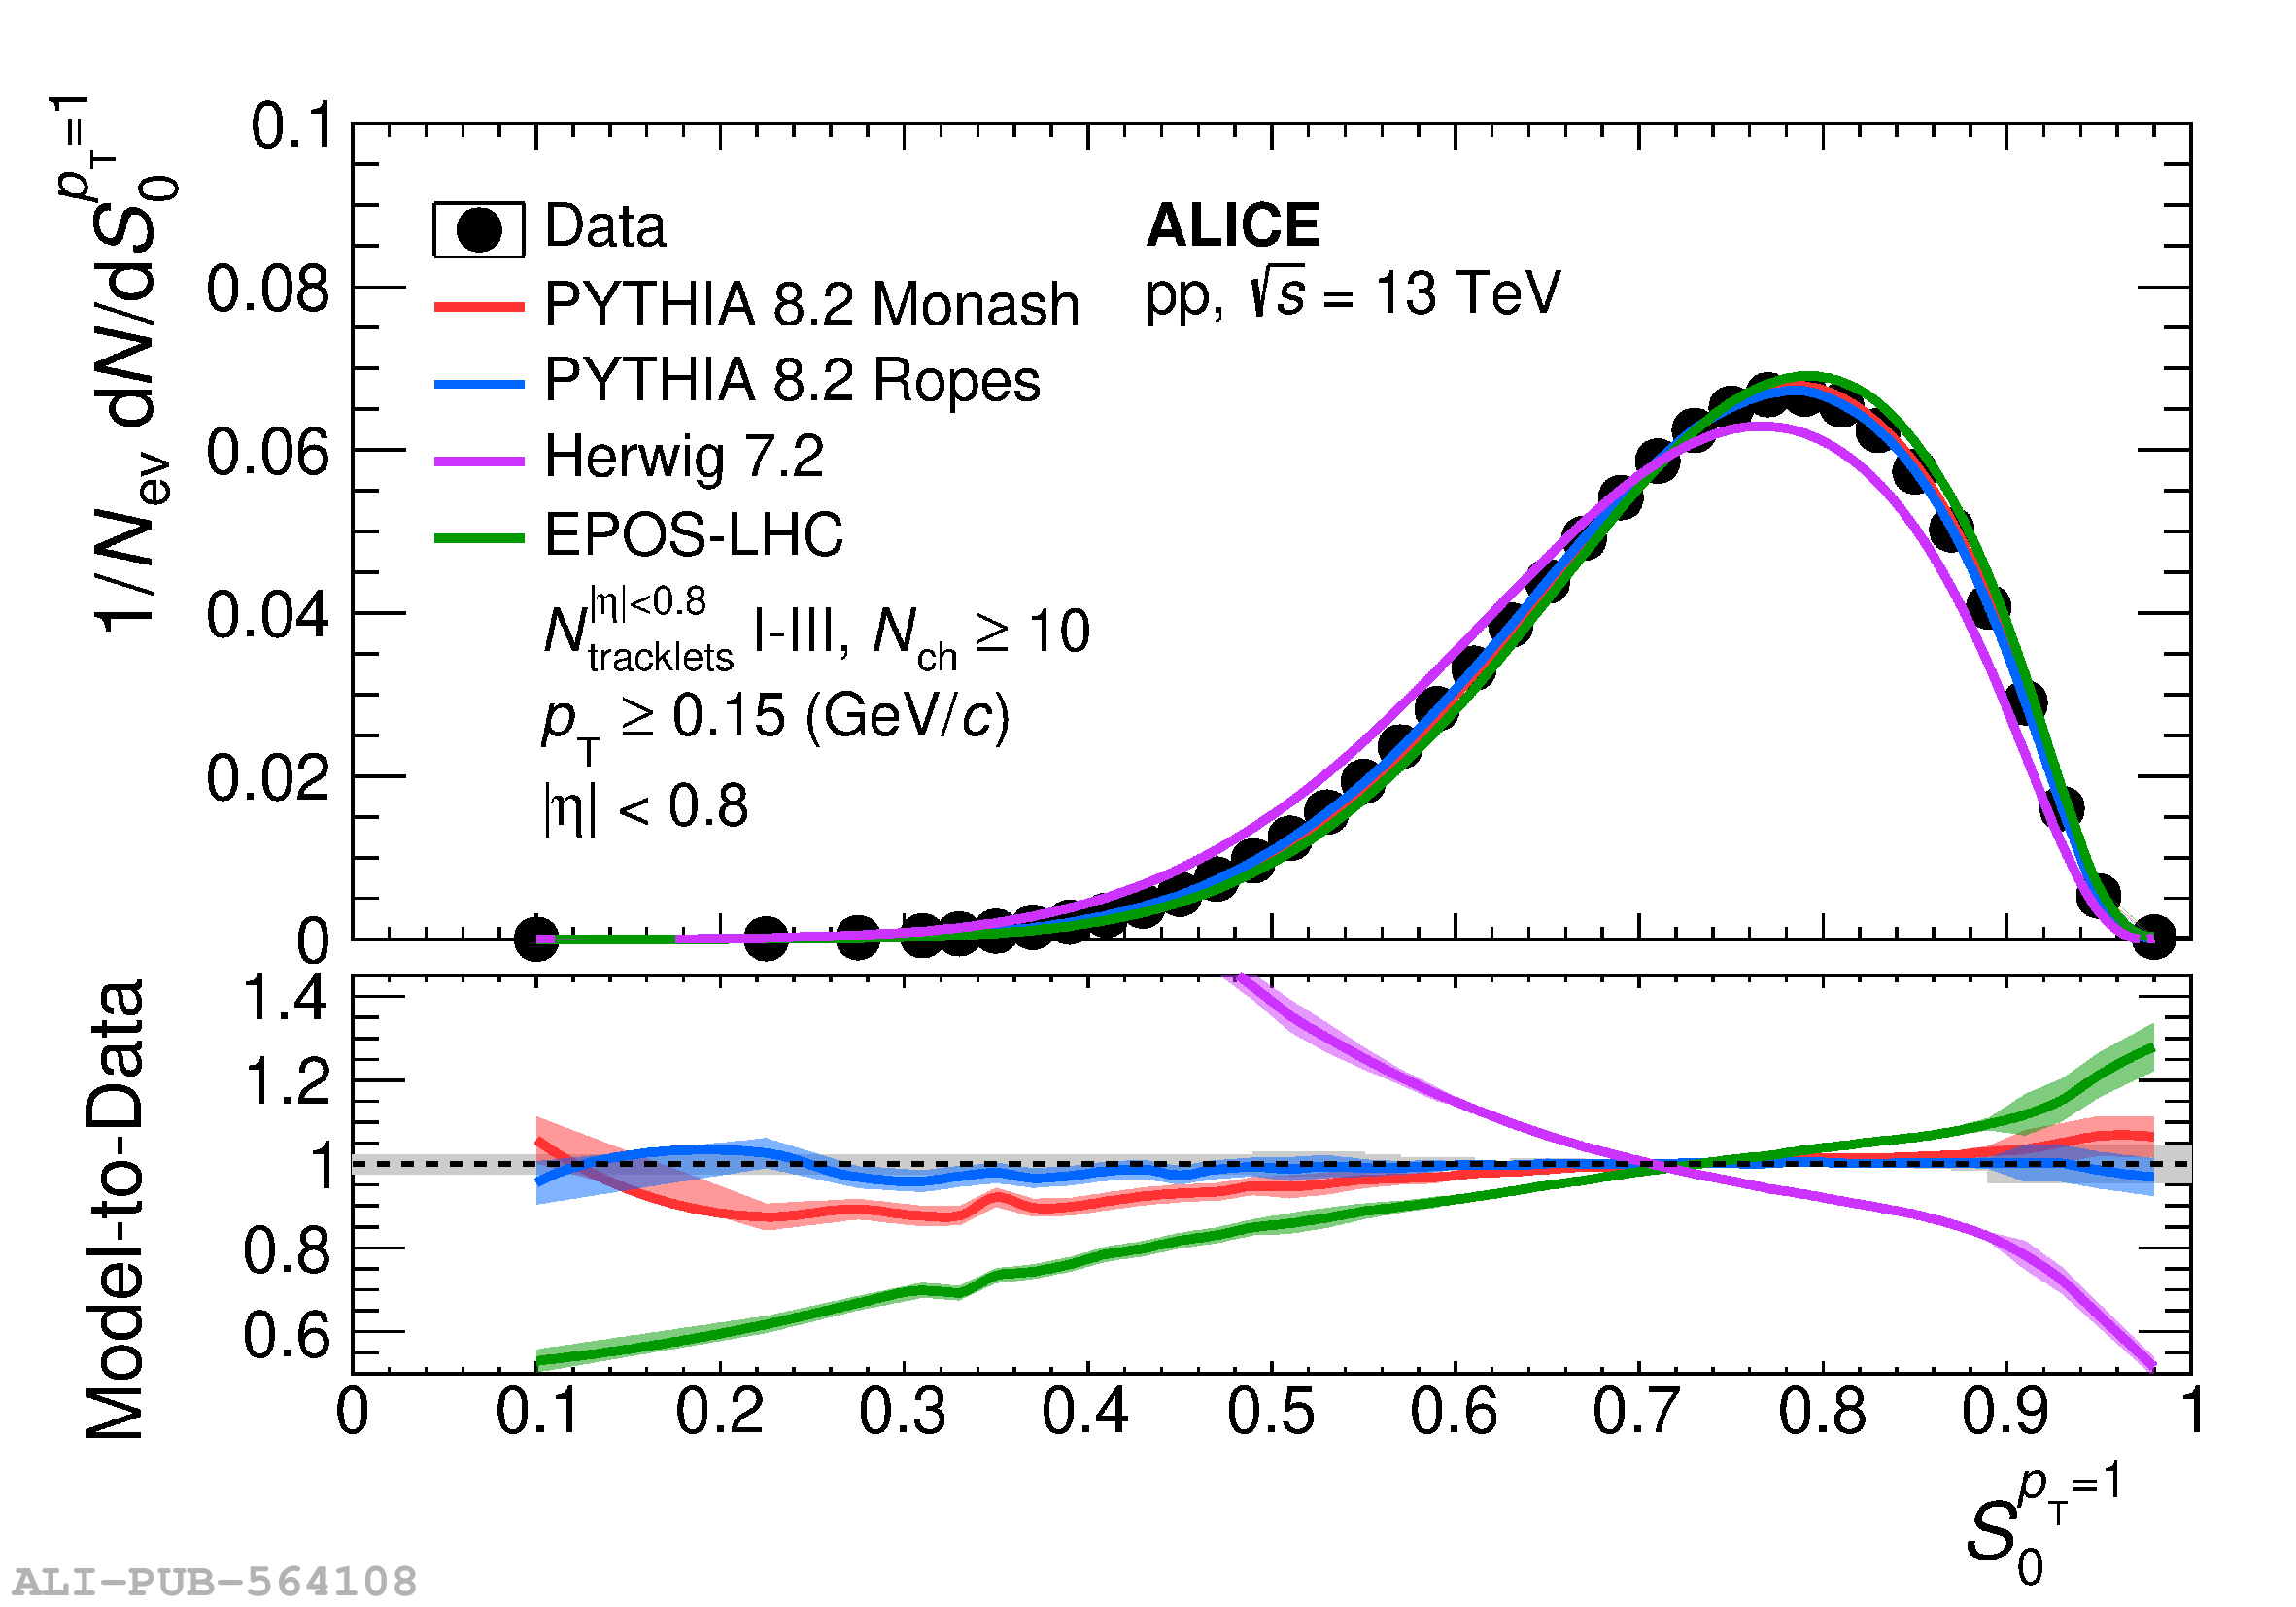 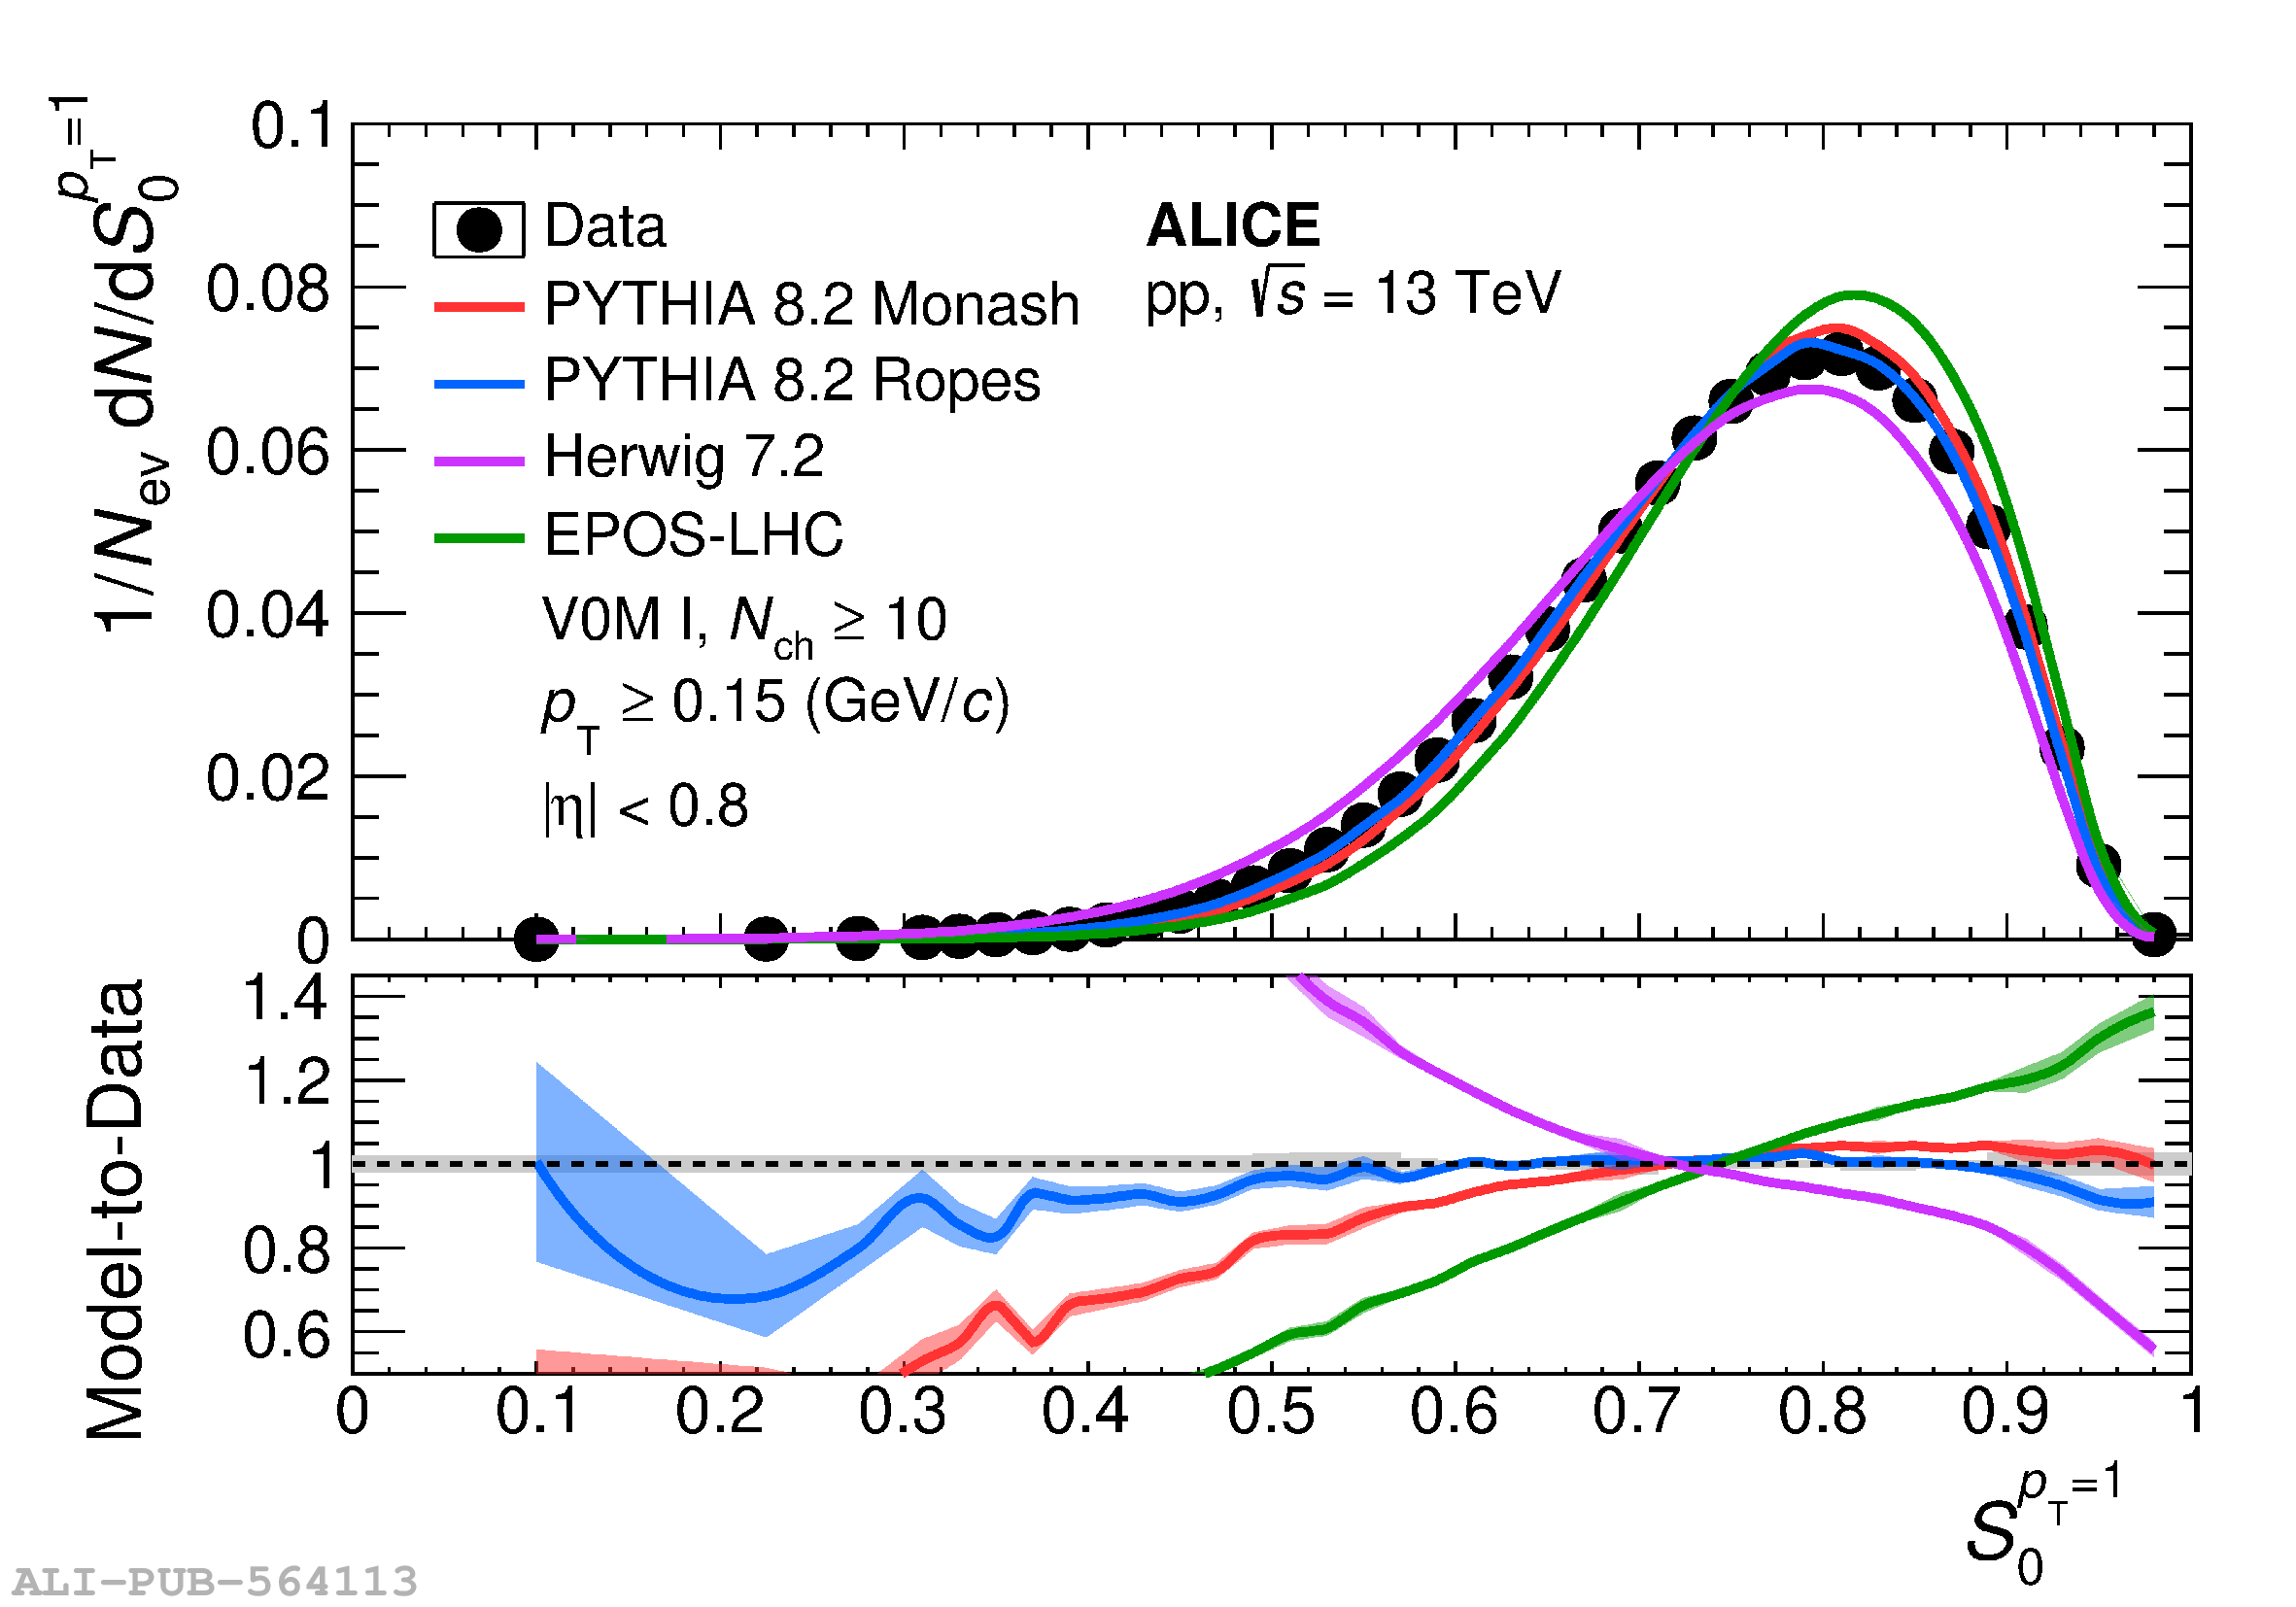 |
Figure 2
Correlation between $\langle p_{\rm{T}}\rangle$ and $\langle \rm{d}N_{\pi}/\rm{d}y \rangle$ as a function of $S_0^{p_{\rm T}=1}$, in the 0--10\% and 0--1\% V0M and $N_{\rm tracklet}^{|\eta|< 0.8}$ multiplicity classes. The total systematic uncertainties are represented by empty boxes. The statistical uncertainty is smaller than the reported marker sizes. | 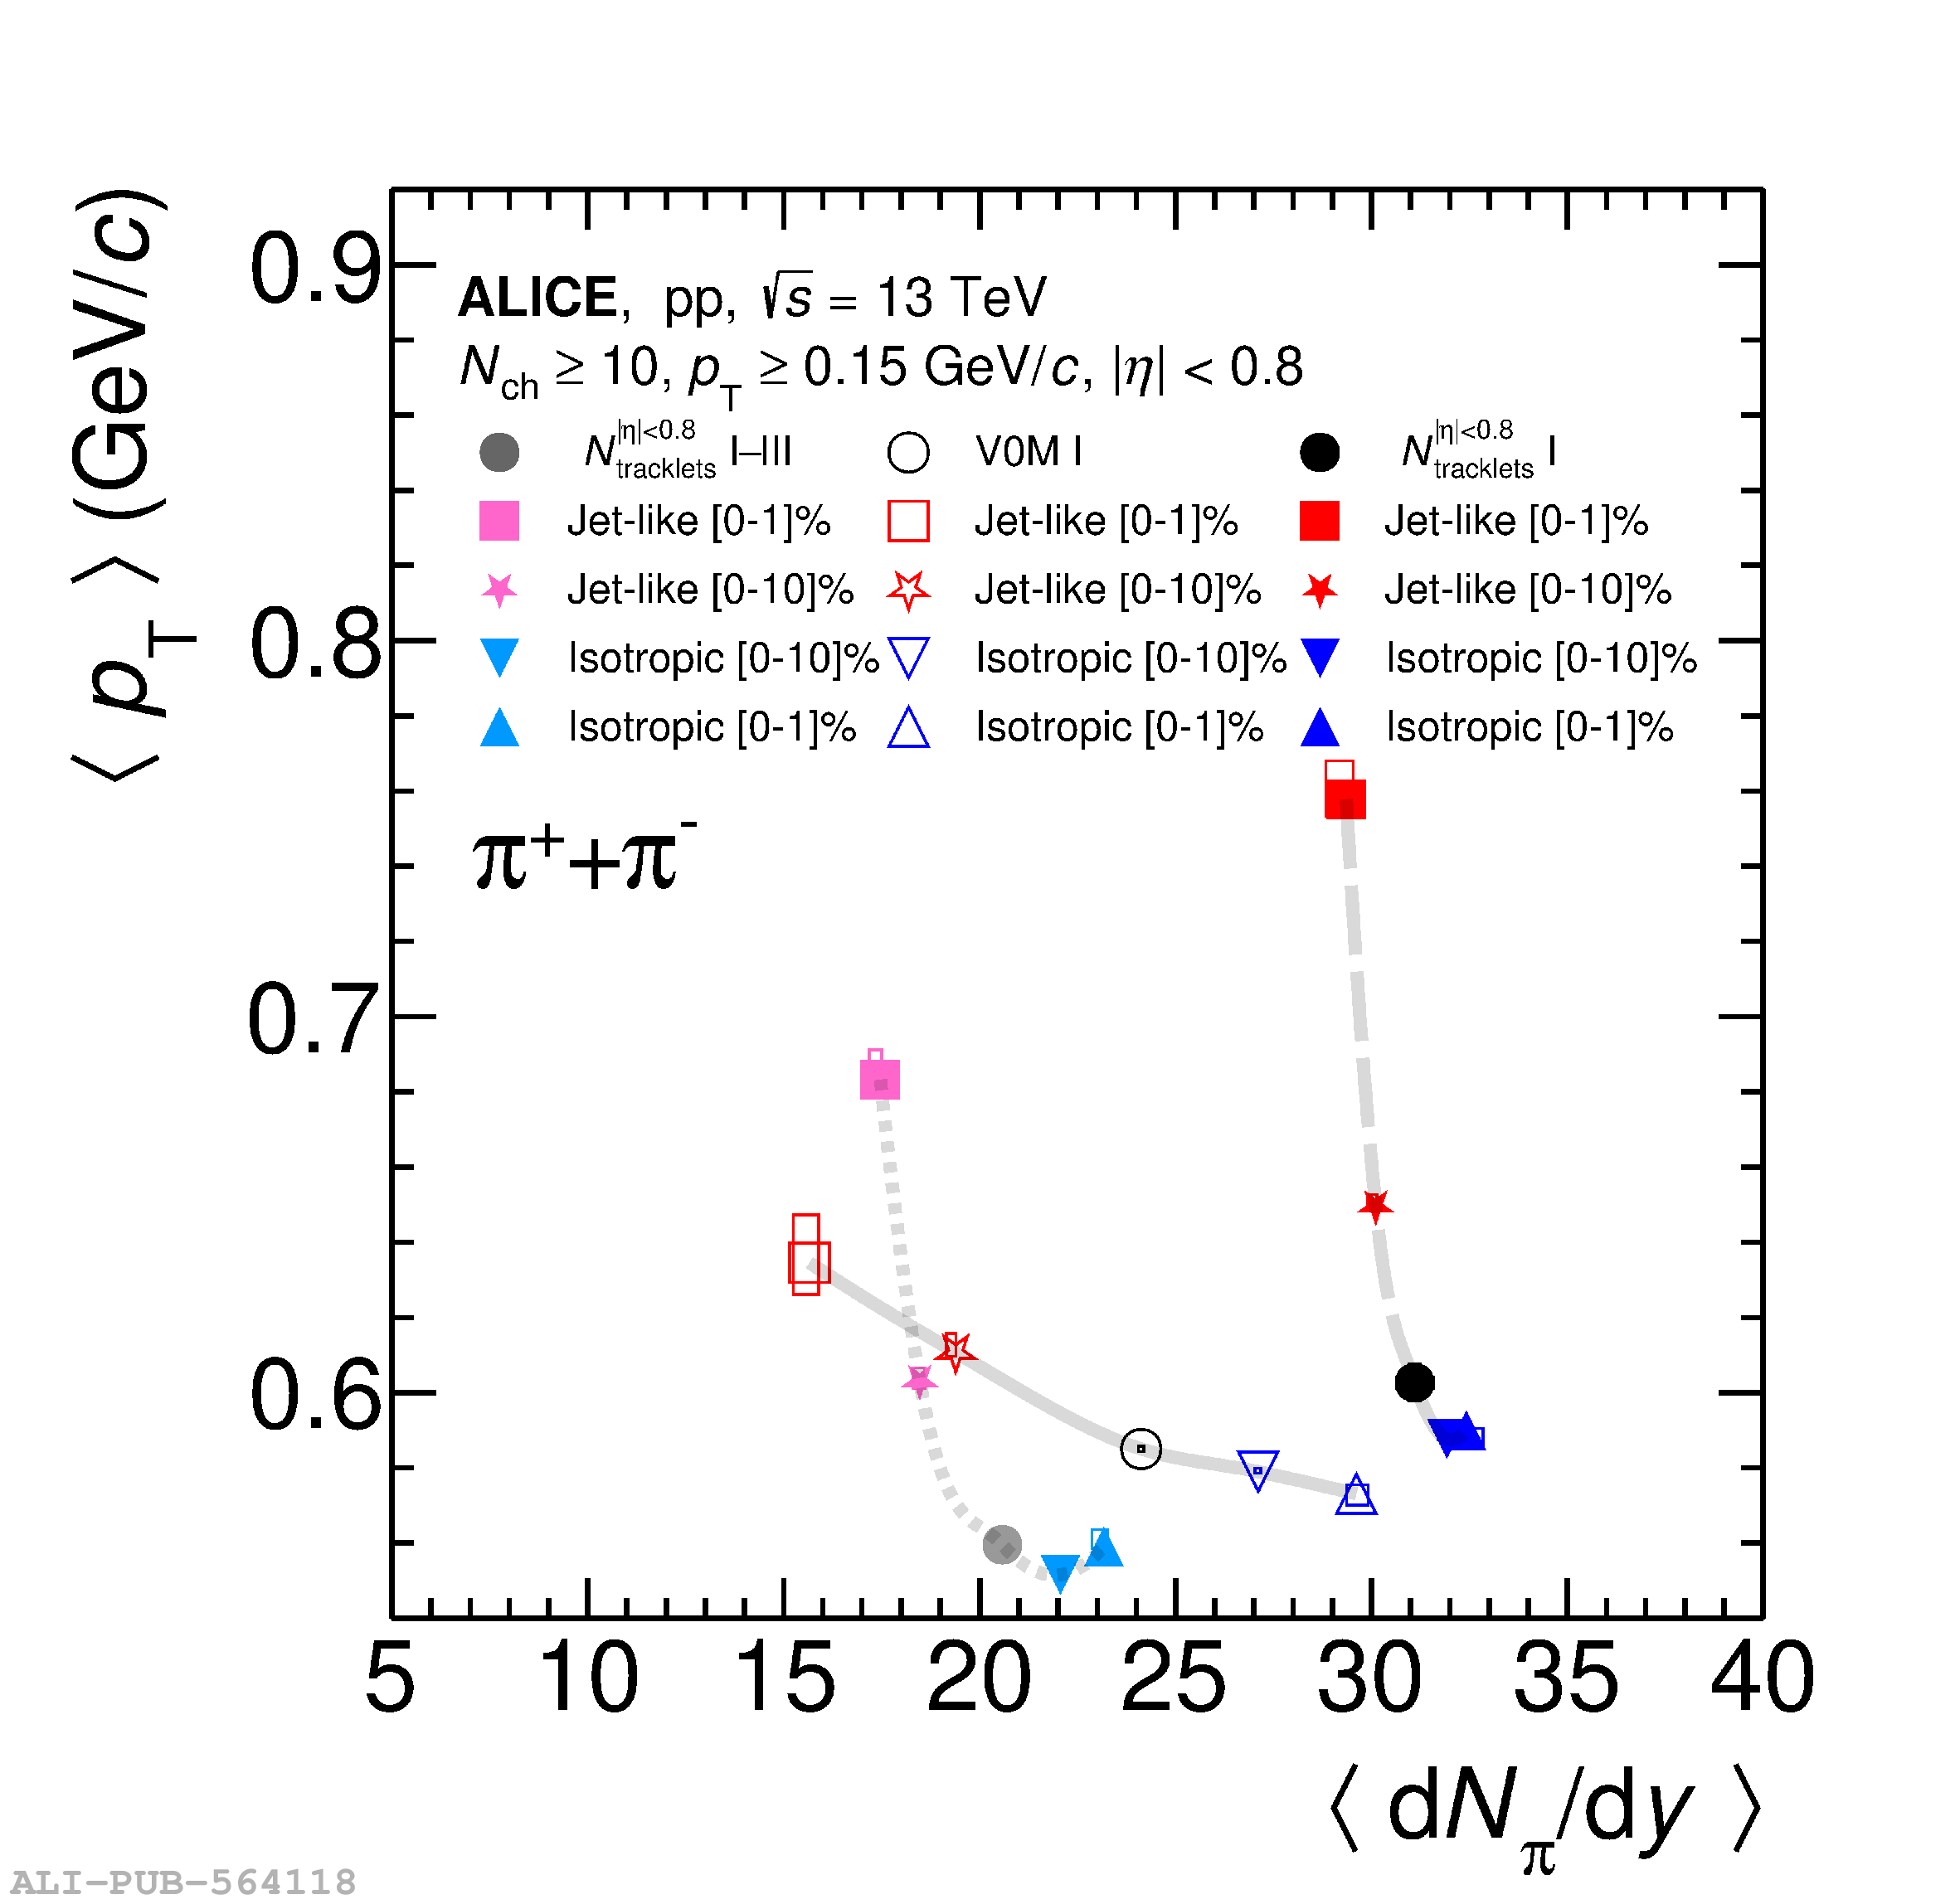 |
Figure 3
PYTHIA 8.2 correlation study between $\langle \widehat {p_{\rm T}} \rangle$ and $\langle n{\rm MPI}\rangle$ as a function of $S_0^{p_{\rm T}=1}$, in 0--1\% V0M and $N_{\rm tracklet}^{|\eta|< 0.8}$ multiplicity classes. The default PYTHIA 8.2 Monash variation is compared to PYTHIA 8.2 with color rope hadronization. The total systematic and statistical uncertainties are smaller than the marker sizes. The grey band is an interpolation between the points, to more clearly illustrate the trend of each multiplicity and model variation. < /n> | 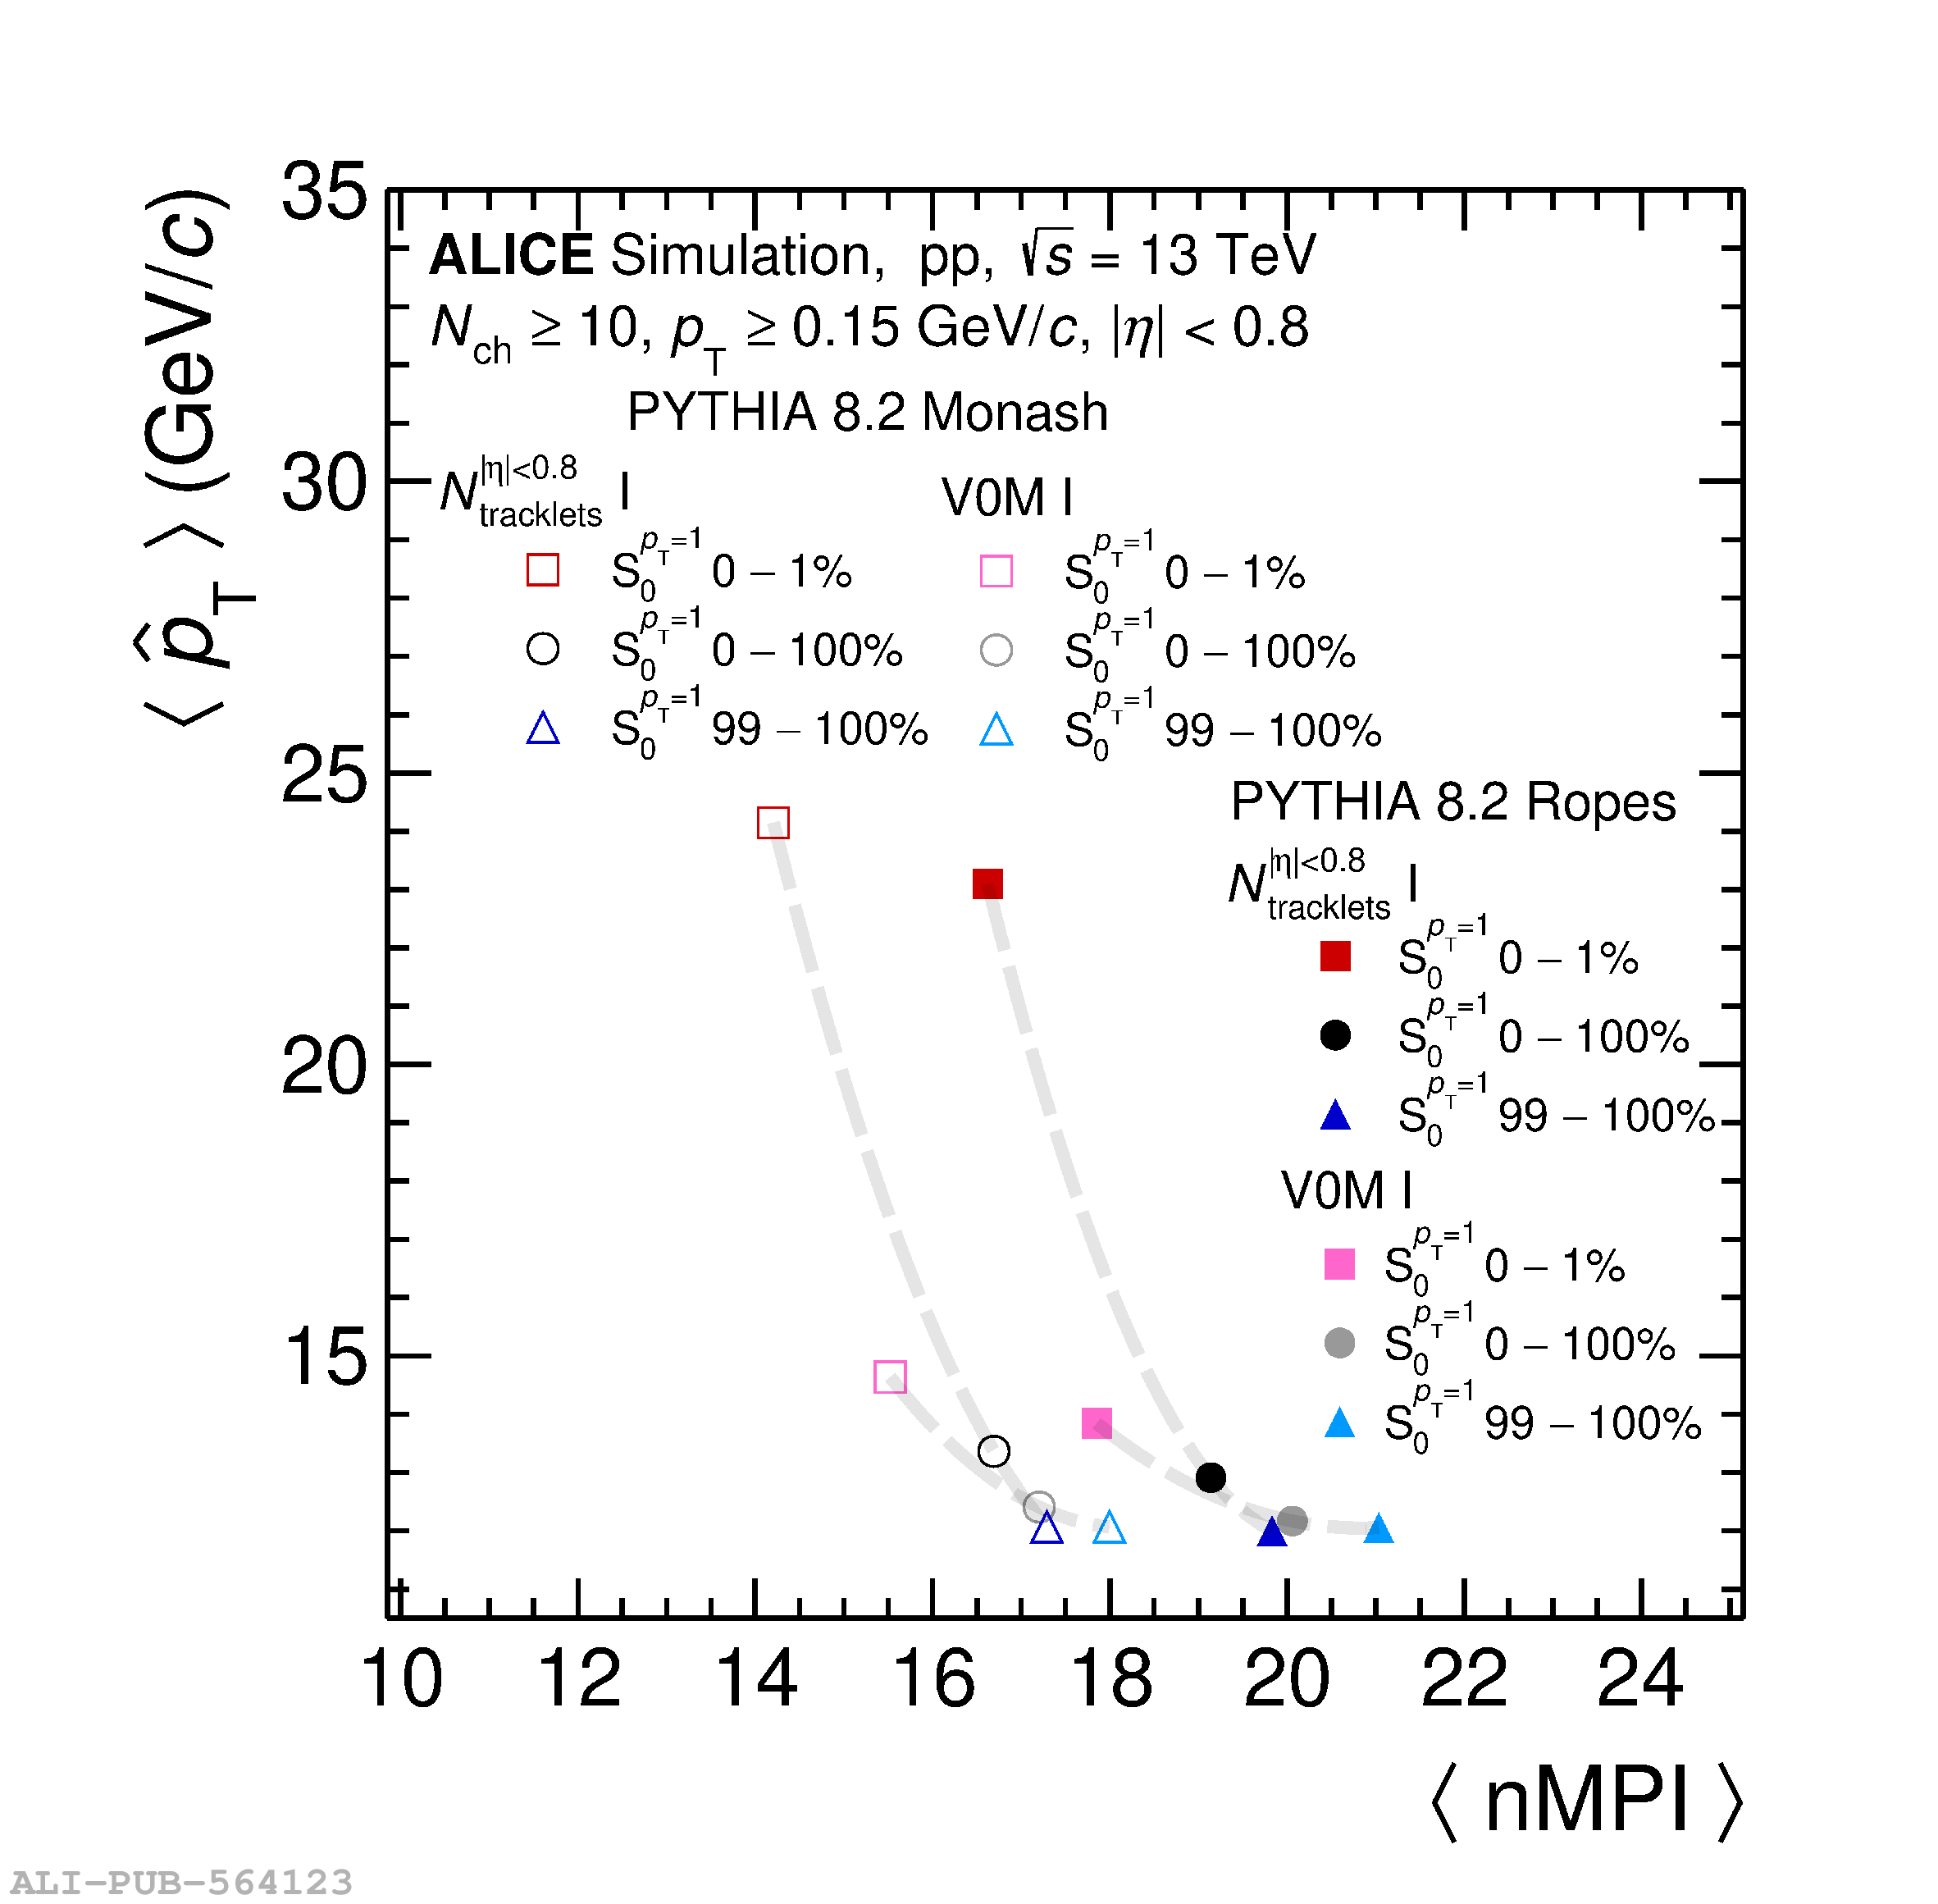 |
Figure 4
Transverse momentum distribution of $\pi$, K, p, K$^{*0}$, $\phi$, K$^{0}_{\rm S}$, $\Lambda$ and $\Xi$ for $S_0^{p_{\rm T}=1}$ classes selected for events at high-multiplicity, determined by events in the top 1\% of $N_{\rm tracklet}^{|\eta|< 0.8}$ . The lower panels present the ratio between the $S_0^{p_{\rm T}=1}$-integrated and $S_0^{p_{\rm T}=1}$-differential events. Statistical and total systematic uncertainties are shown by error bars and boxes, respectively. The curves represent PYTHIA 8.2 model predictions of the same measurement. The average statistical uncertainties from the predictions across all particle species range in the order of 1--15 \% from low-to-high $p_{\rm T}$. |  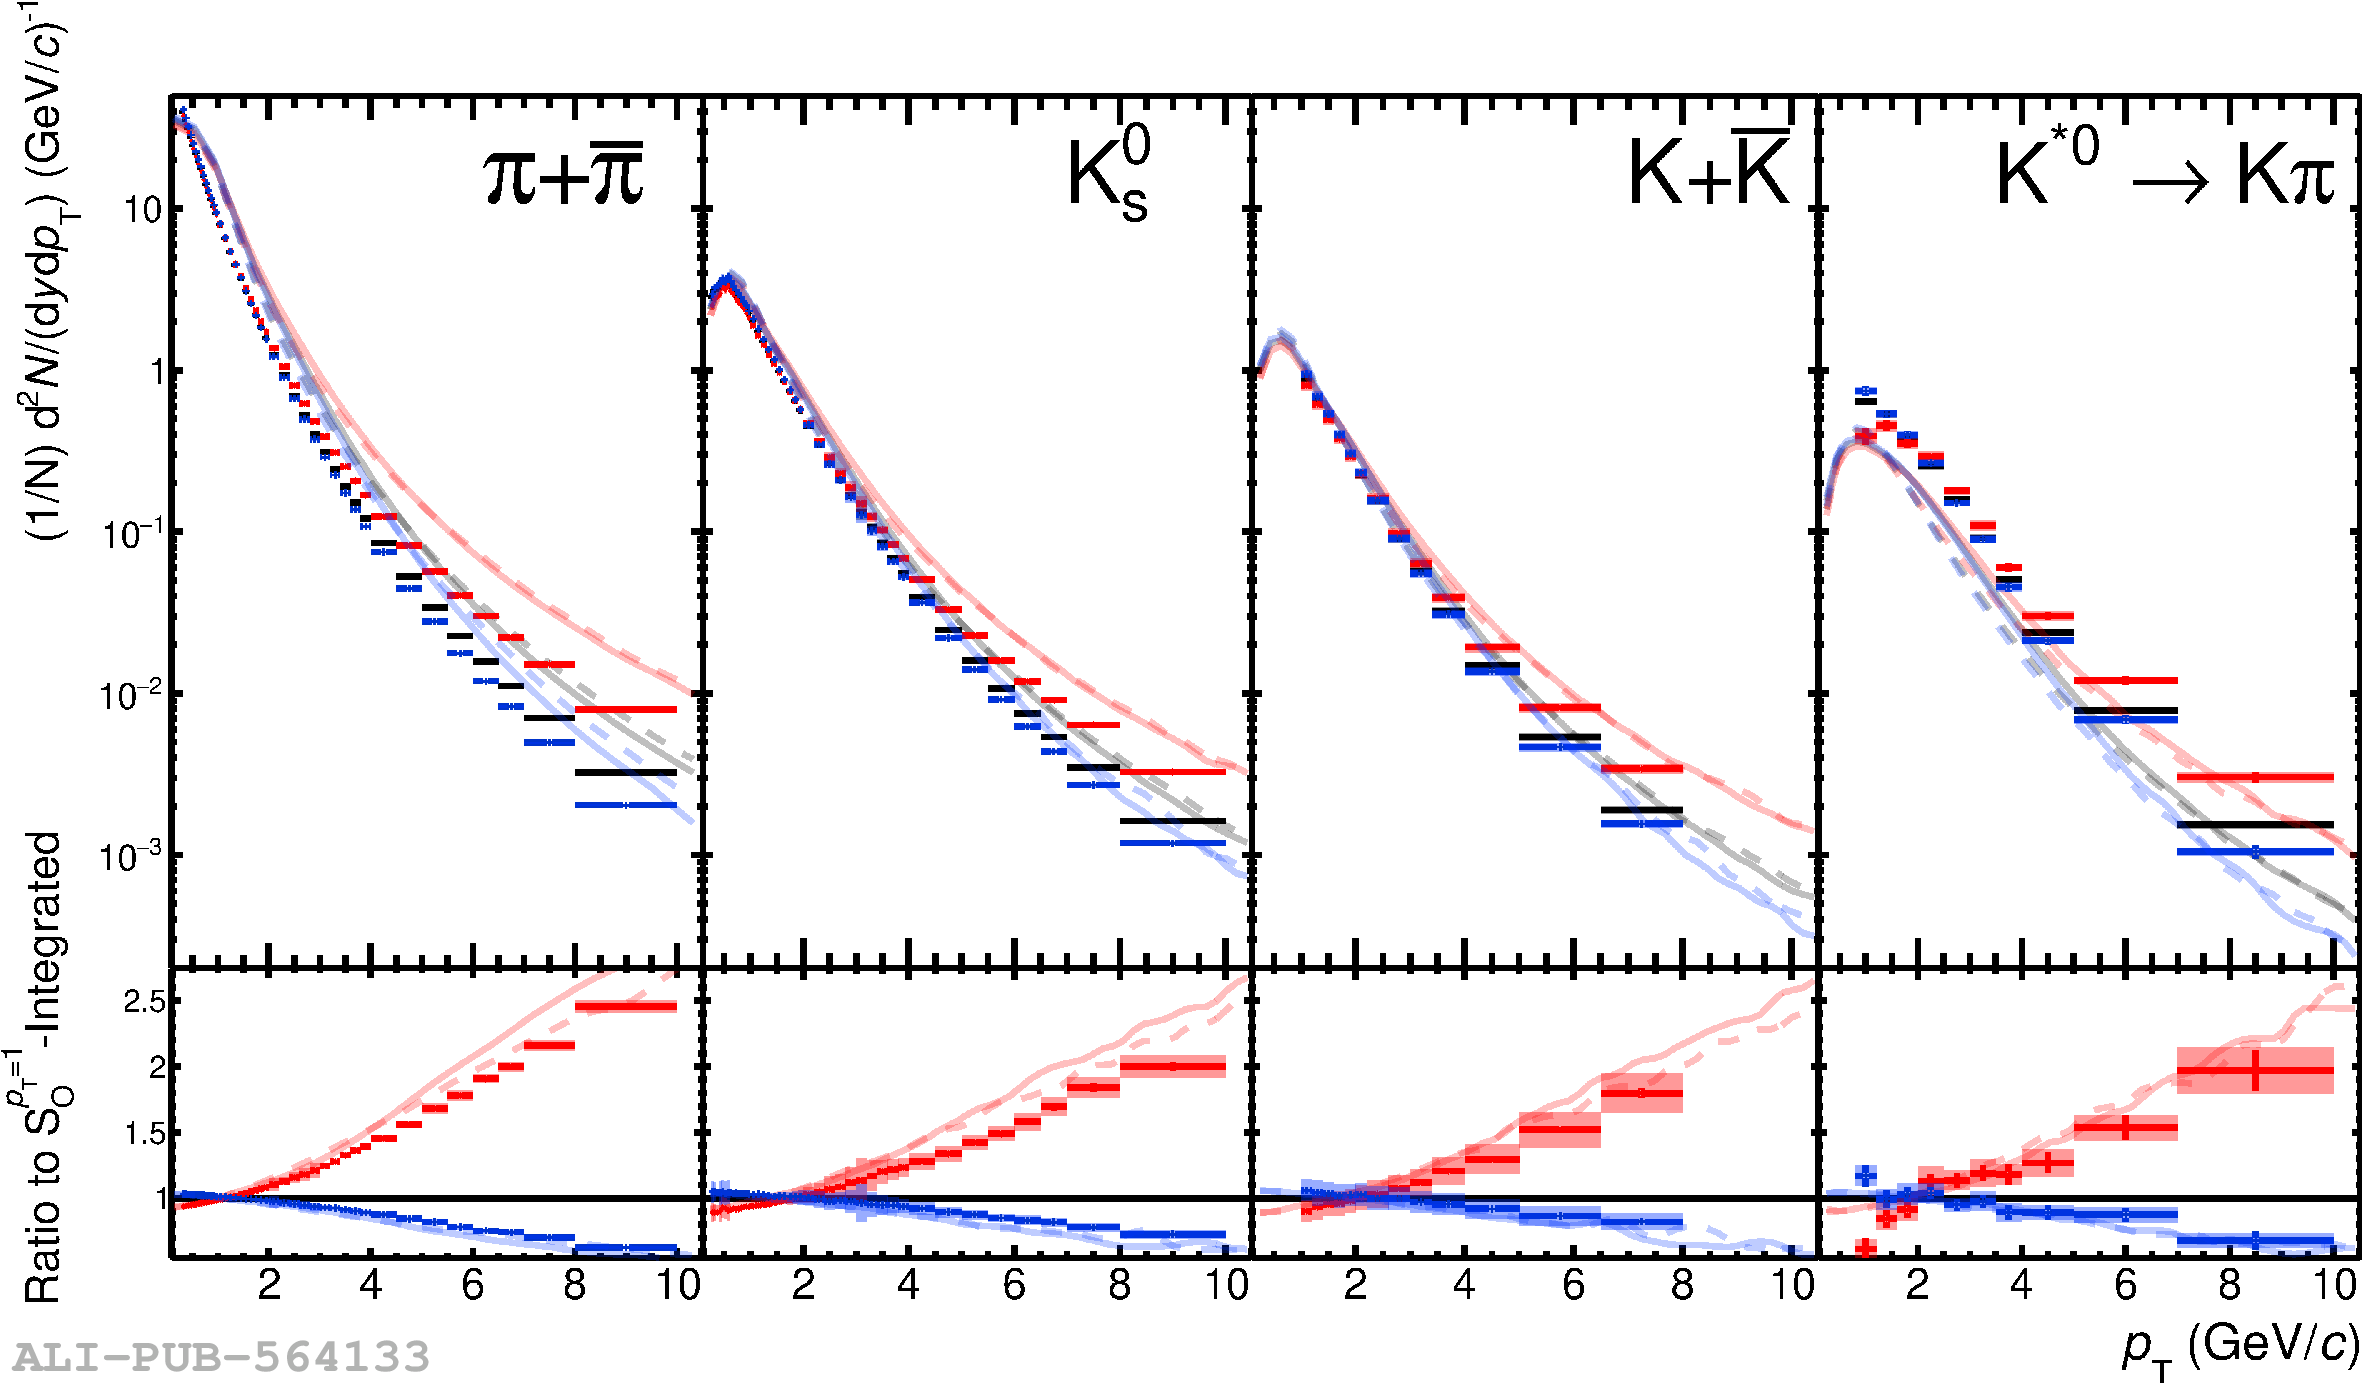 |
Figure 5
Transverse momentum distribution of $\pi$, K, p, K$^{*0}$, $\phi$, K$^{0}_{\rm S}$, $\Lambda$ and $\Xi$ for $S_0^{p_{\rm T}=1}$ classes selected for events at high-multiplicity, determined by events in the top 1\% of $N_{\rm tracklet}^{|\eta|< 0.8}$ . The lower panels present the ratio between the $S_0^{p_{\rm T}=1}$-integrated and $S_0^{p_{\rm T}=1}$-differential events. Statistical and total systematic uncertainties are shown by error bars and boxes, respectively. Fig.4 and Fig.5 both show the same experimental data. The curves represent Herwig 7.2 and EPOS-LHC predictions of the same measurement. The average statistical uncertainties from the predictions across all particle species range in the order of 1--25 \% from low-to-high \pt. | 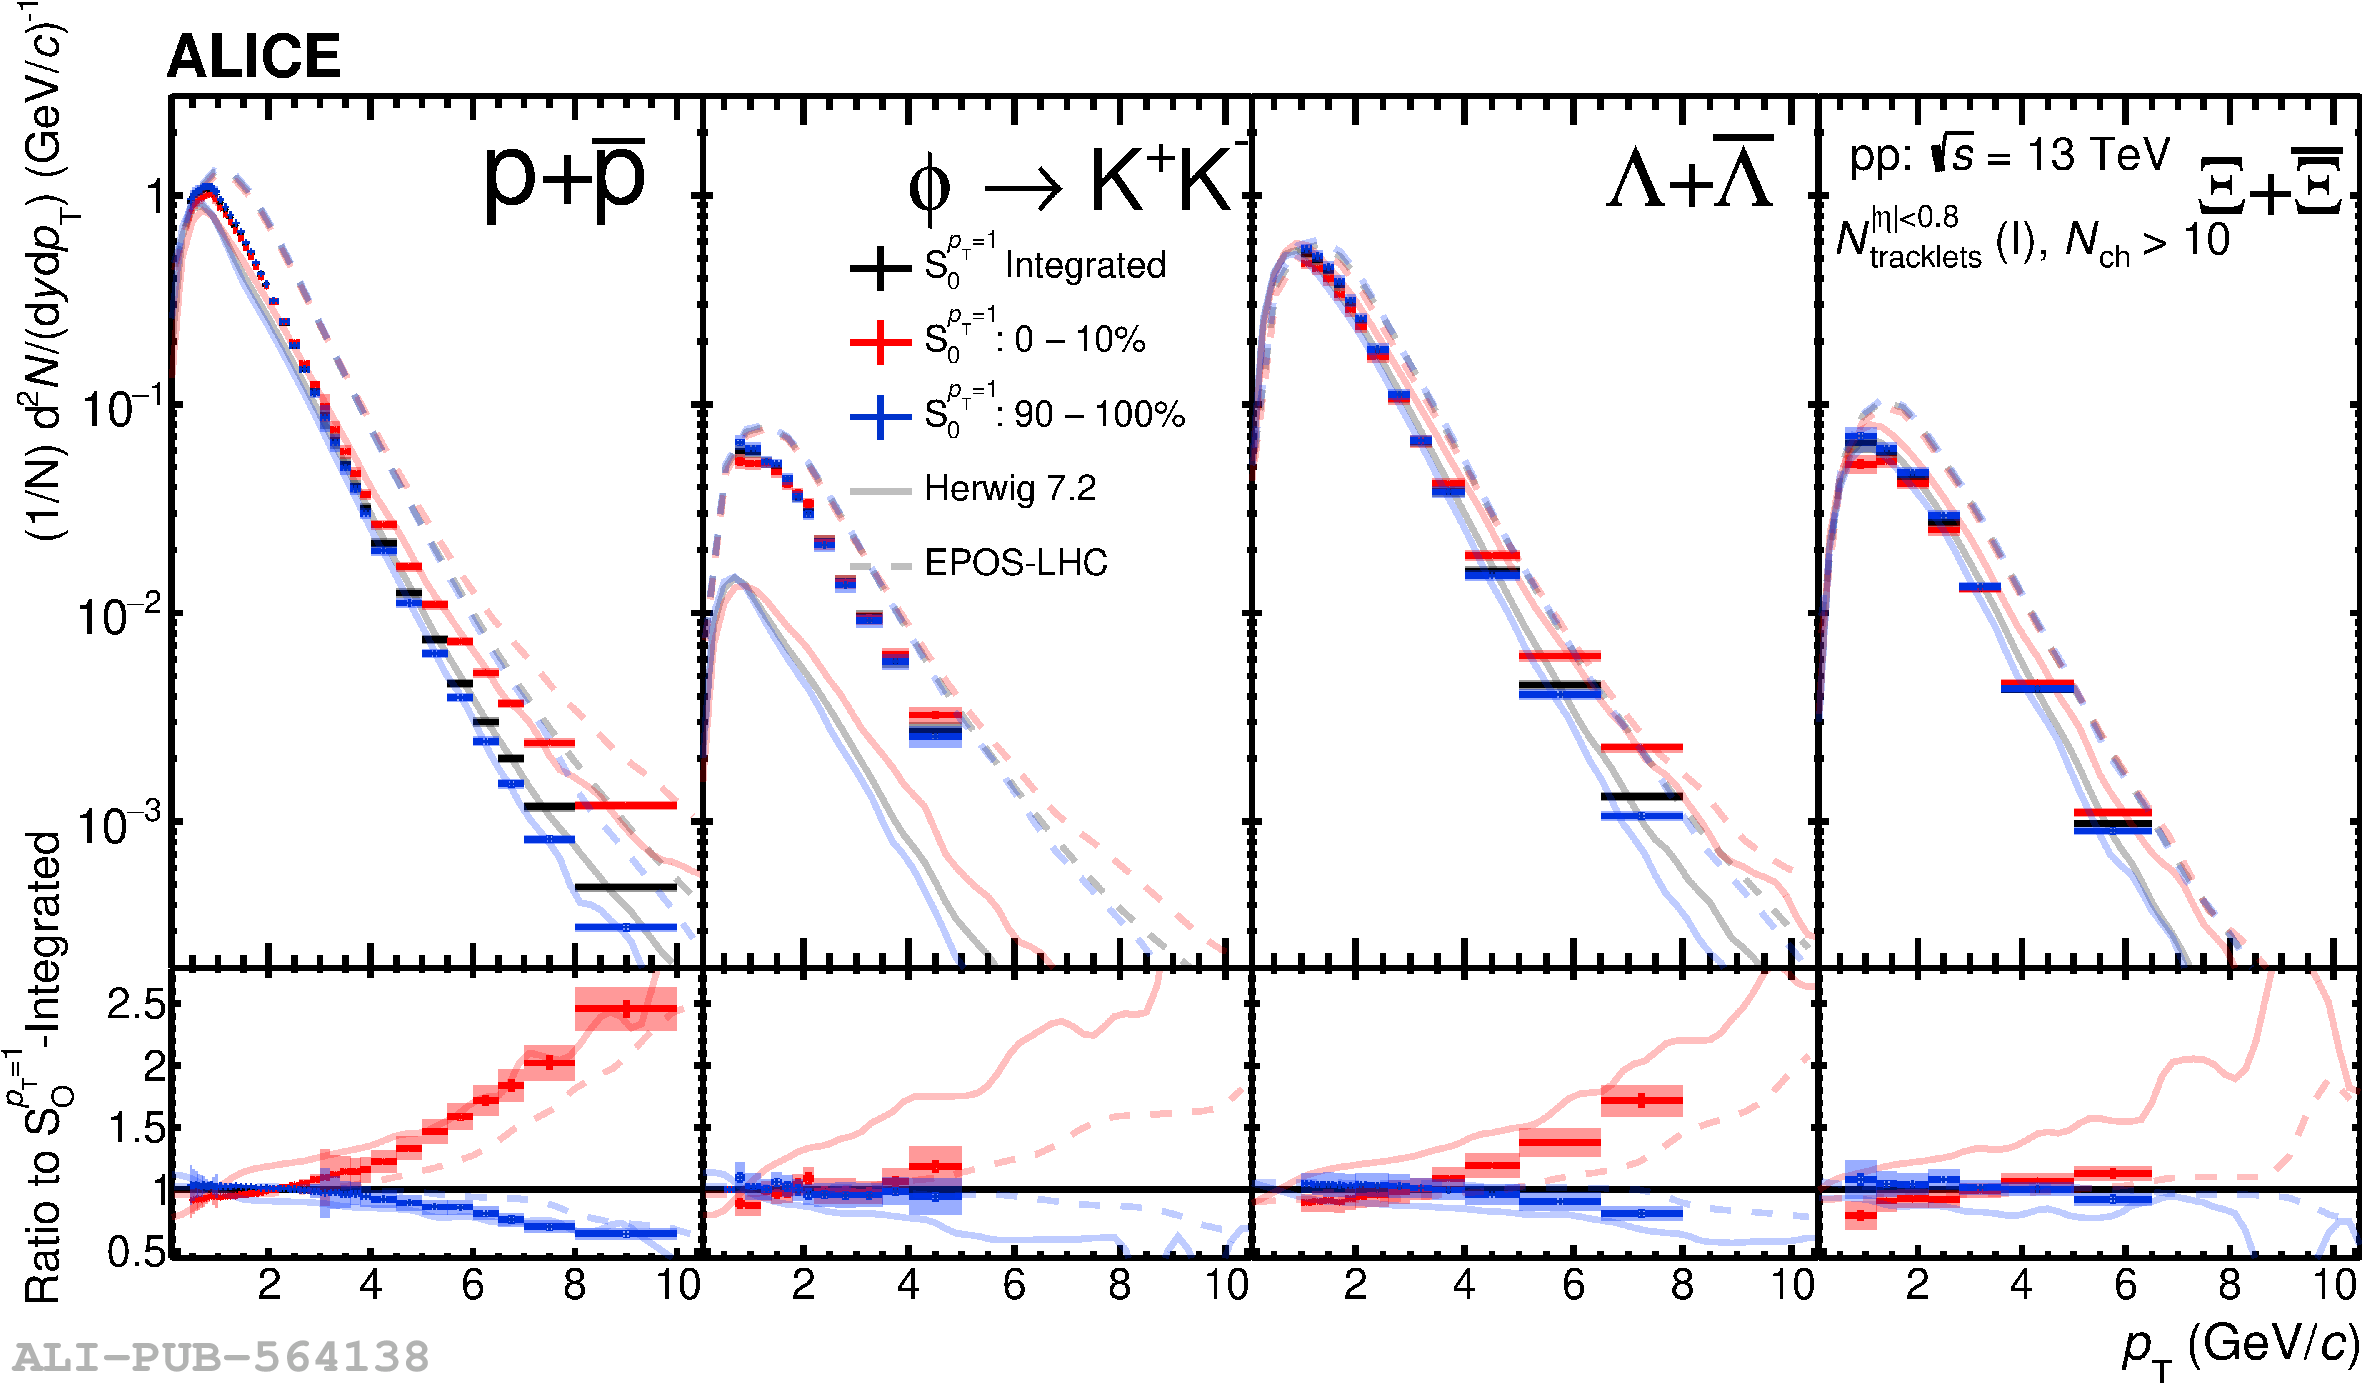 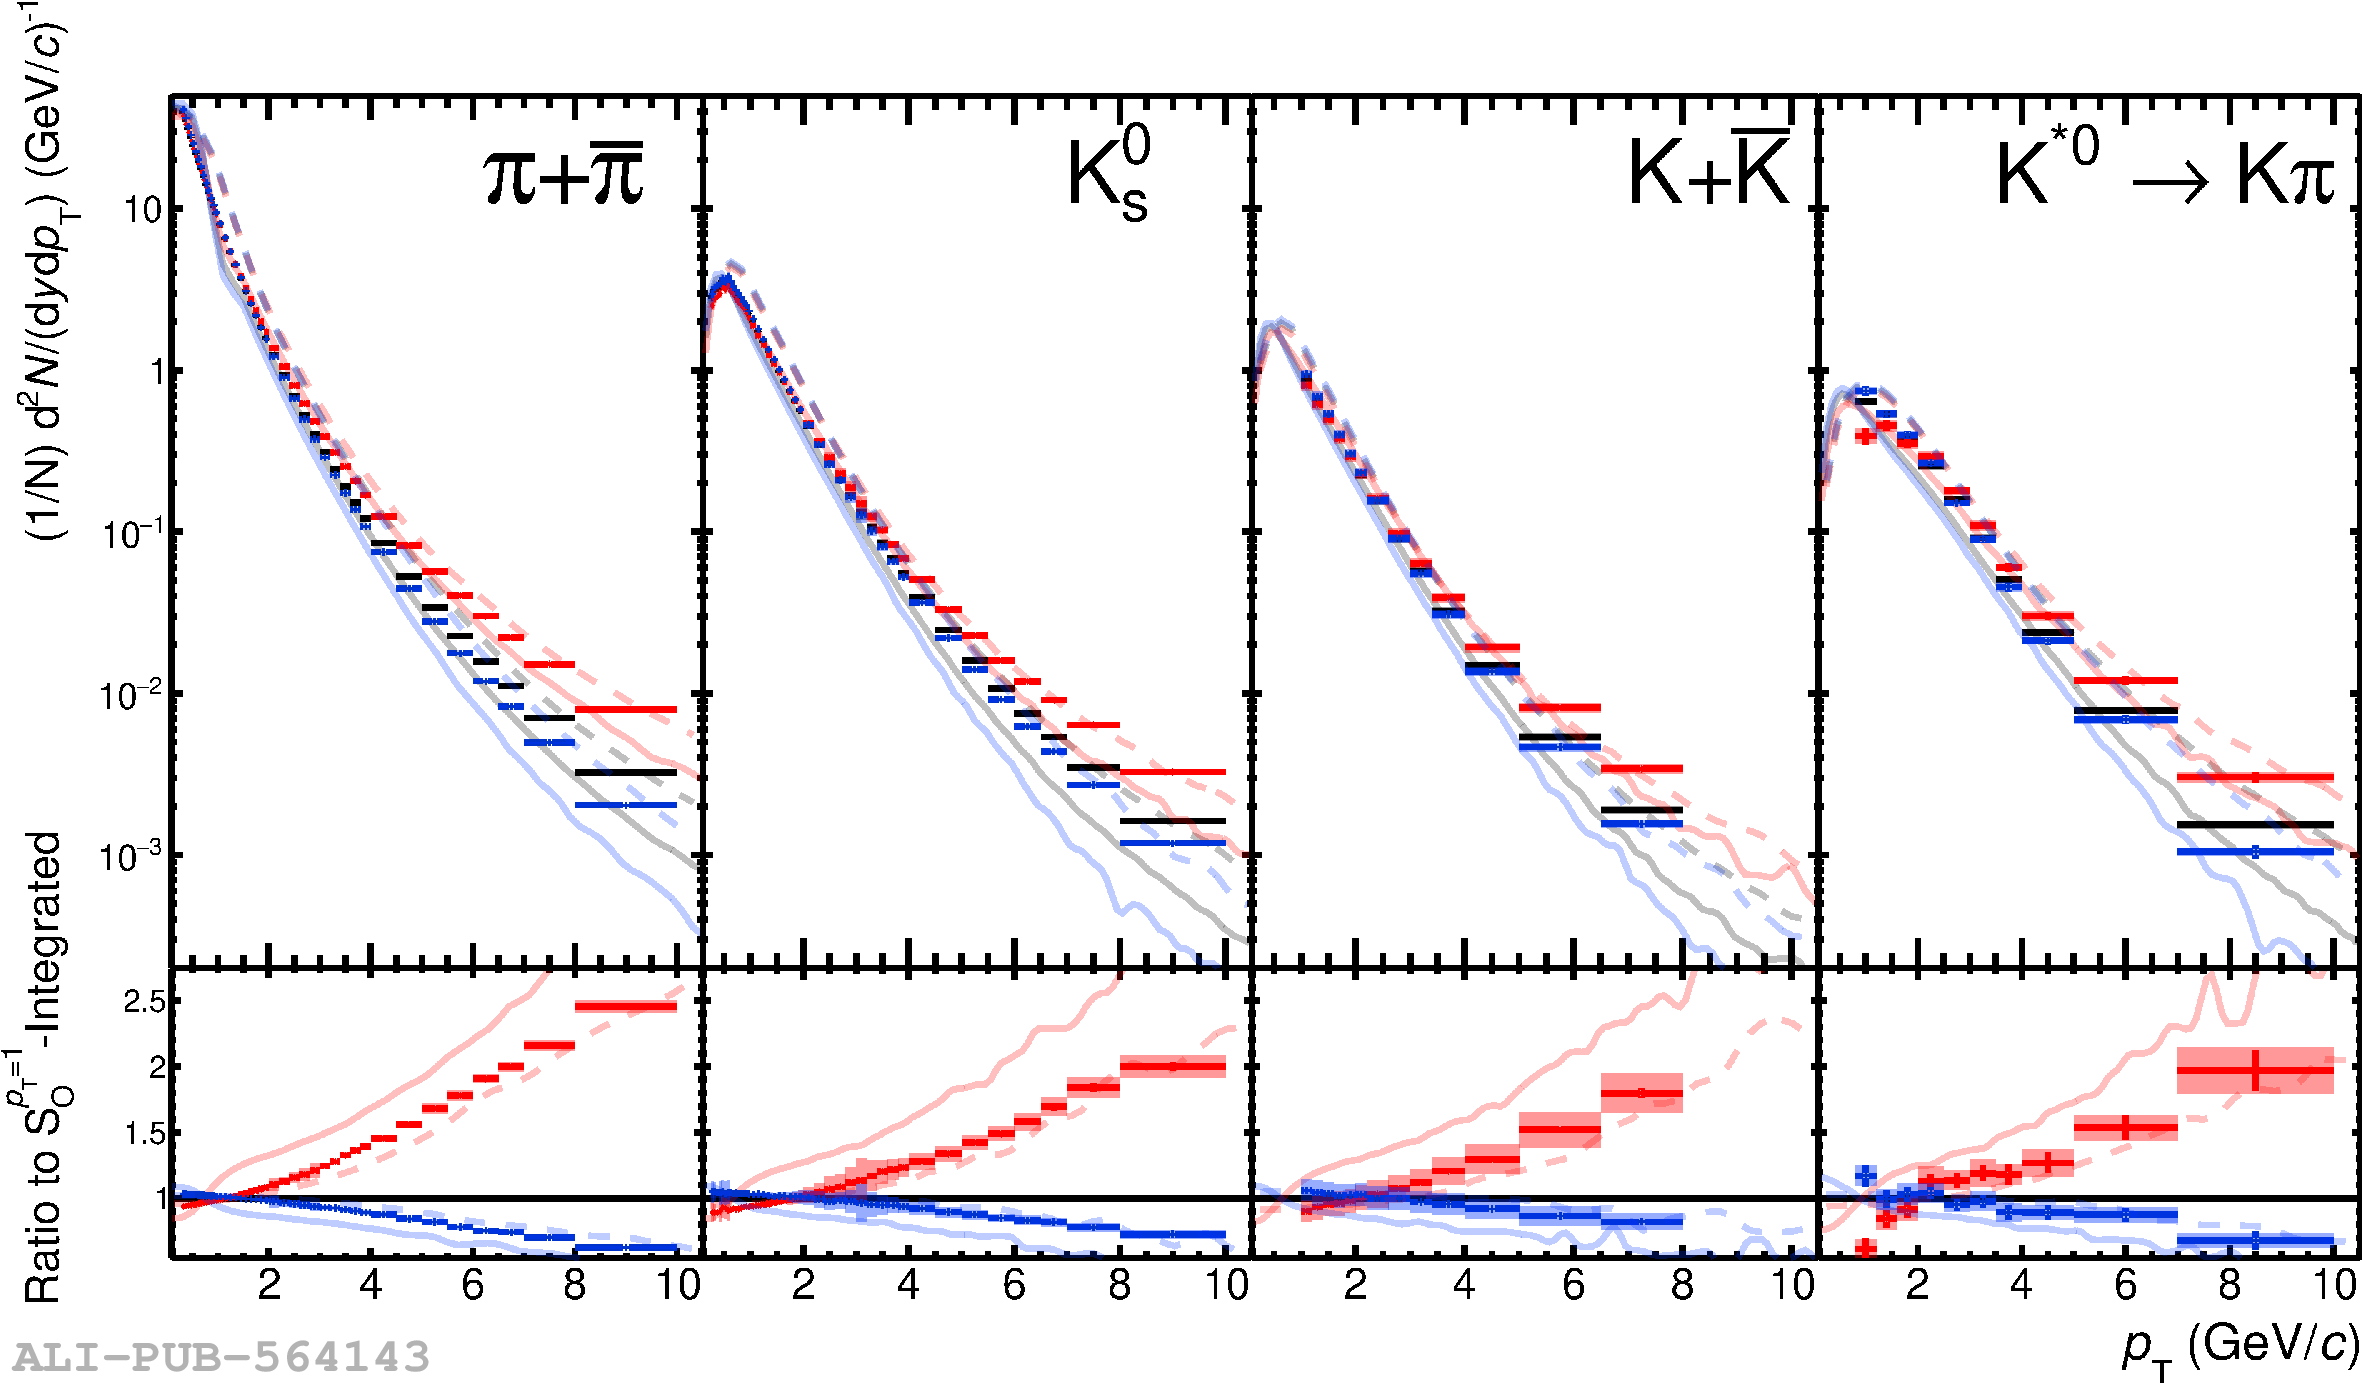 |
Figure 6
The $\langle p_{\rm T} \rangle$ and $\langle {\rm d}N/{\rm d}y \rangle$ as a function of particle masses obtained for the various particle species in $S_0^{p_{\rm T}=1}$ classes selected for high-multiplicity events, determined by the events in the 0--1\% of $N_{\rm tracklet}^{|\eta|< 0.8}$. Upper (lower) panels show the $\langle p_{\rm T} \rangle \langle {\rm d}N/{\rm d}y \rangle$ . The total systematic uncertainty is represented by the shaded regions. The measured data is compared to predictions from PYTHIA8 Monash, PYTHIA8 Rope, EPOS-LHC, and Herwig 7.2. |  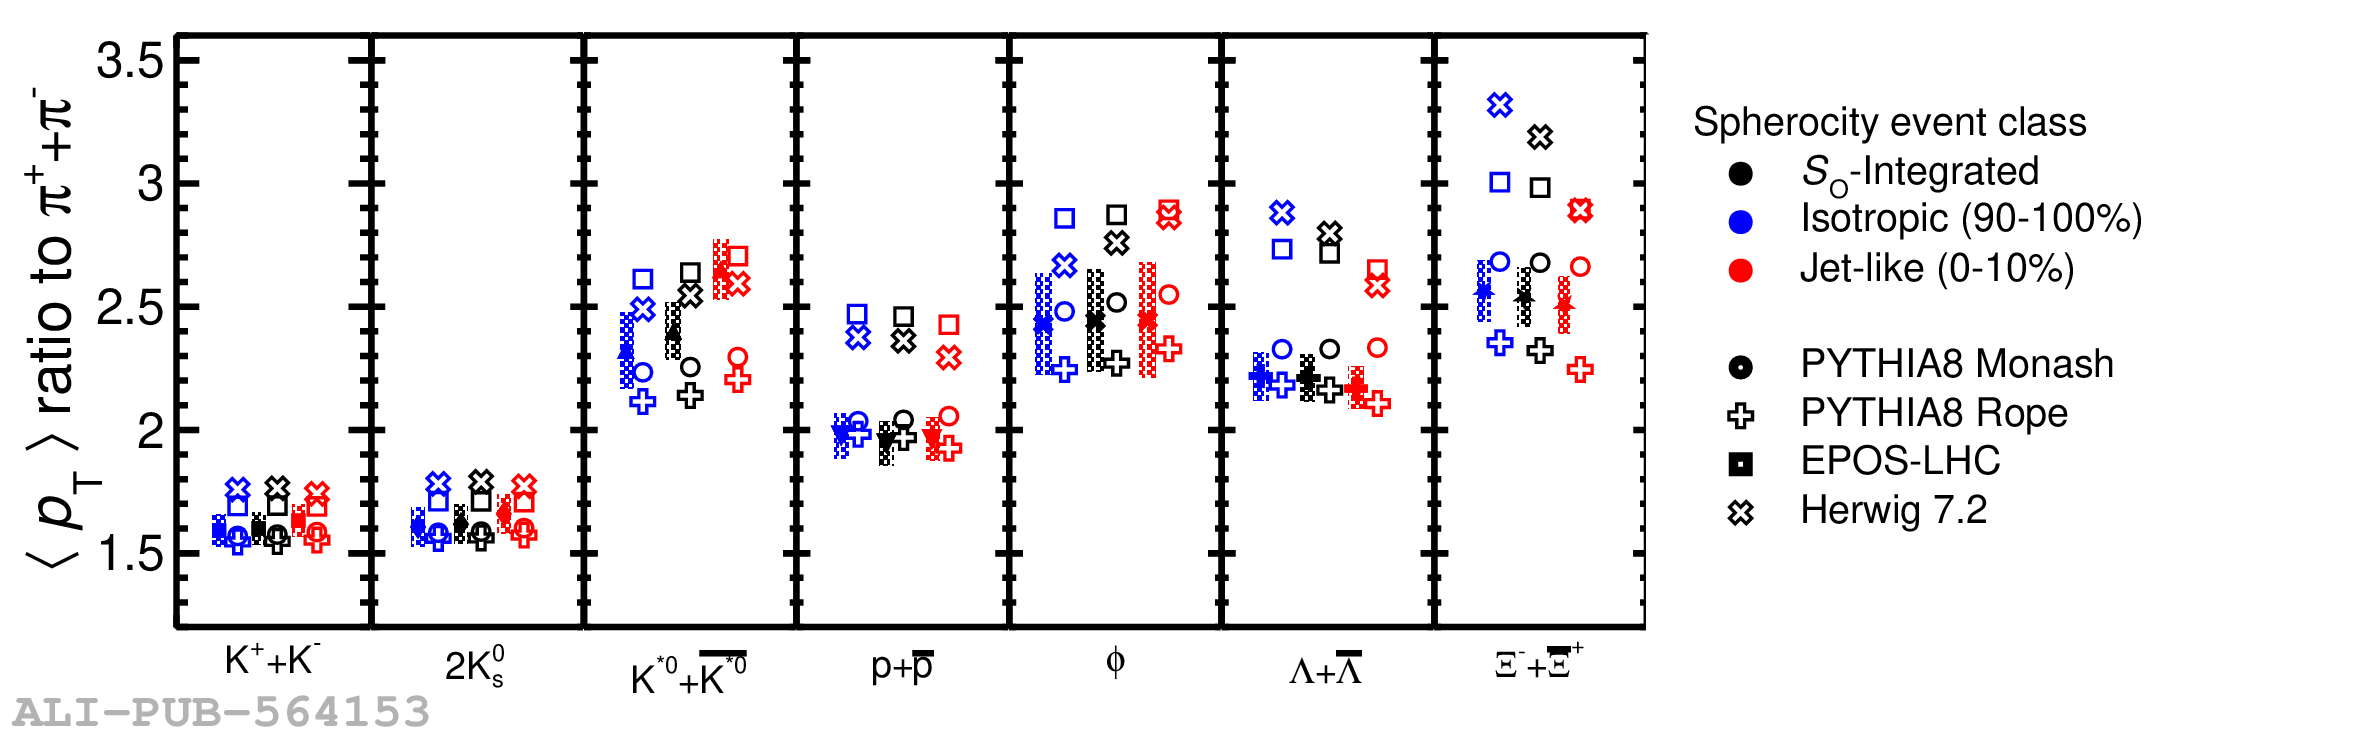  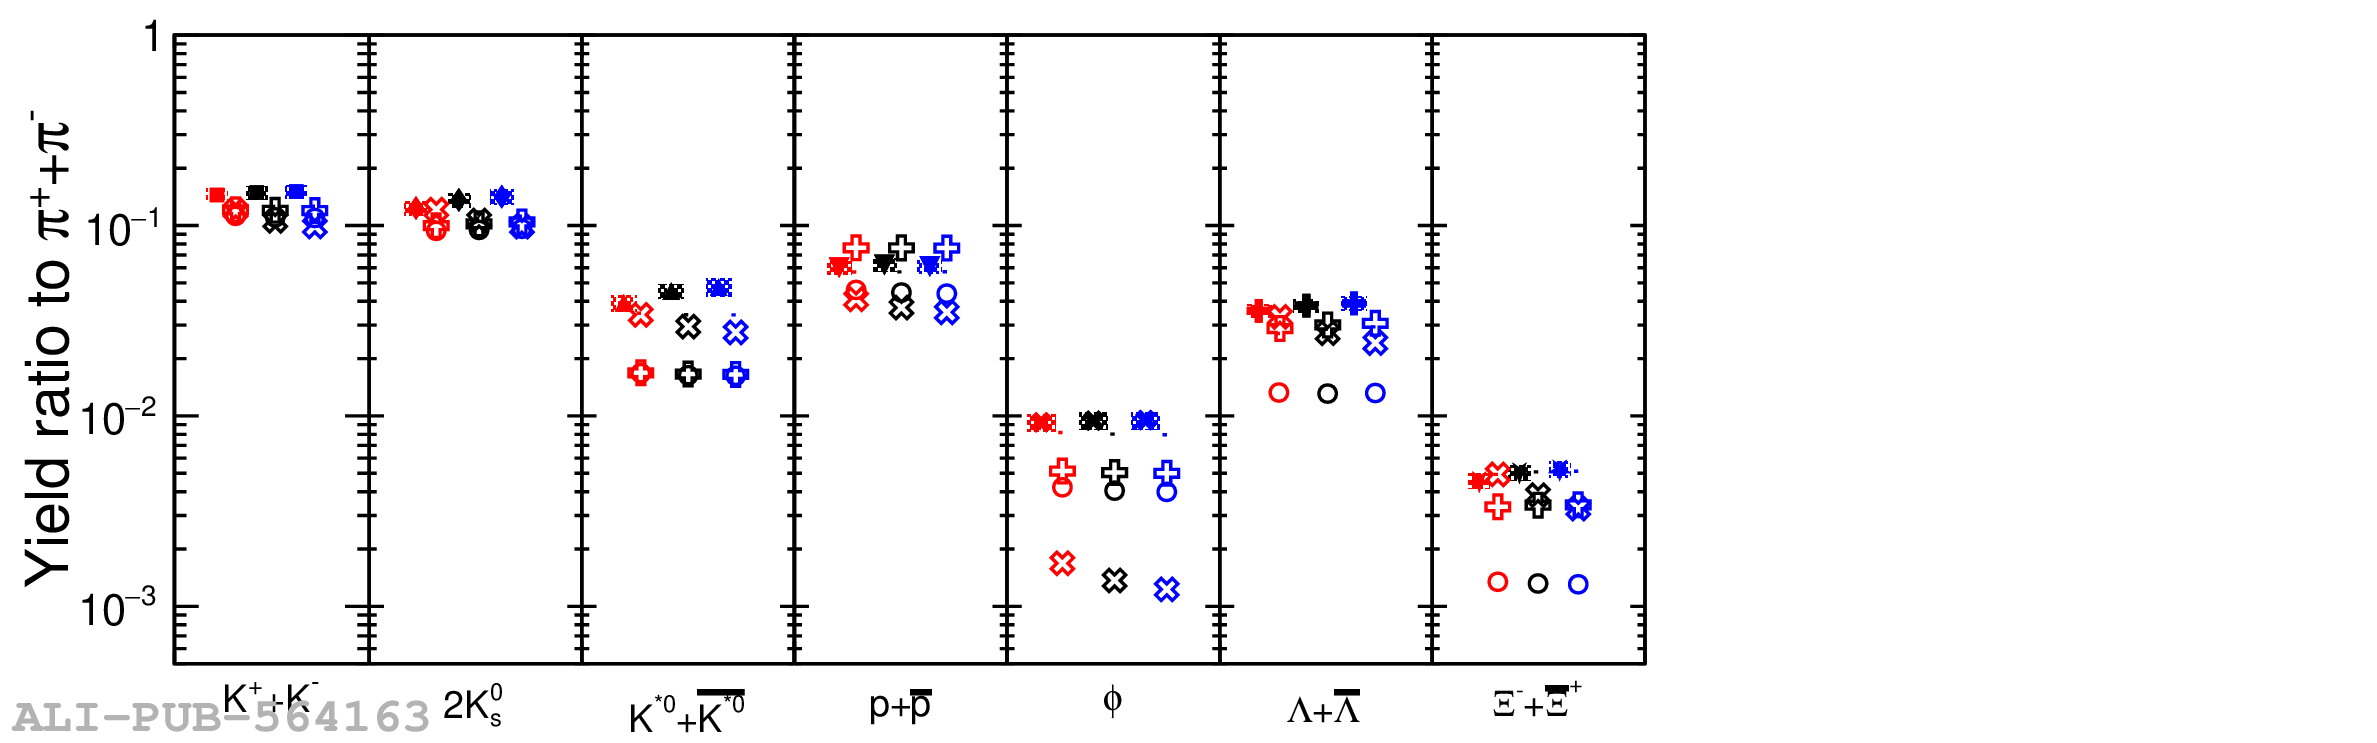 |
Figure 7
Top panels show hadron-to-$\pi$ ratios for 0--10\% $S_0^{p_{\rm T}=1}$ classes selected for the 0--1\% $N_{\rm tracklet}^{|\eta|< 0.8}$ multiplicity events. Bottom panels present the hadron-to-$\pi$ double ratios of $S_0^{p_{\rm T}=1}$ classes relative to $S_0^{p_{\rm T}=1}$ integrated high-multiplicity events. Statistical and systematic uncertainties are shown by bars and boxes, respectively. Experimental results are compared with predictions from PYTHIA 8.2 Monash and Ropes. | 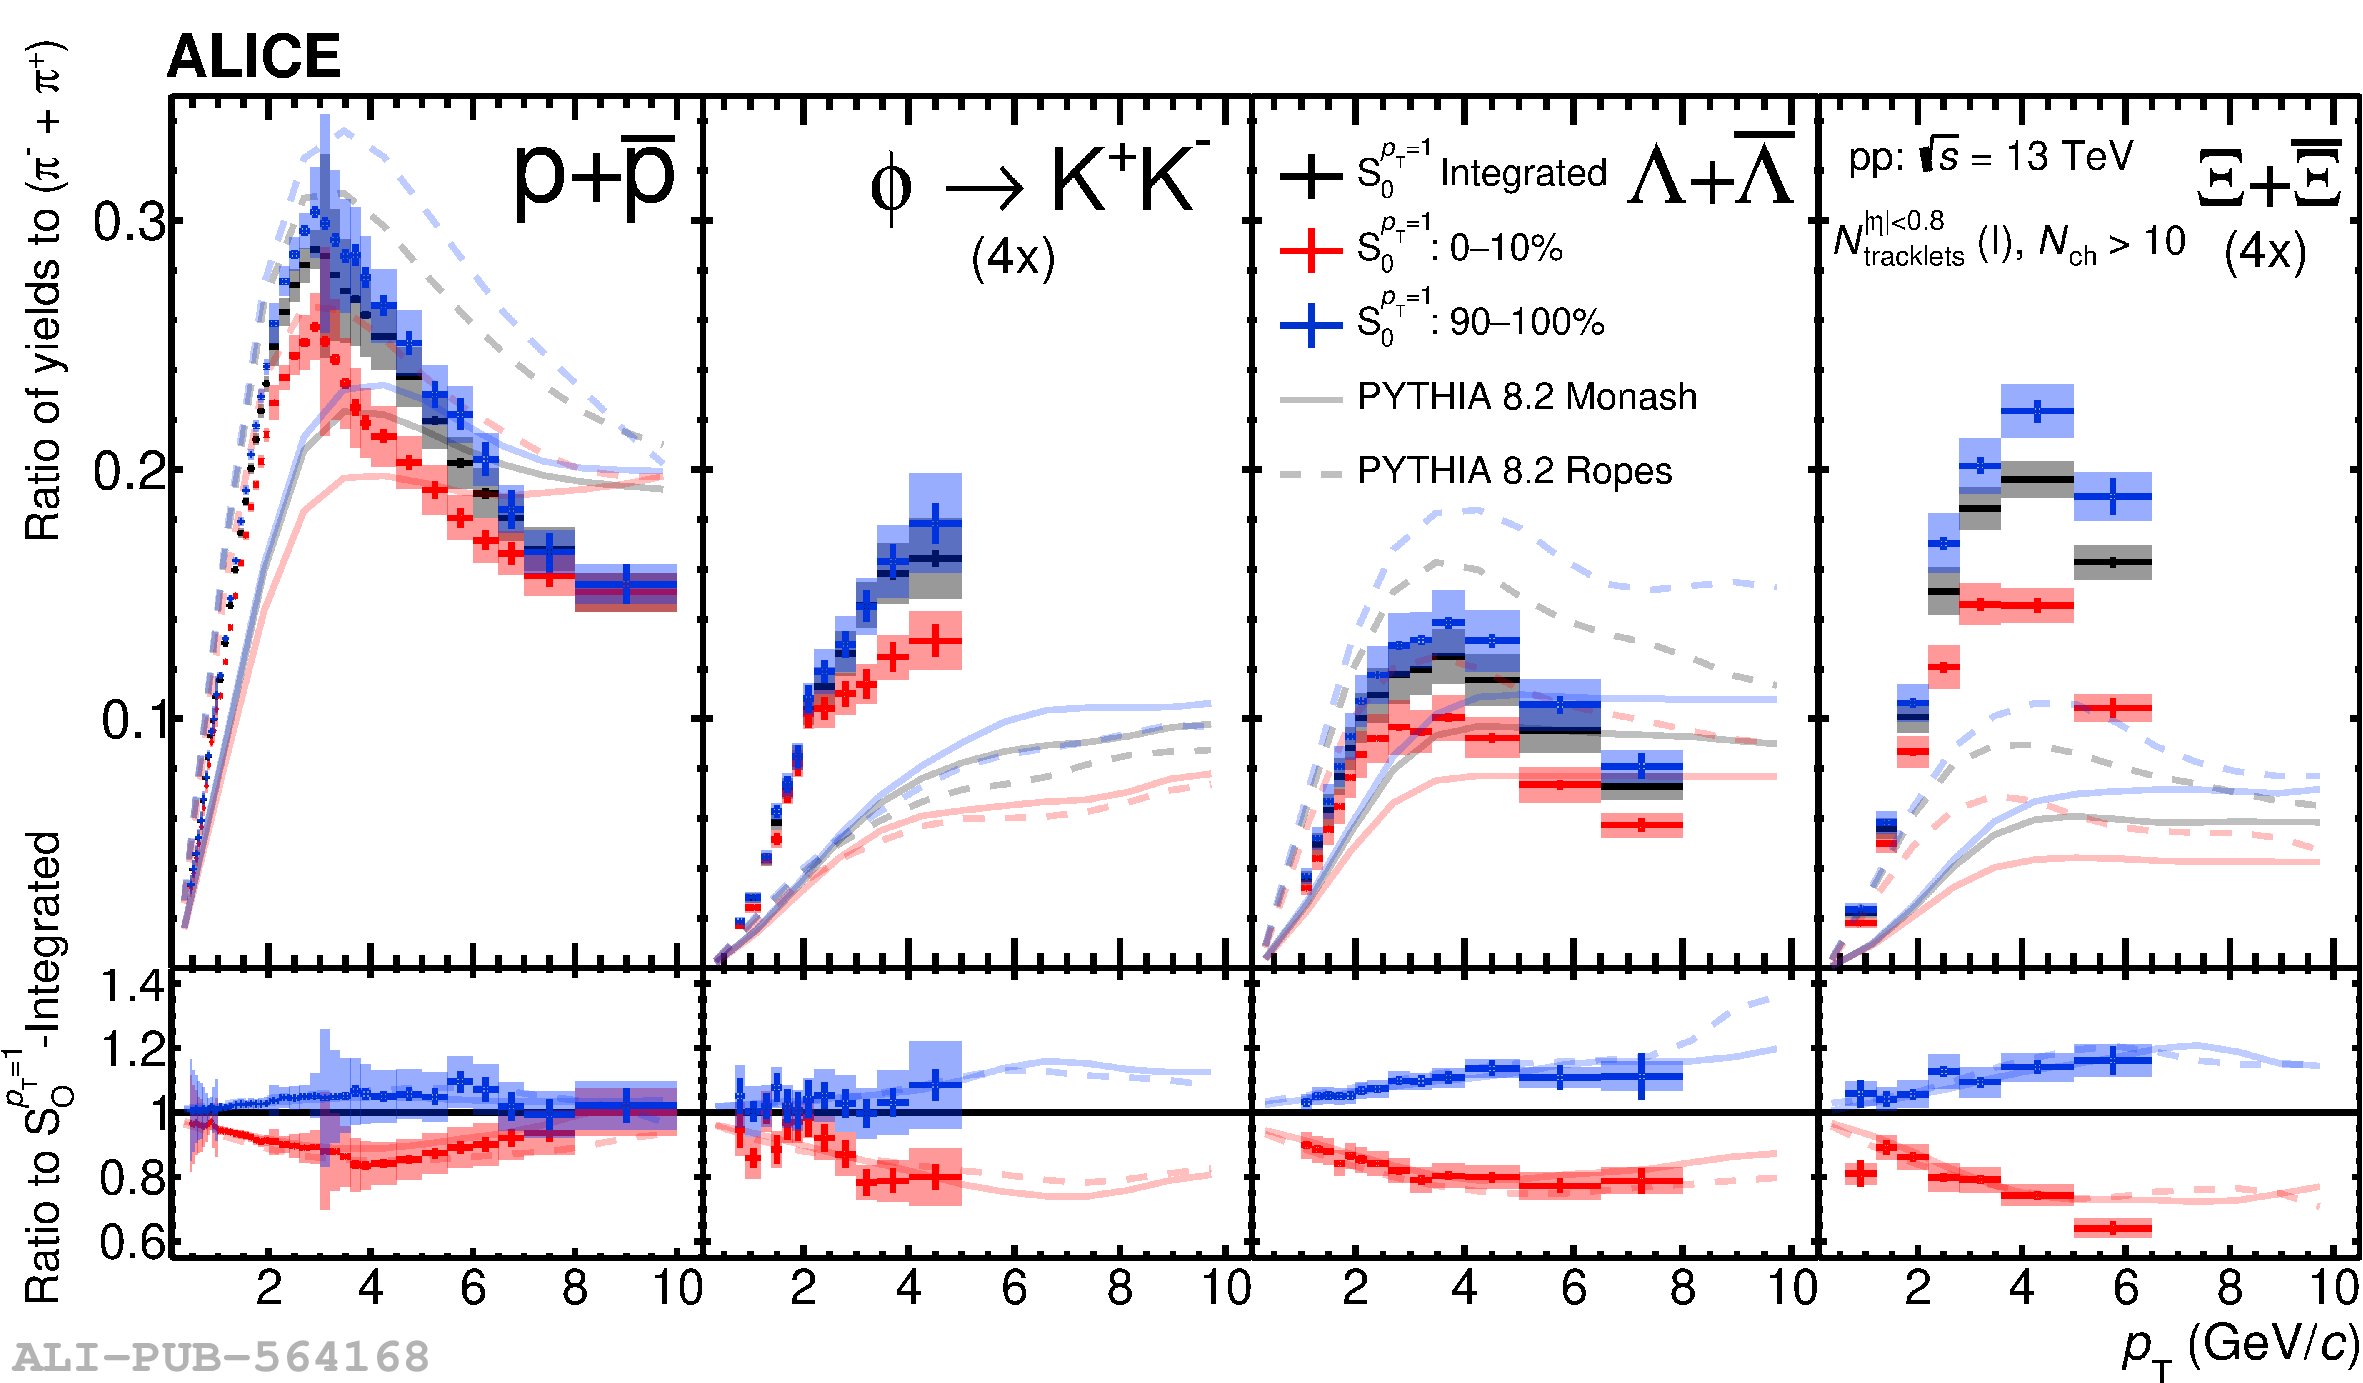 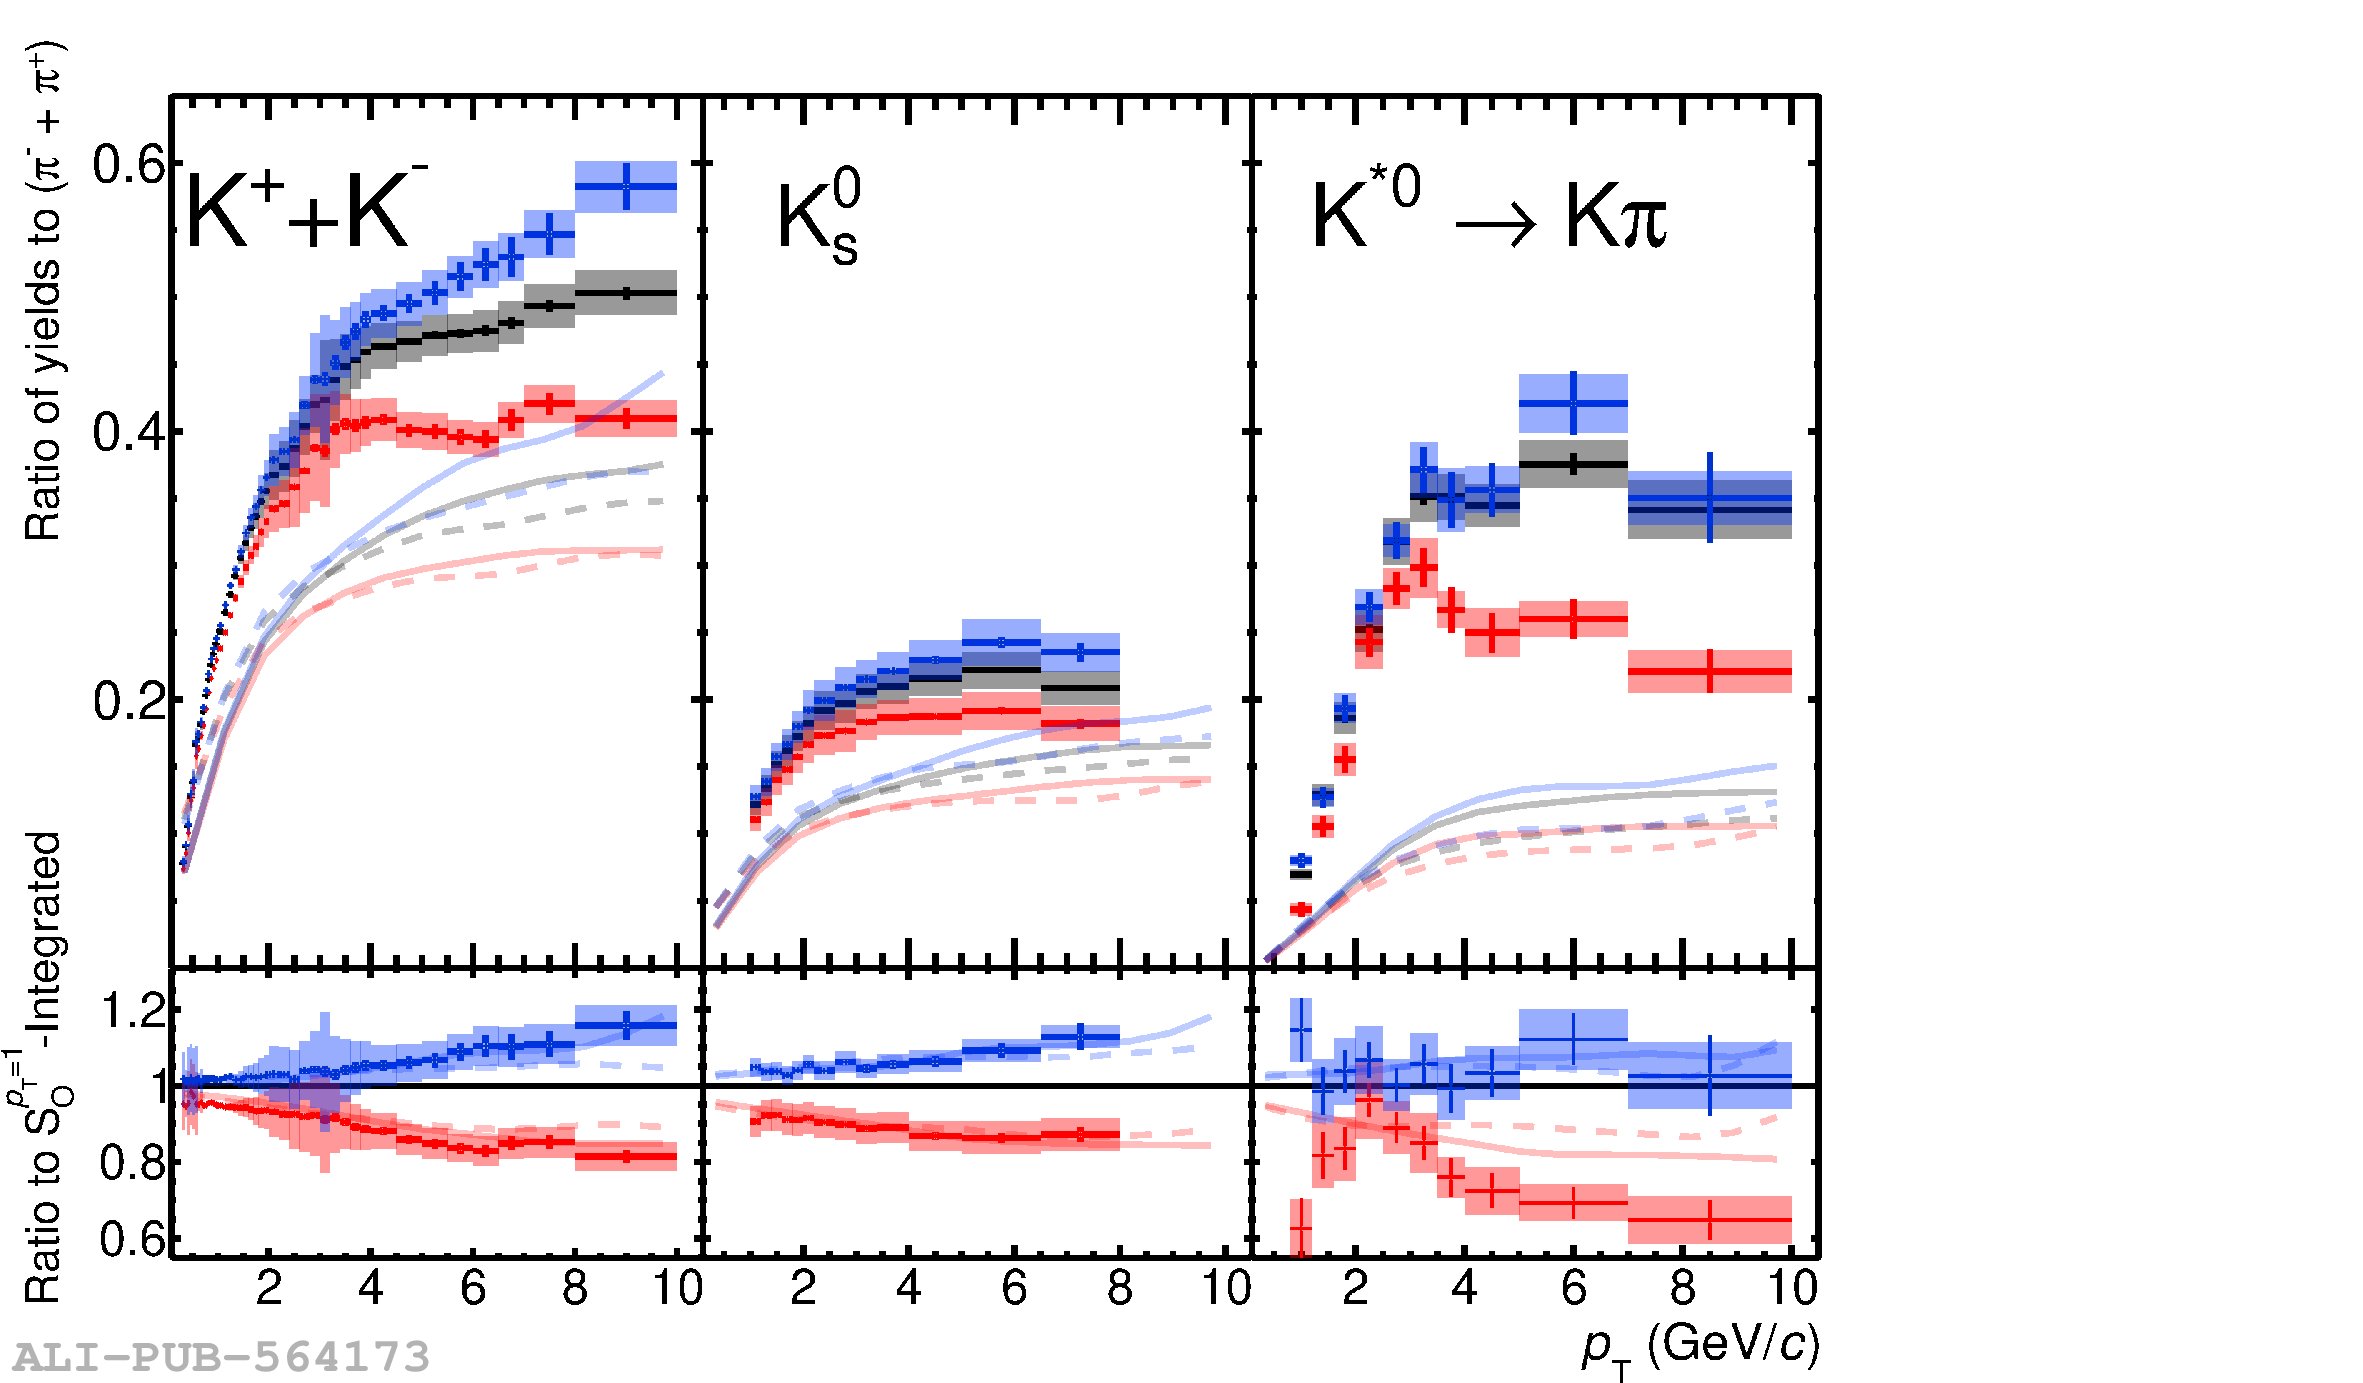 |
Figure 8
Top panels show hadron-to-$\pi$ ratios for 0--10\% $S_0^{p_{\rm T}=1}$ classes selected for the 0--1\% $N_{\rm tracklet}^{|\eta|< 0.8}$ multiplicity events. Figure 7 and Fig.8 both contain the same experimental data, but the vertical ranges are modified to accommodate the model predictions. Bottom panels present the hadron-to-$\pi$ double ratios of $S_0^{p_{\rm T}=1}$ classes relative to $S_0^{p_{\rm T}=1}$ integrated high-multiplicity events. Statistical and systematic uncertainties are shown by bars and boxes, respectively. Experimental results are compared with predictions from Herwig 7.2 and EPOS-LHC. The fluctuations present in the Herwig 7.2 predictions are due to statistical limitations. | 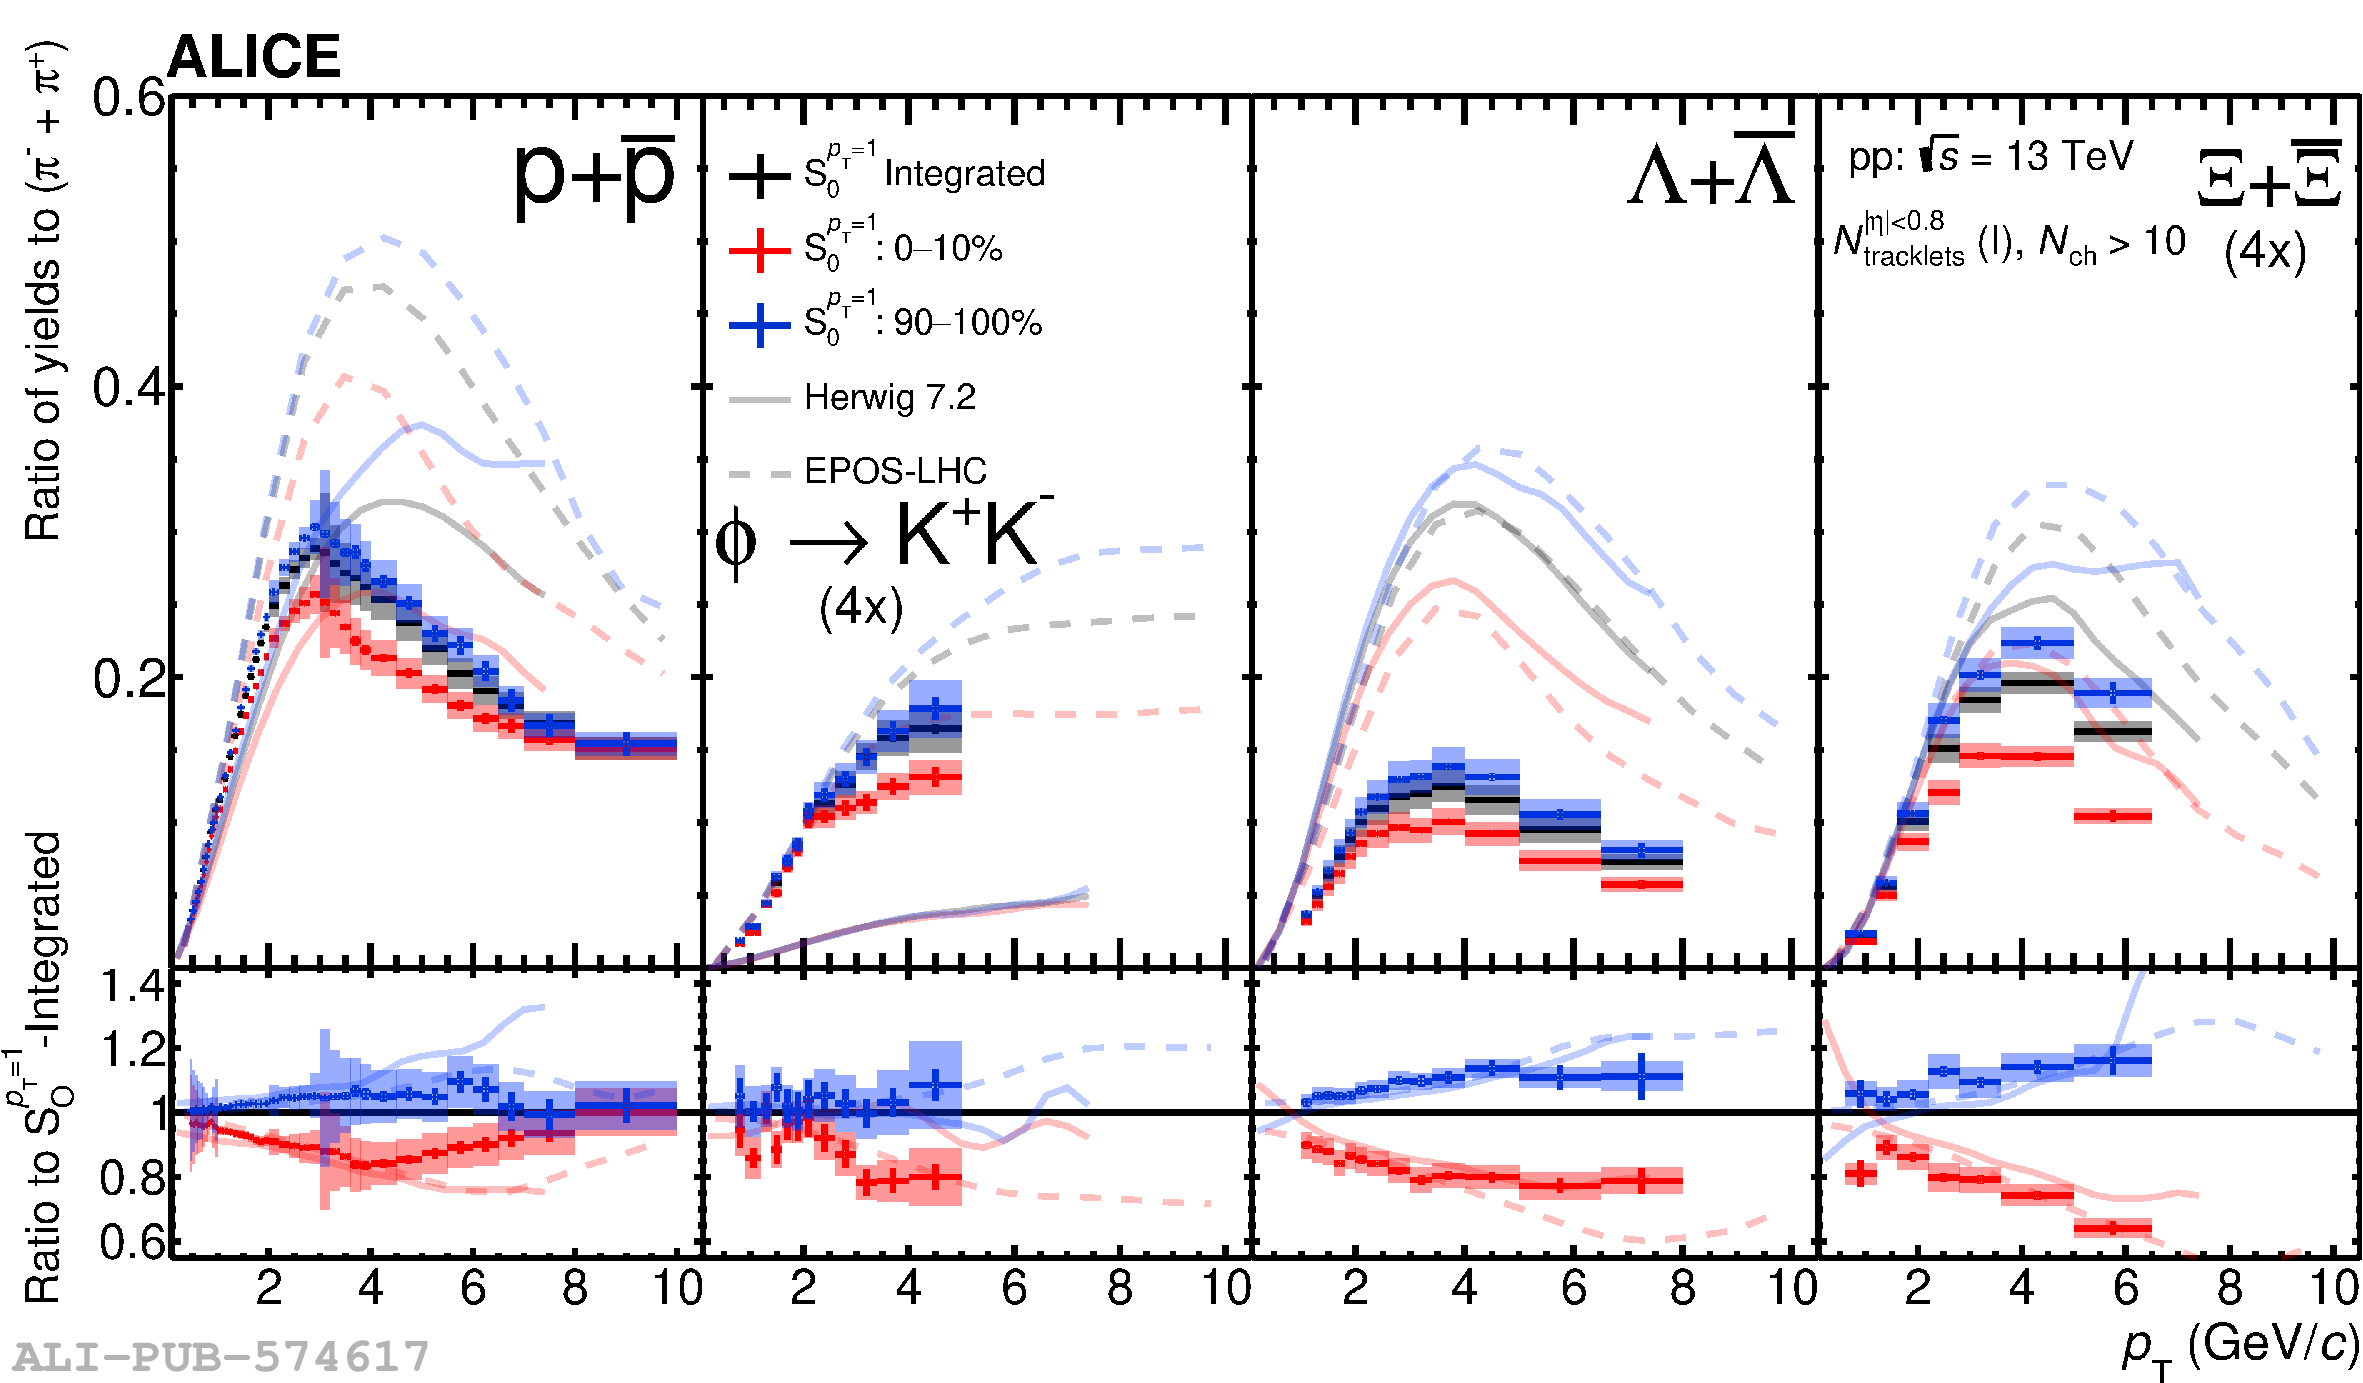  |
Figure 9
Top panels show hadron-to-$\pi$ ratios for 0--1\% $S_0^{p_{\rm T}=1}$ classes selected for the 0--1\% $N_{\rm tracklet}^{|\eta|< 0.8}$ multiplicity events. Bottom panels present the hadron-to-$\pi$ double ratios of $S_0^{p_{\rm T}=1}$ classes relative to $S_0^{p_{\rm T}=1}$ integrated high-multiplicity events. Statistical and systematic uncertainties are shown by bars and boxes, respectively. Experimental results are compared with predictions from PYTHIA 8.2 Monash and Ropes. | 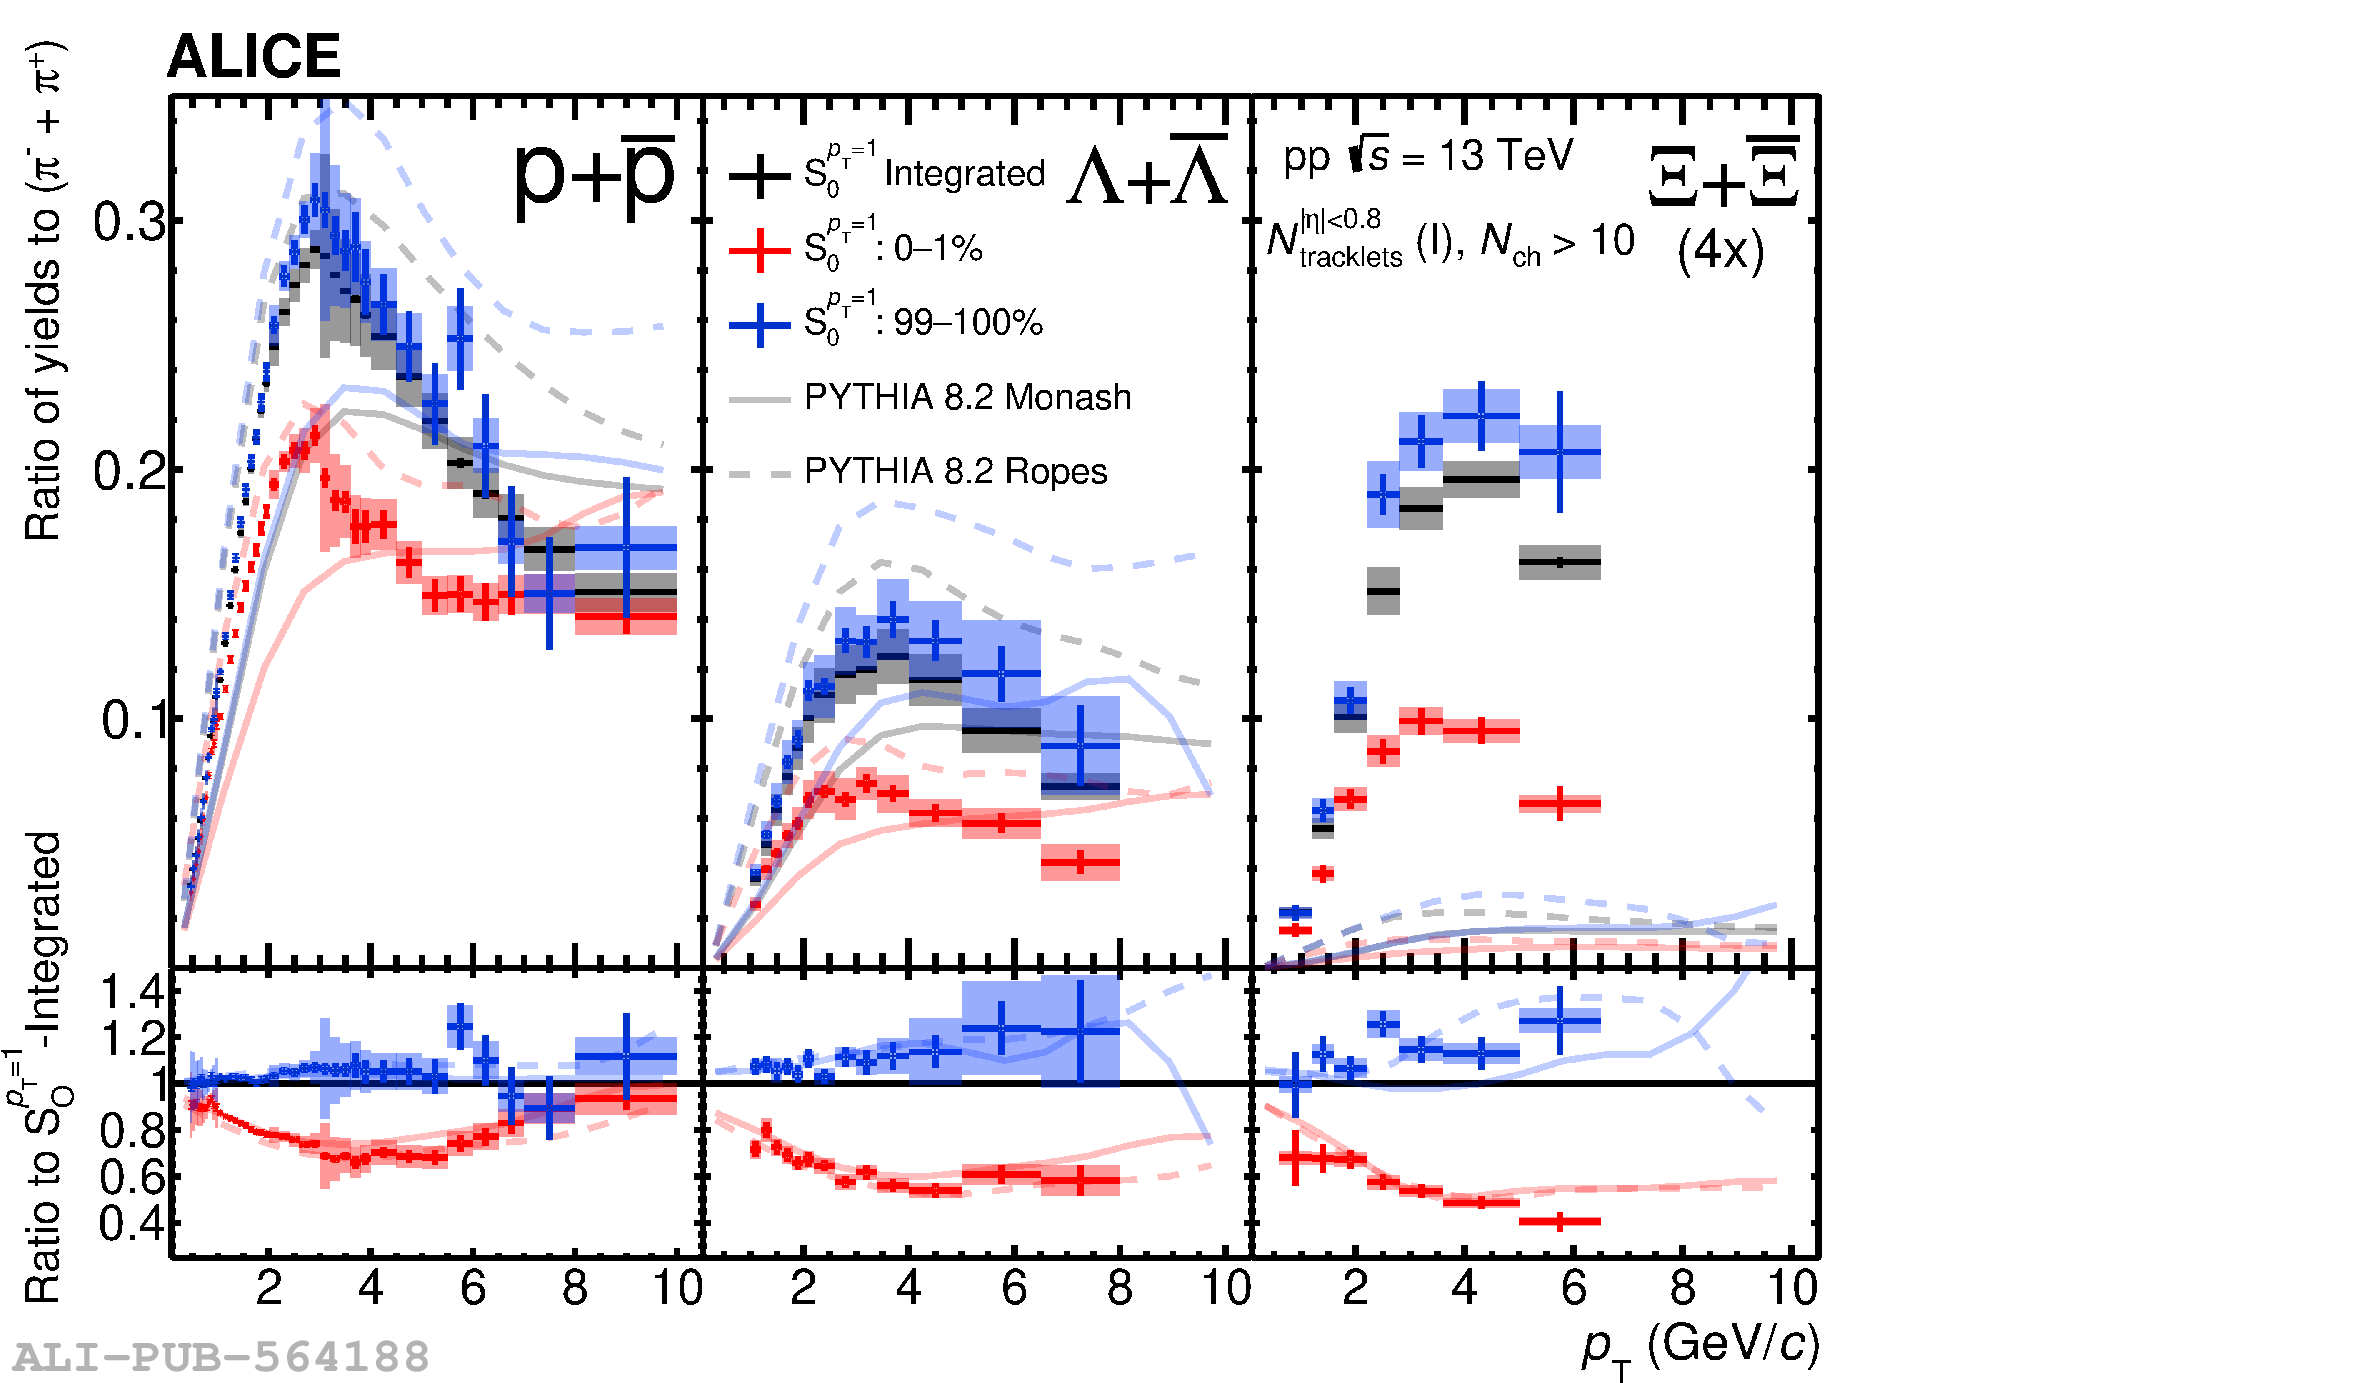  |
Figure 10
Top panels show hadron-to-$\pi$ ratios for 0--1\% $S_0^{p_{\rm T}=1}$ classes selected for the 0--1\% $N_{\rm tracklet}^{|\eta|< 0.8}$ multiplicity events. Figure 9and Fig.10both contain the same experimental data, but the vertical ranges are modified to accommodate the model predictions. Bottom panels present the hadron-to-$\pi$ double ratios of $S_0^{p_{\rm T}=1}$ classes relative to $S_0^{p_{\rm T}=1}$ integrated high-multiplicity events. Statistical and systematic uncertainties are shown by bars and boxes, respectively. Experimental results are compared with predictions from Herwig 7.2 and EPOS-LHC. The large fluctuations present in the Herwig 7.2 predictions are due to statistical limitations. | 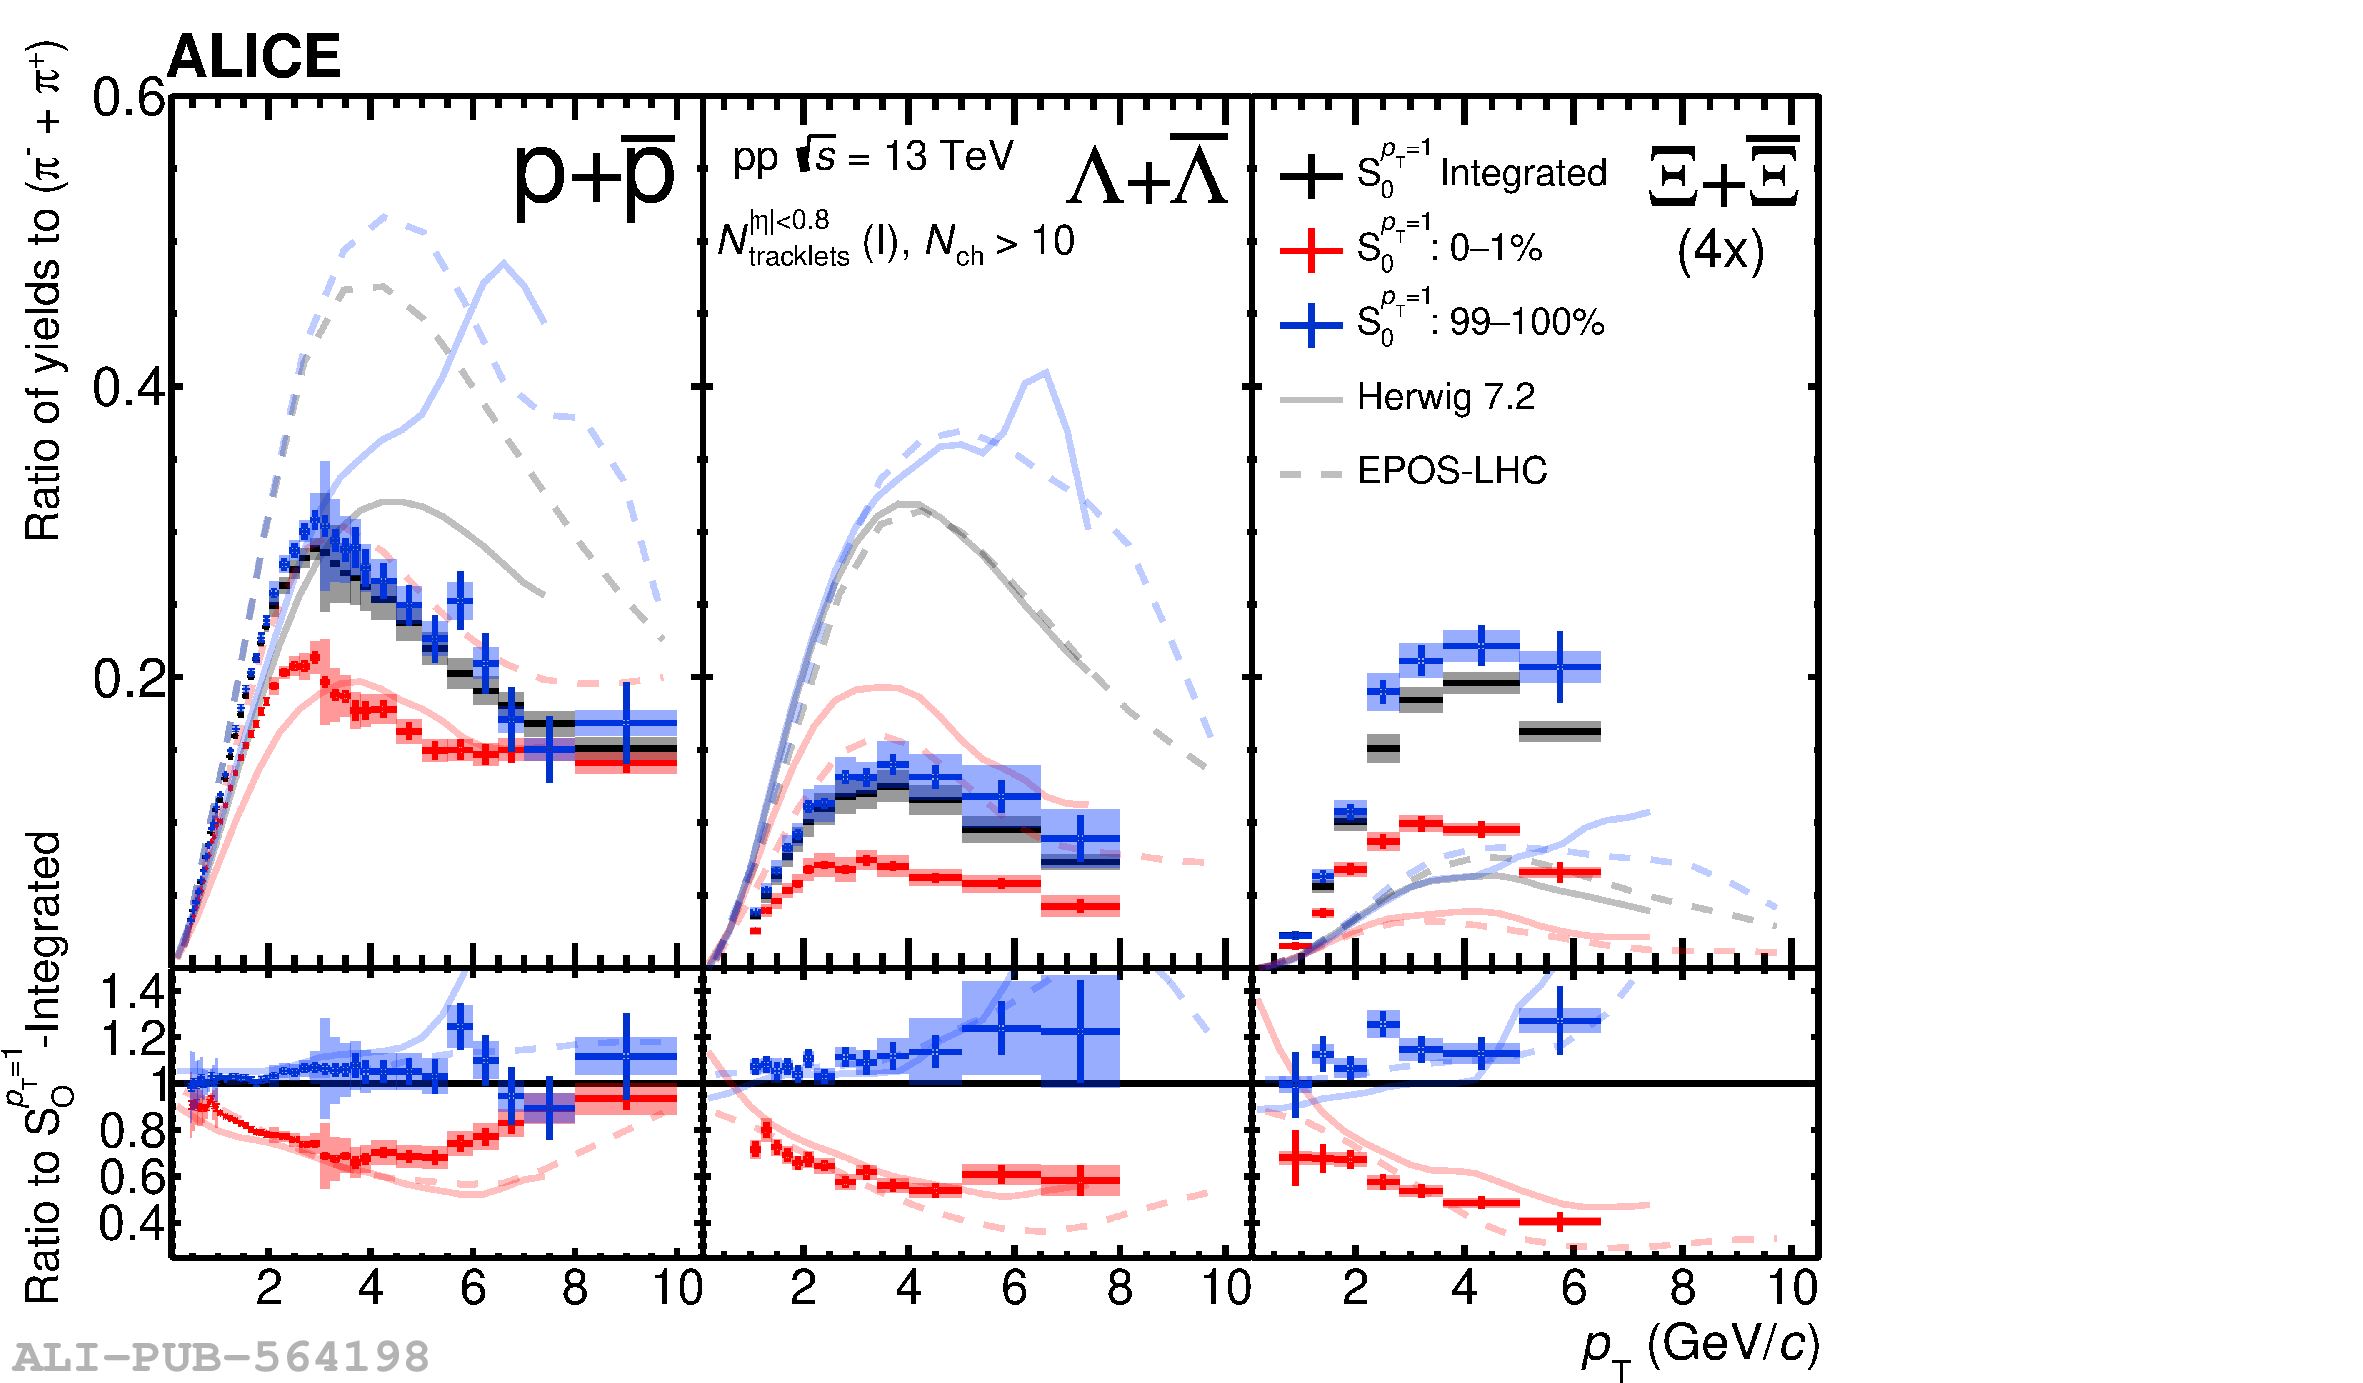 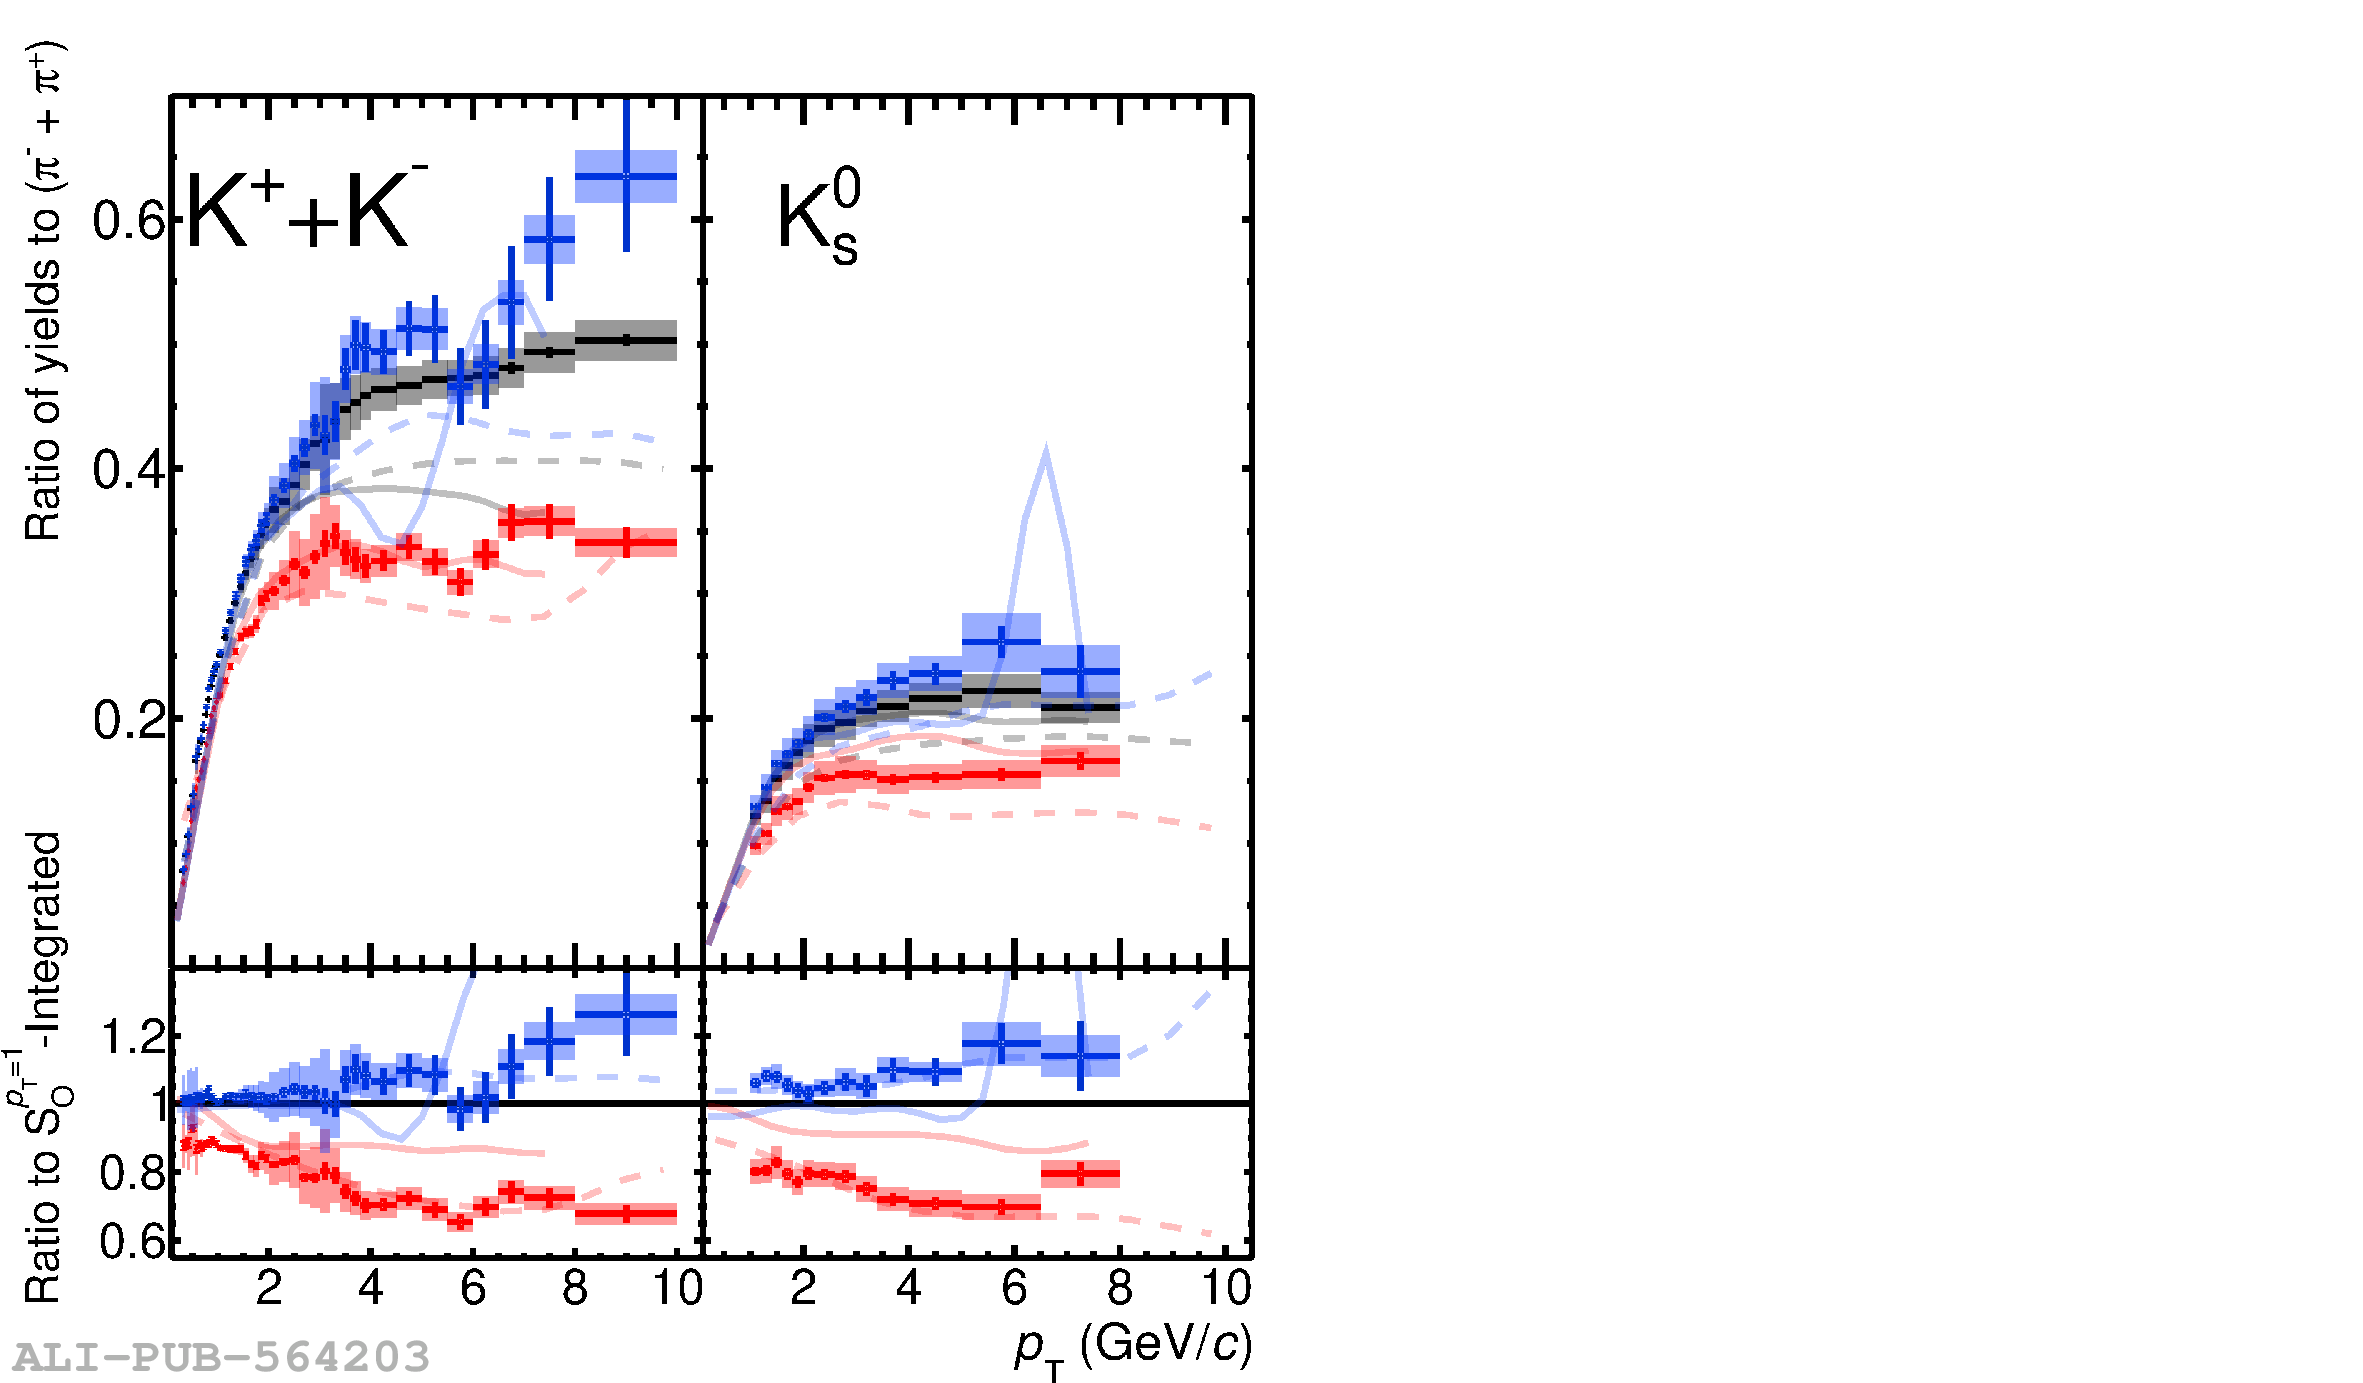 |
Figure 11
p/$\pi$, $\Lambda$/K and $\Xi/\phi$ ratios for different $S_0^{p_{\rm T}=1}$ classes are obtained for $0-1\%$ events measured by $N_{\rm tracklet}^{|\eta|< 0.8}$. Lower panels show the ratio to $S_0^{p_{\rm T}=1}$-integrated event selection. Statistical and total systematic uncertainties are shown by bars and boxes, respectively. The curves represent different model predictions of the same measurement. Note that for the p/$\pi$, the same data points are presented in Fig.7, with an extended $p_{\rm T}$ range now covering 10--20 GeV/$c$. | 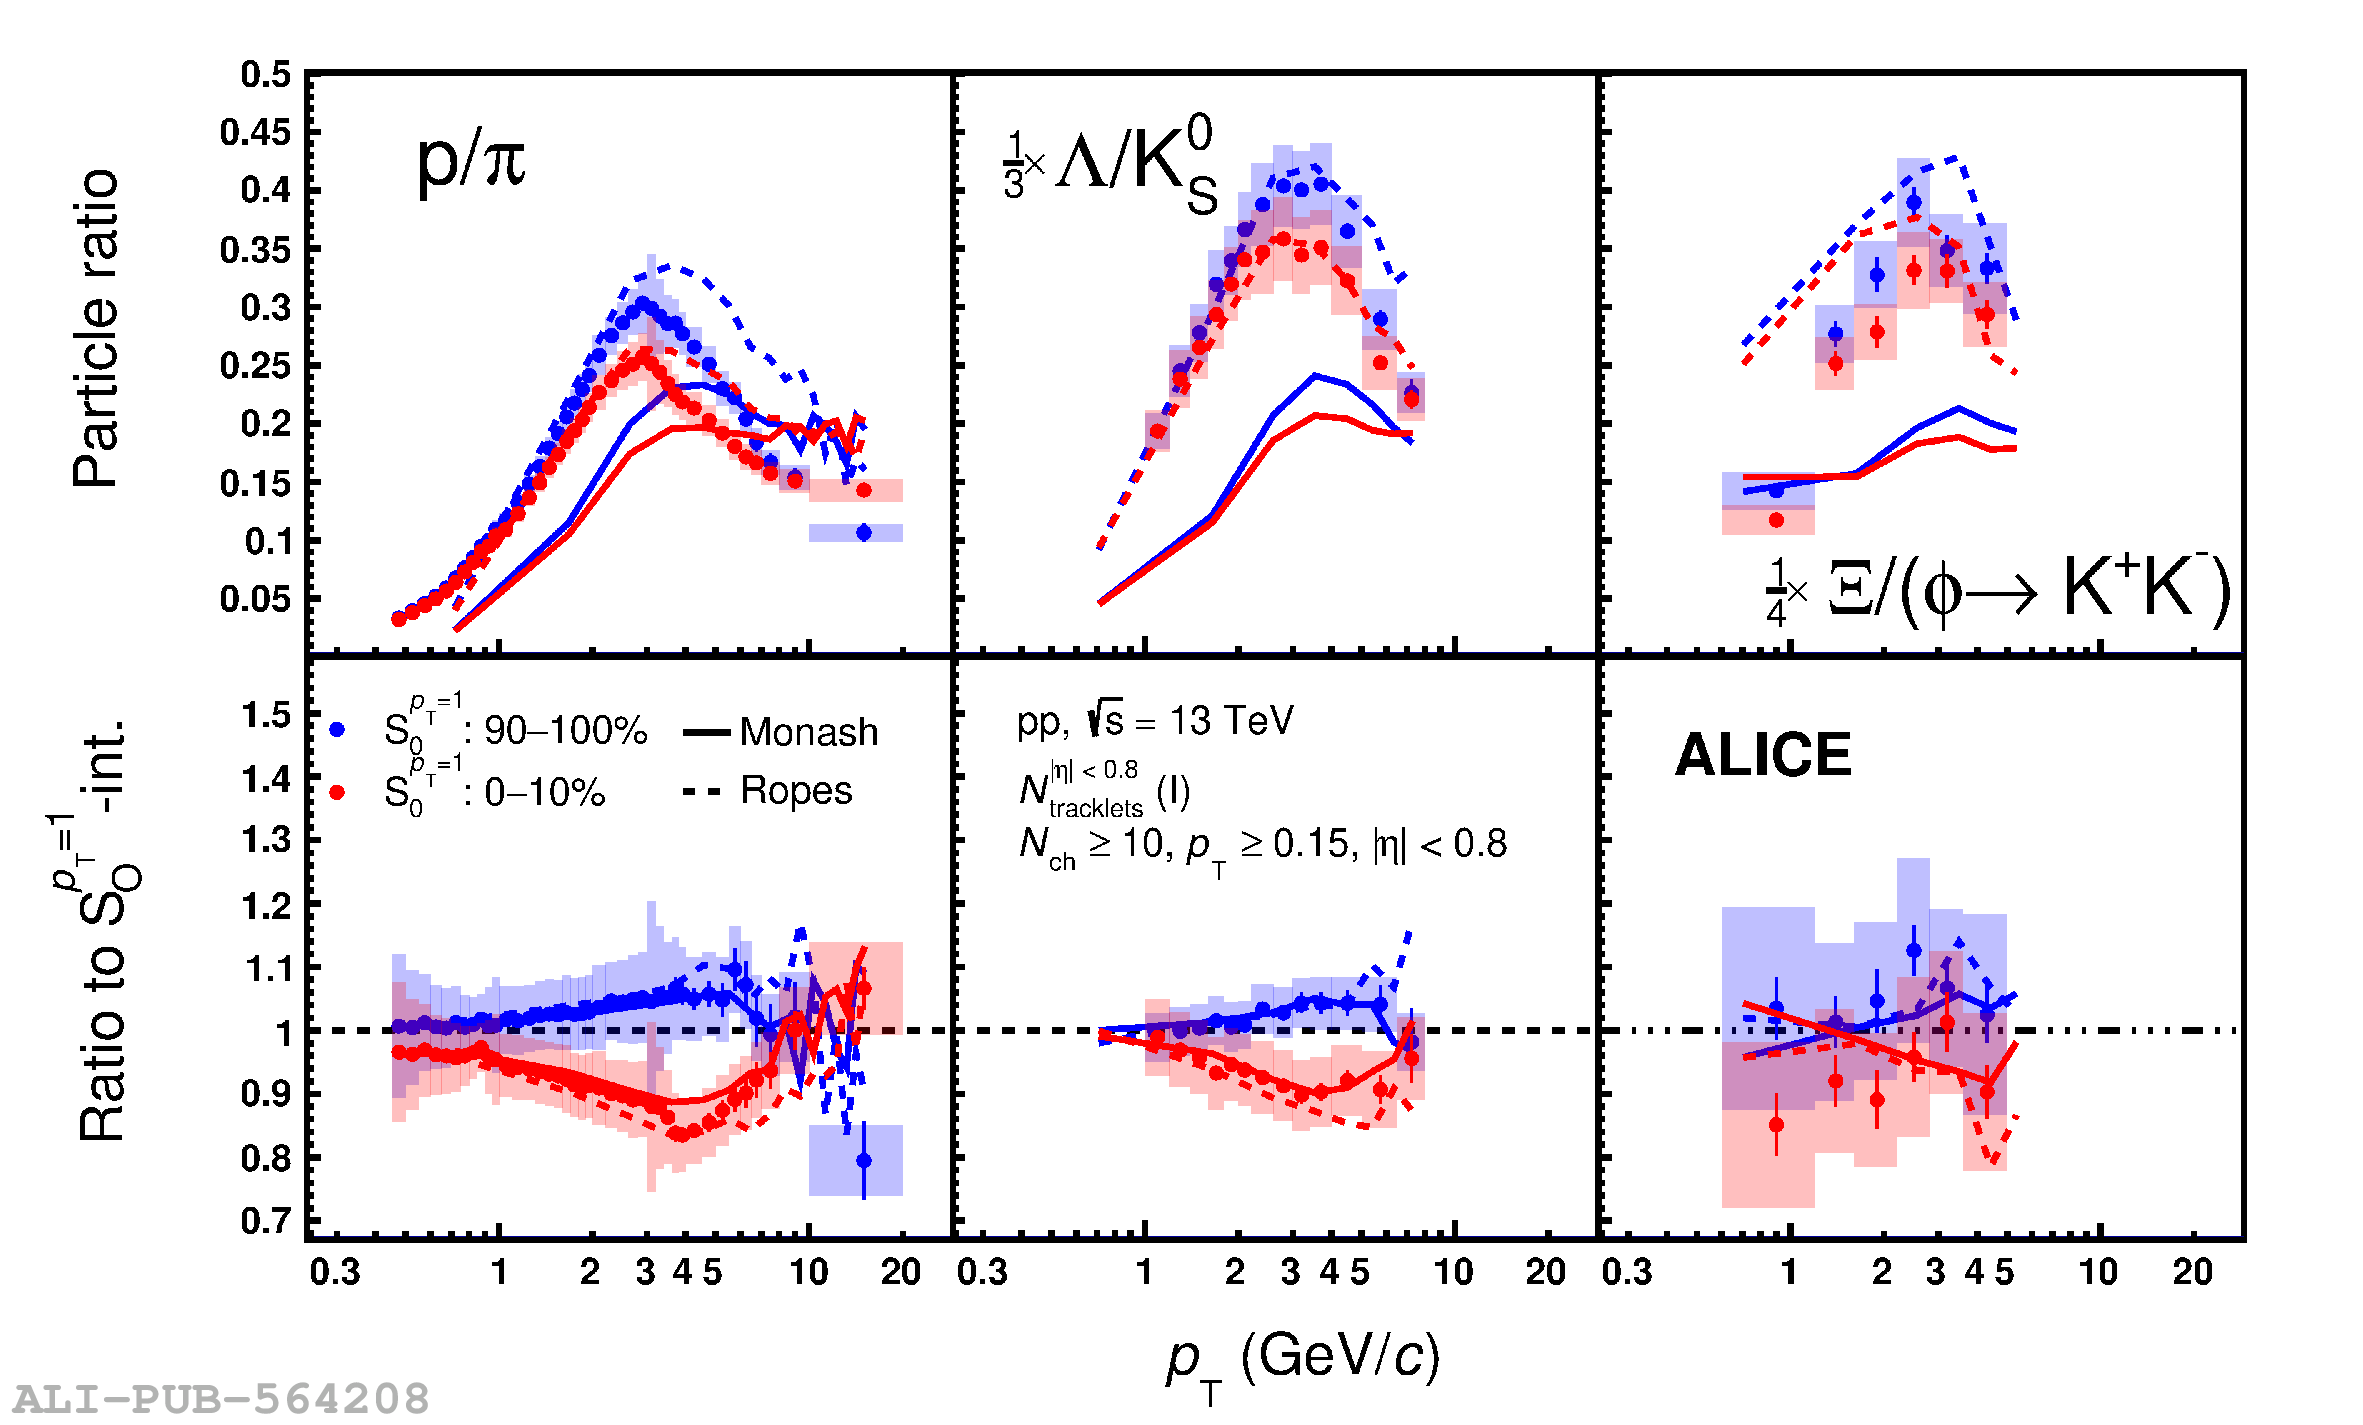 |
Figure 12
The neutral-to-charged K$^{0}_{\rm S}$/K ratios as a function of different multiplicity estimators and $S_0^{p_{\rm T}=1}$. Statistical and total systematic uncertainties are shown by bars and boxes, respectively. The curves represent PYTHIA 8.2 model predictions of the same measurement. | 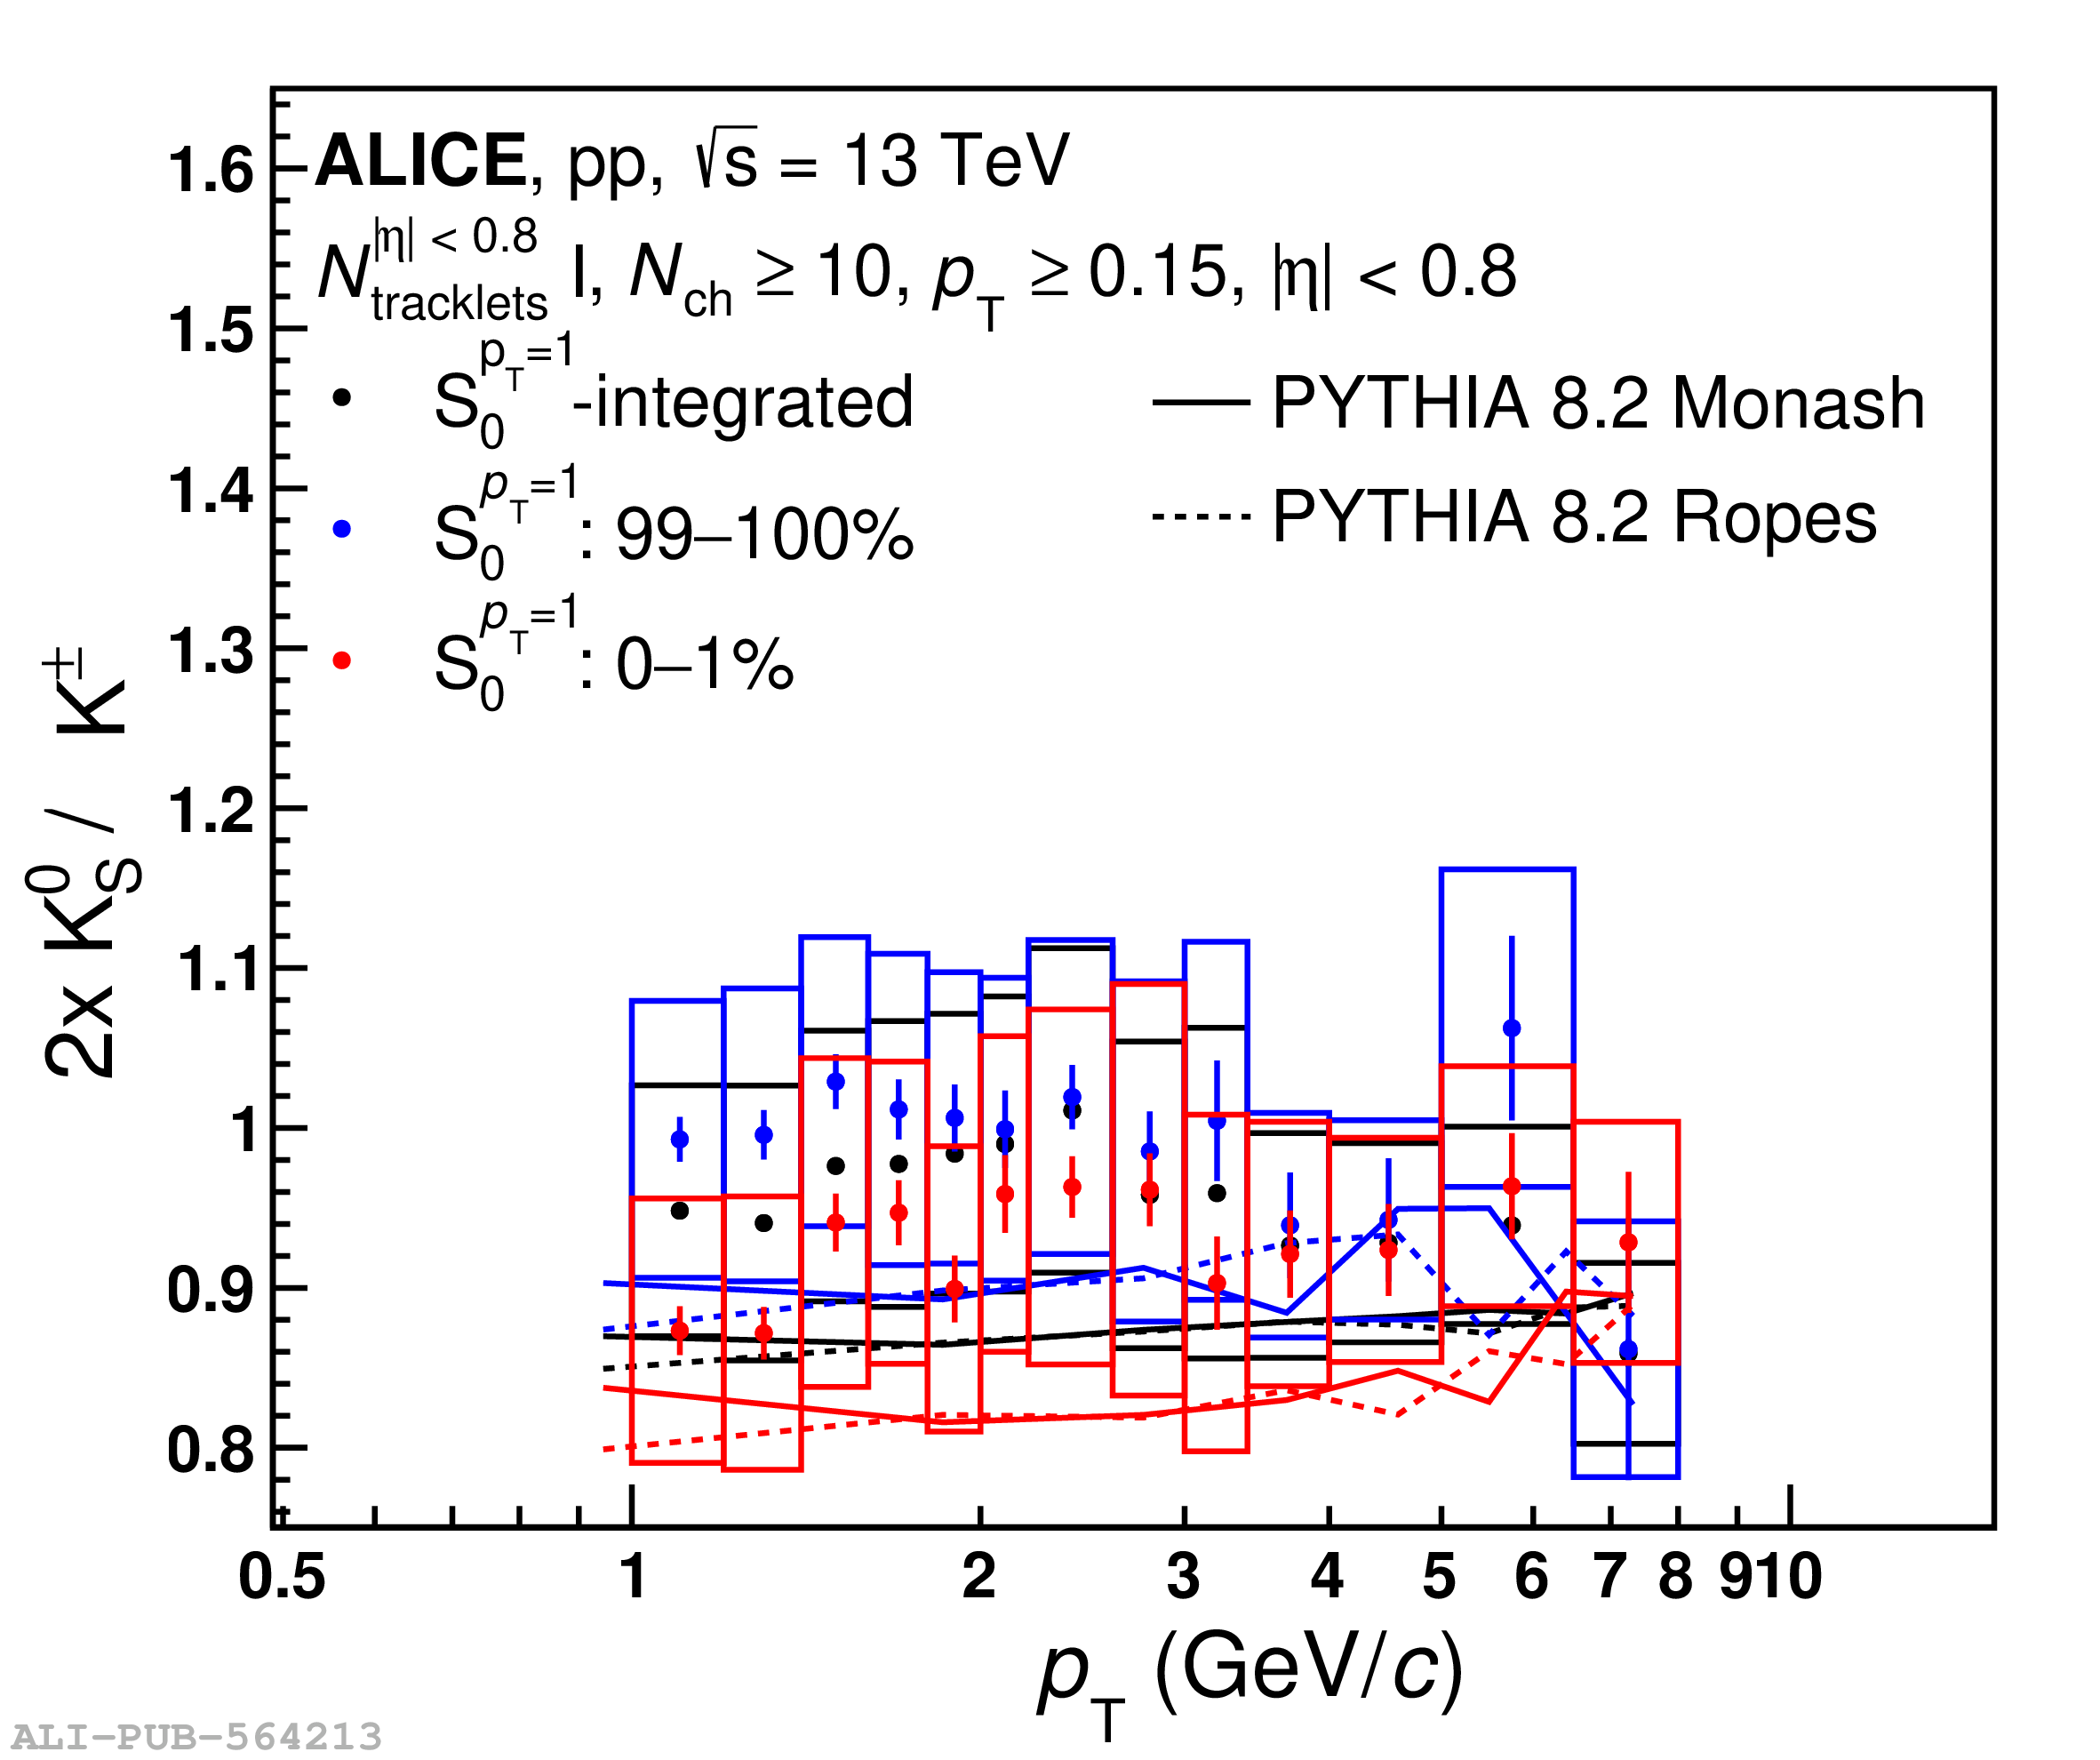 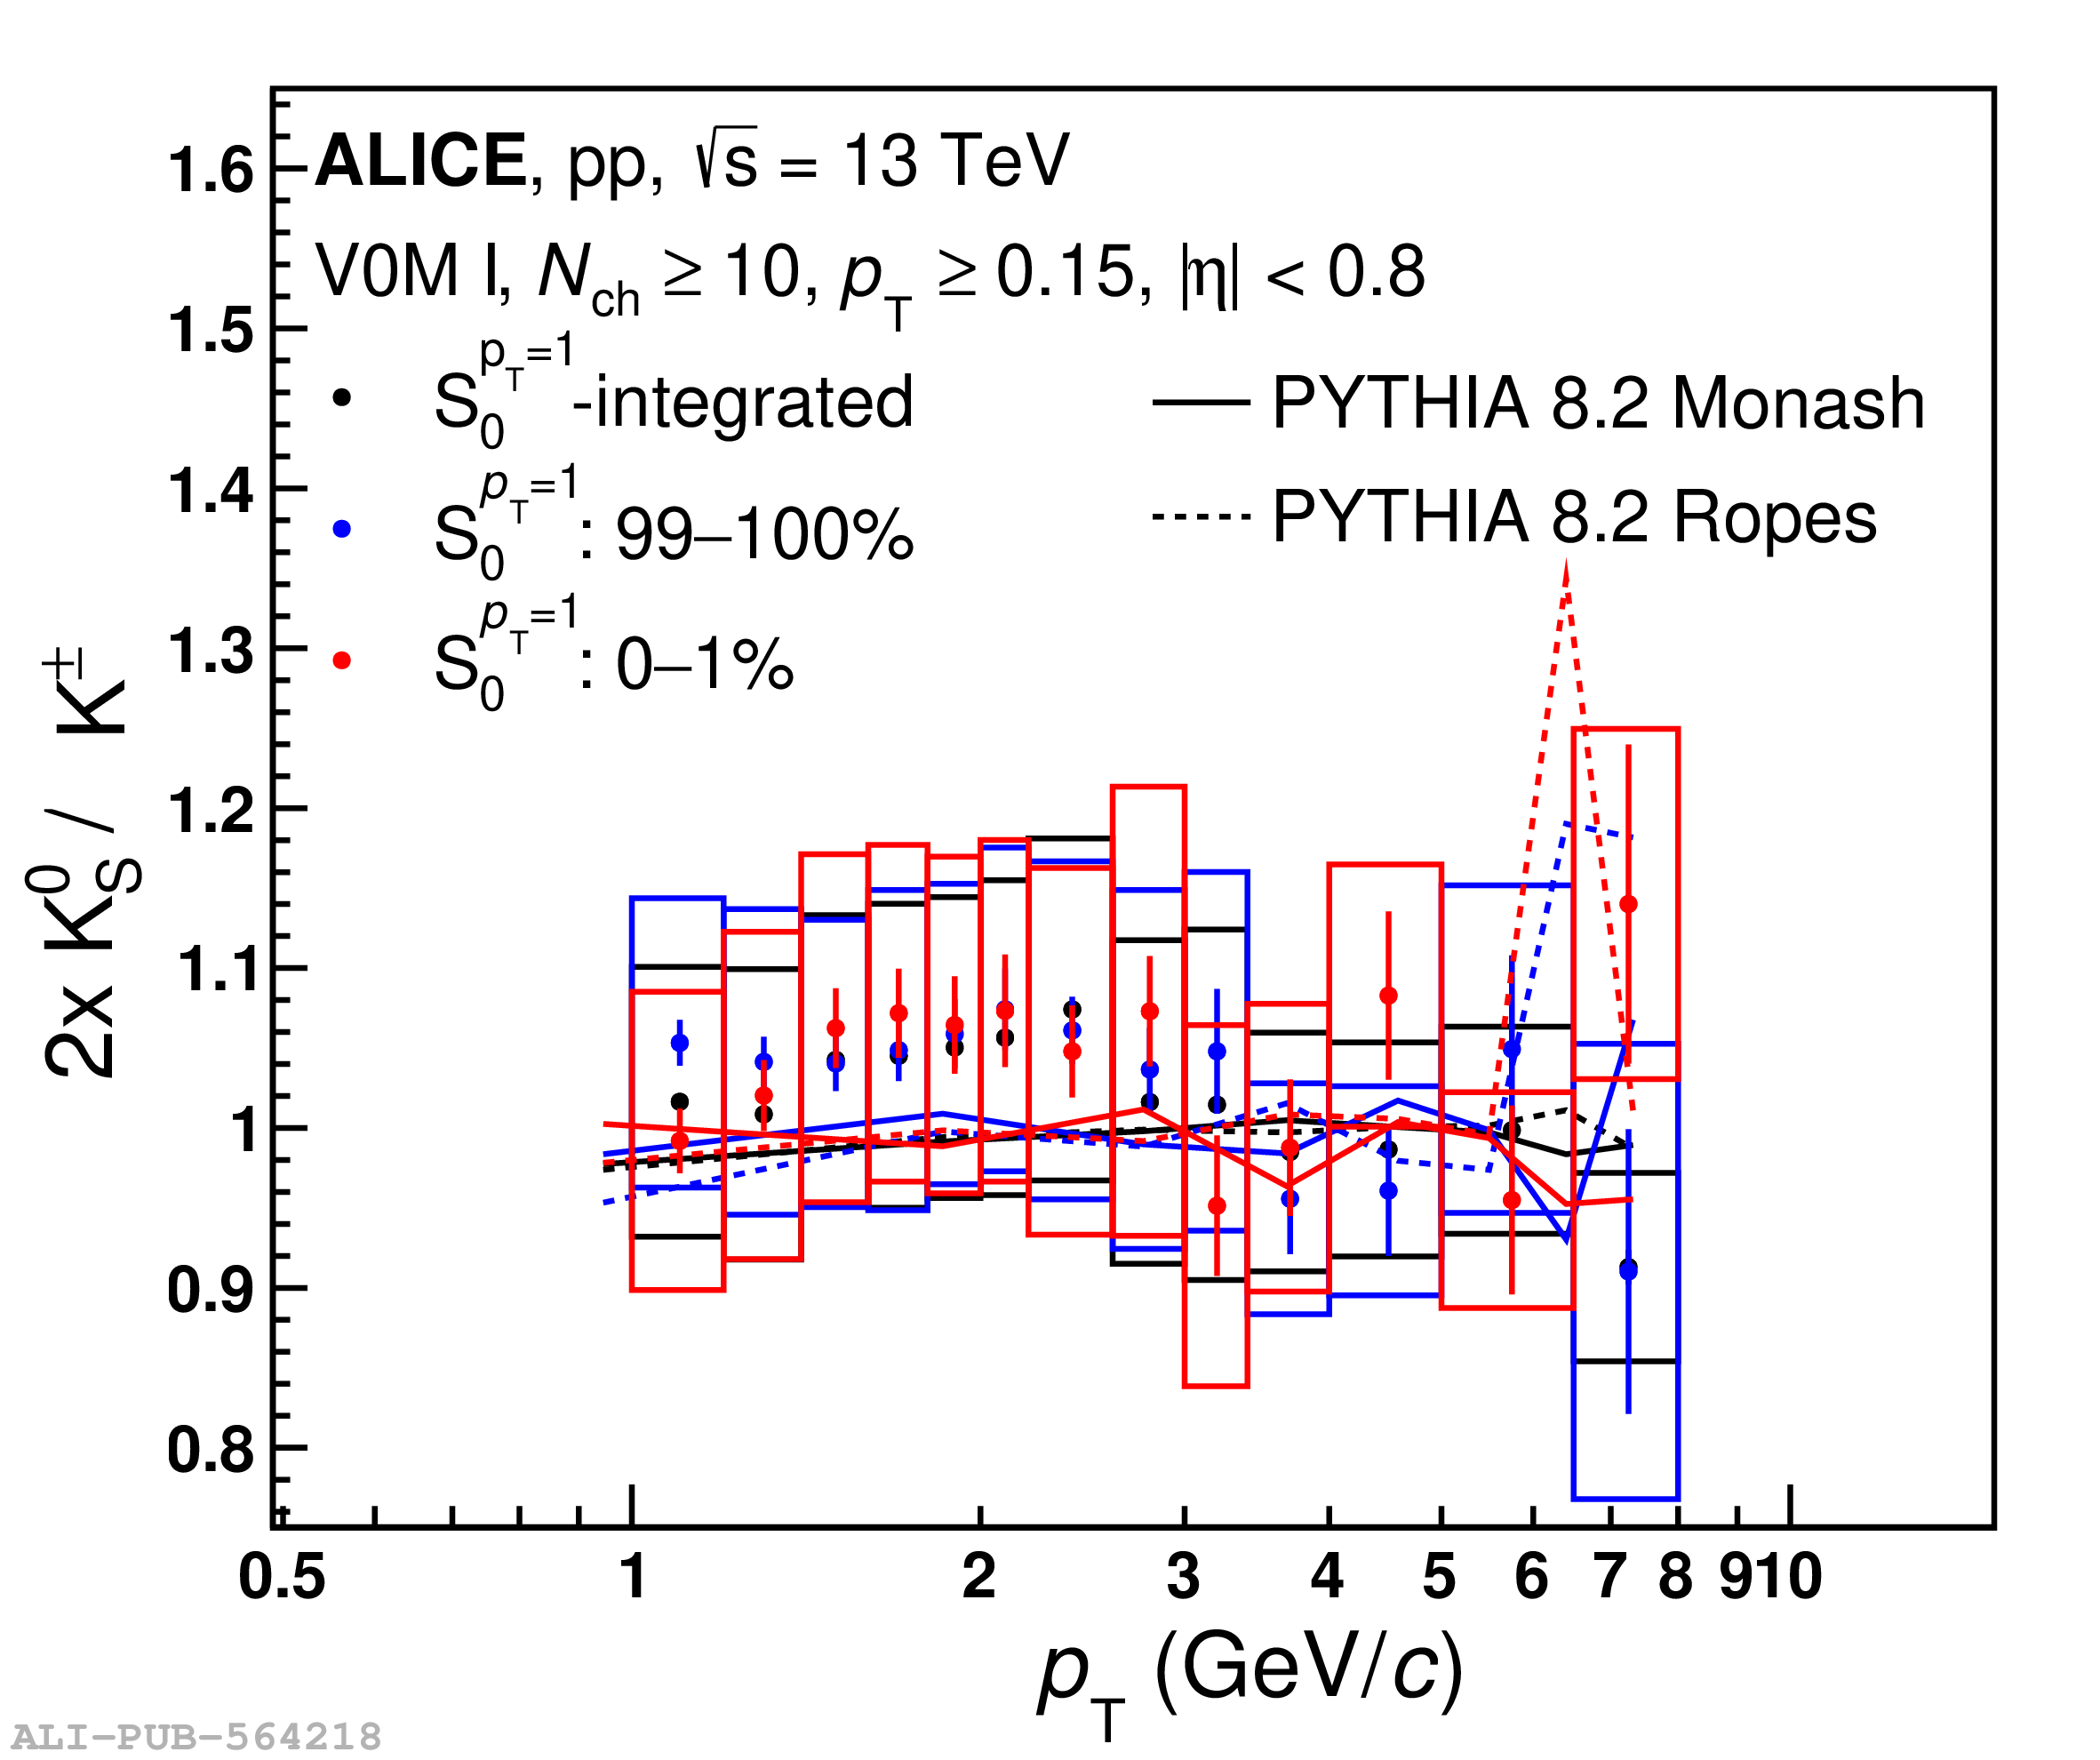 |
Figure 13
The double ratios of integrated yields as a function of $S_0^{p_{\rm T}=1}$ for the spectra of top-1\% $N_{\rm tracklet}^{|\eta|< 0.8}$. The yield is estimated by extrapolating the spectra over the full $p_{\rm T}$ range. Statistical and systematic uncertainties are shown by bars and boxes, respectively. The grey band around unity represents the systematic uncertainty of the pion measurement. |  |
Figure 14
The double ratios of integrated yield as a function of $S_0^{p_{\rm T}=1}$ are represented in the top-1\% of $N_{\rm tracklet}^{|\eta|< 0.8}$. The yields are integrated in the measured \pt ranges for each particle species. Statistical and systematic uncertainties are shown by bars and boxes, respectively. The curves represent different model predictions of the same measurement. The grey band around unity represents the systematic uncertainty of the pion measurement. | 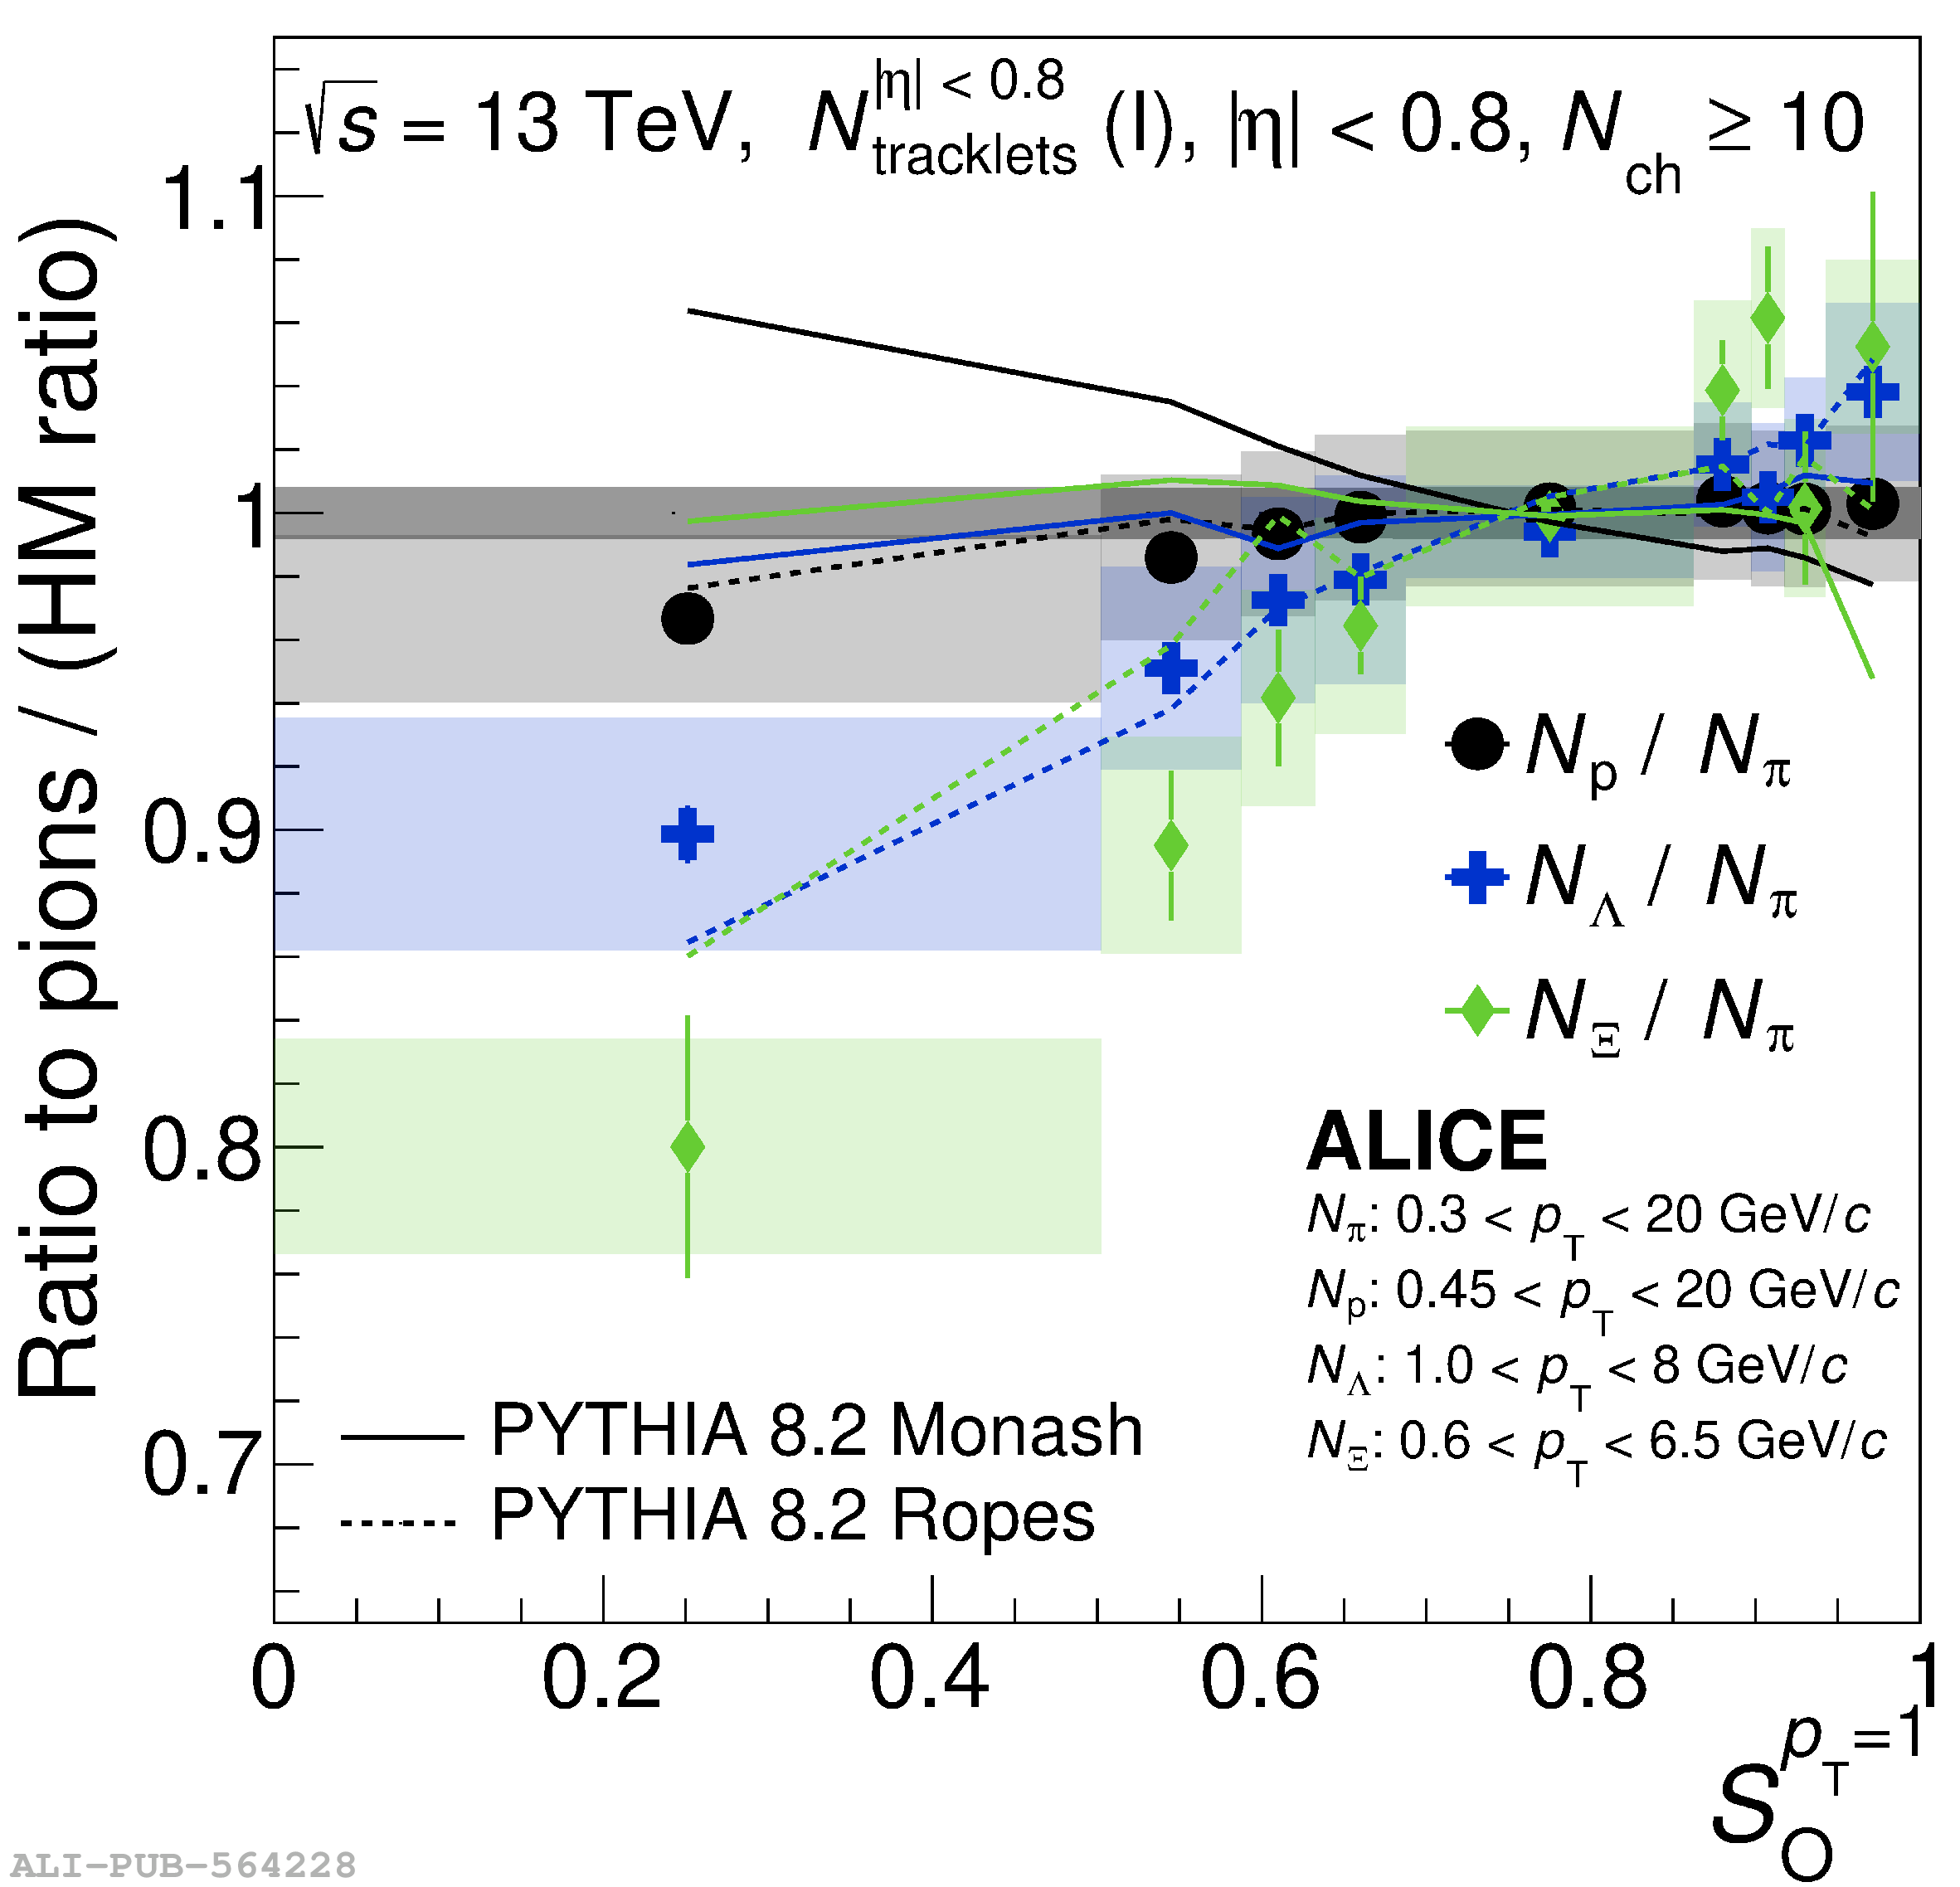 |
Figure 15
The double ratios of integrated yield as a function of $S_0^{p_{\rm T}=1}$ are represented in the top-1\% of $N_{\rm tracklet}^{|\eta|< 0.8}$. The yields are integrated in measured \pt ranges for each particle species. Statistical and systematic uncertainties are shown by bars and boxes, respectively. Figure 14 and Fig.15 both contain the same experimental data, but the vertical ranges are modified to accommodate the model predictions. The curves represent different model predictions of the same measurement. The grey band around unity represents the systematic uncertainty of the pion measurement. | 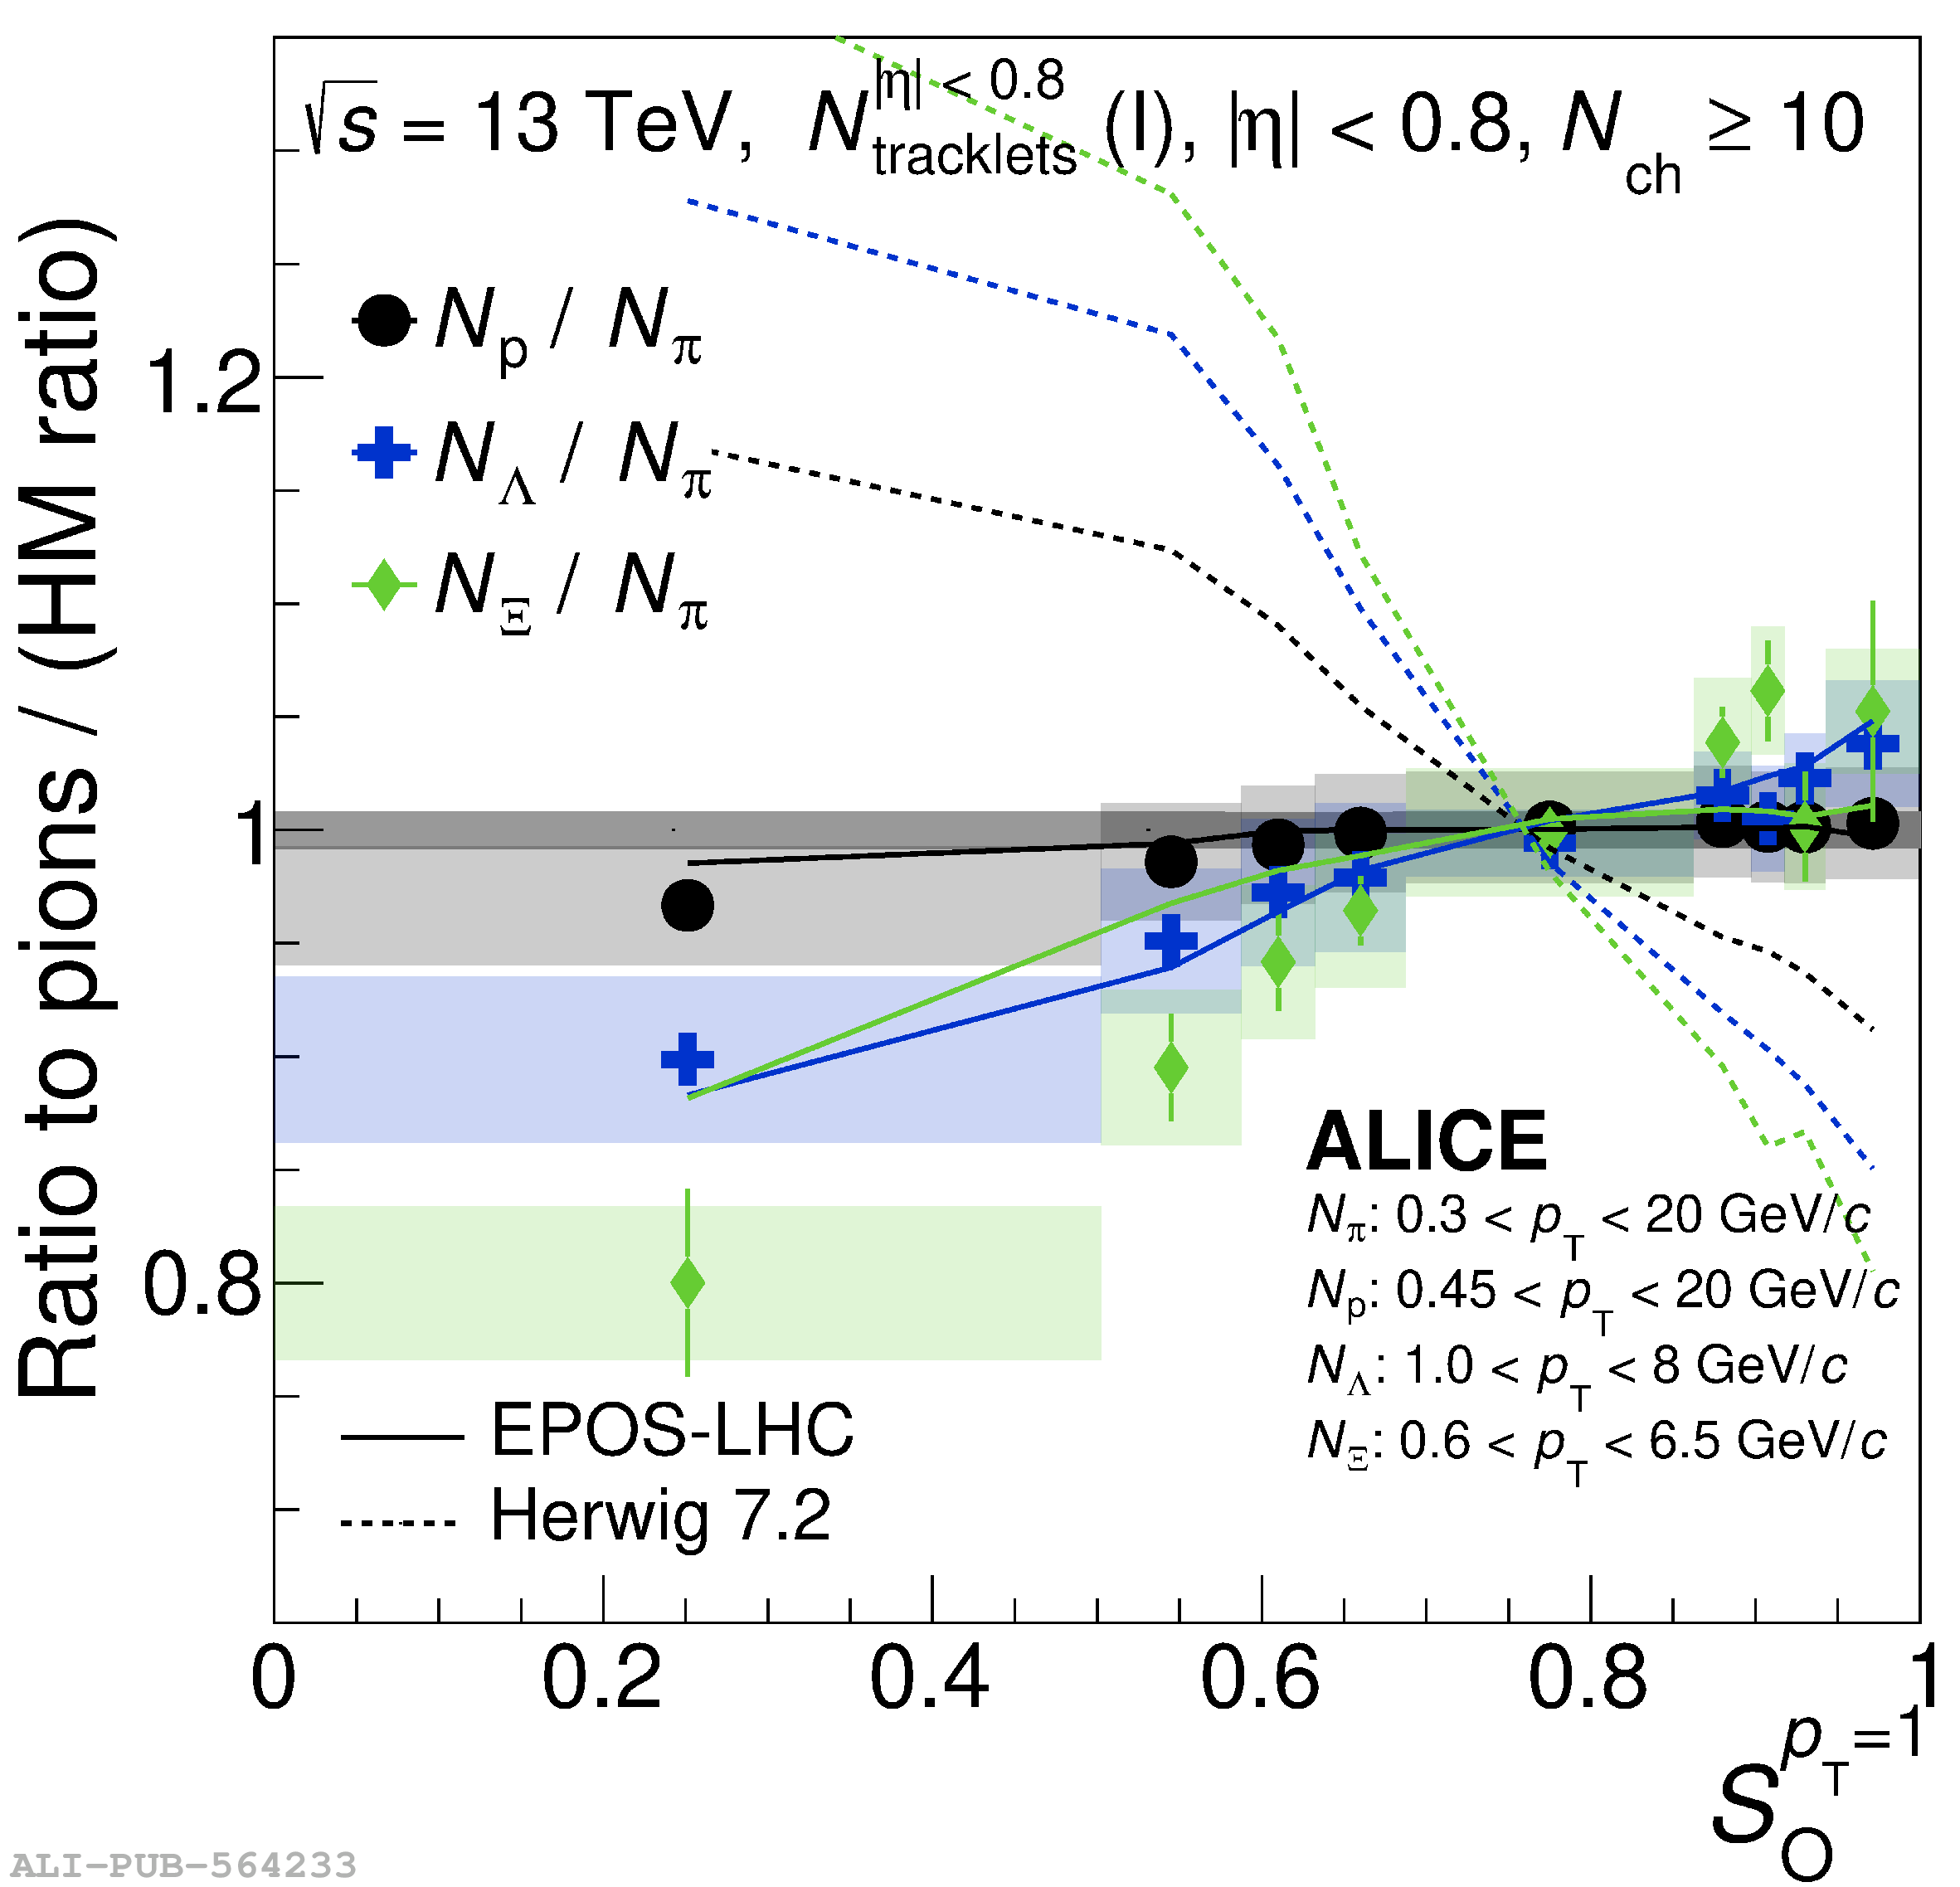 |
Figure 16
Top panels show hadron-to-$\pi$ ratios for 0--1\% $S_0^{p_{\rm T}=1}$ classes selected for the 0--10\% $N_{\rm tracklet}^{|\eta|< 0.8}$ multiplicity events. Bottom panels present the hadron-to-$\pi$ double-ratios of $S_0^{p_{\rm T}=1}$ classes relative to $S_0^{p_{\rm T}=1}$-integrated high-multiplicity events. Statistical and systematic uncertainties are shown by bars and boxes, respectively. Experimental results are compared with predictions from EPOS-LHC and PYTHIA 8.2 Rope hadronization framework. |   |
Figure 17
Top panels show hadron-to-$\pi$ ratios for 0--10\% $S_0^{p_{\rm T}=1}$ classes selected for the 0--1\% V0M multiplicity events. Bottom panels present the hadron-to-$\pi$ double-ratios of $S_0^{p_{\rm T}=1}$ classes relative to $S_0^{p_{\rm T}=1}$ integrated high-multiplicity events. Statistical and systematic uncertainties are shown by bars and boxes, respectively. Experimental results are compared with predictions from EPOS-LHC and PYTHIA 8.2 Rope hadronization framework. | 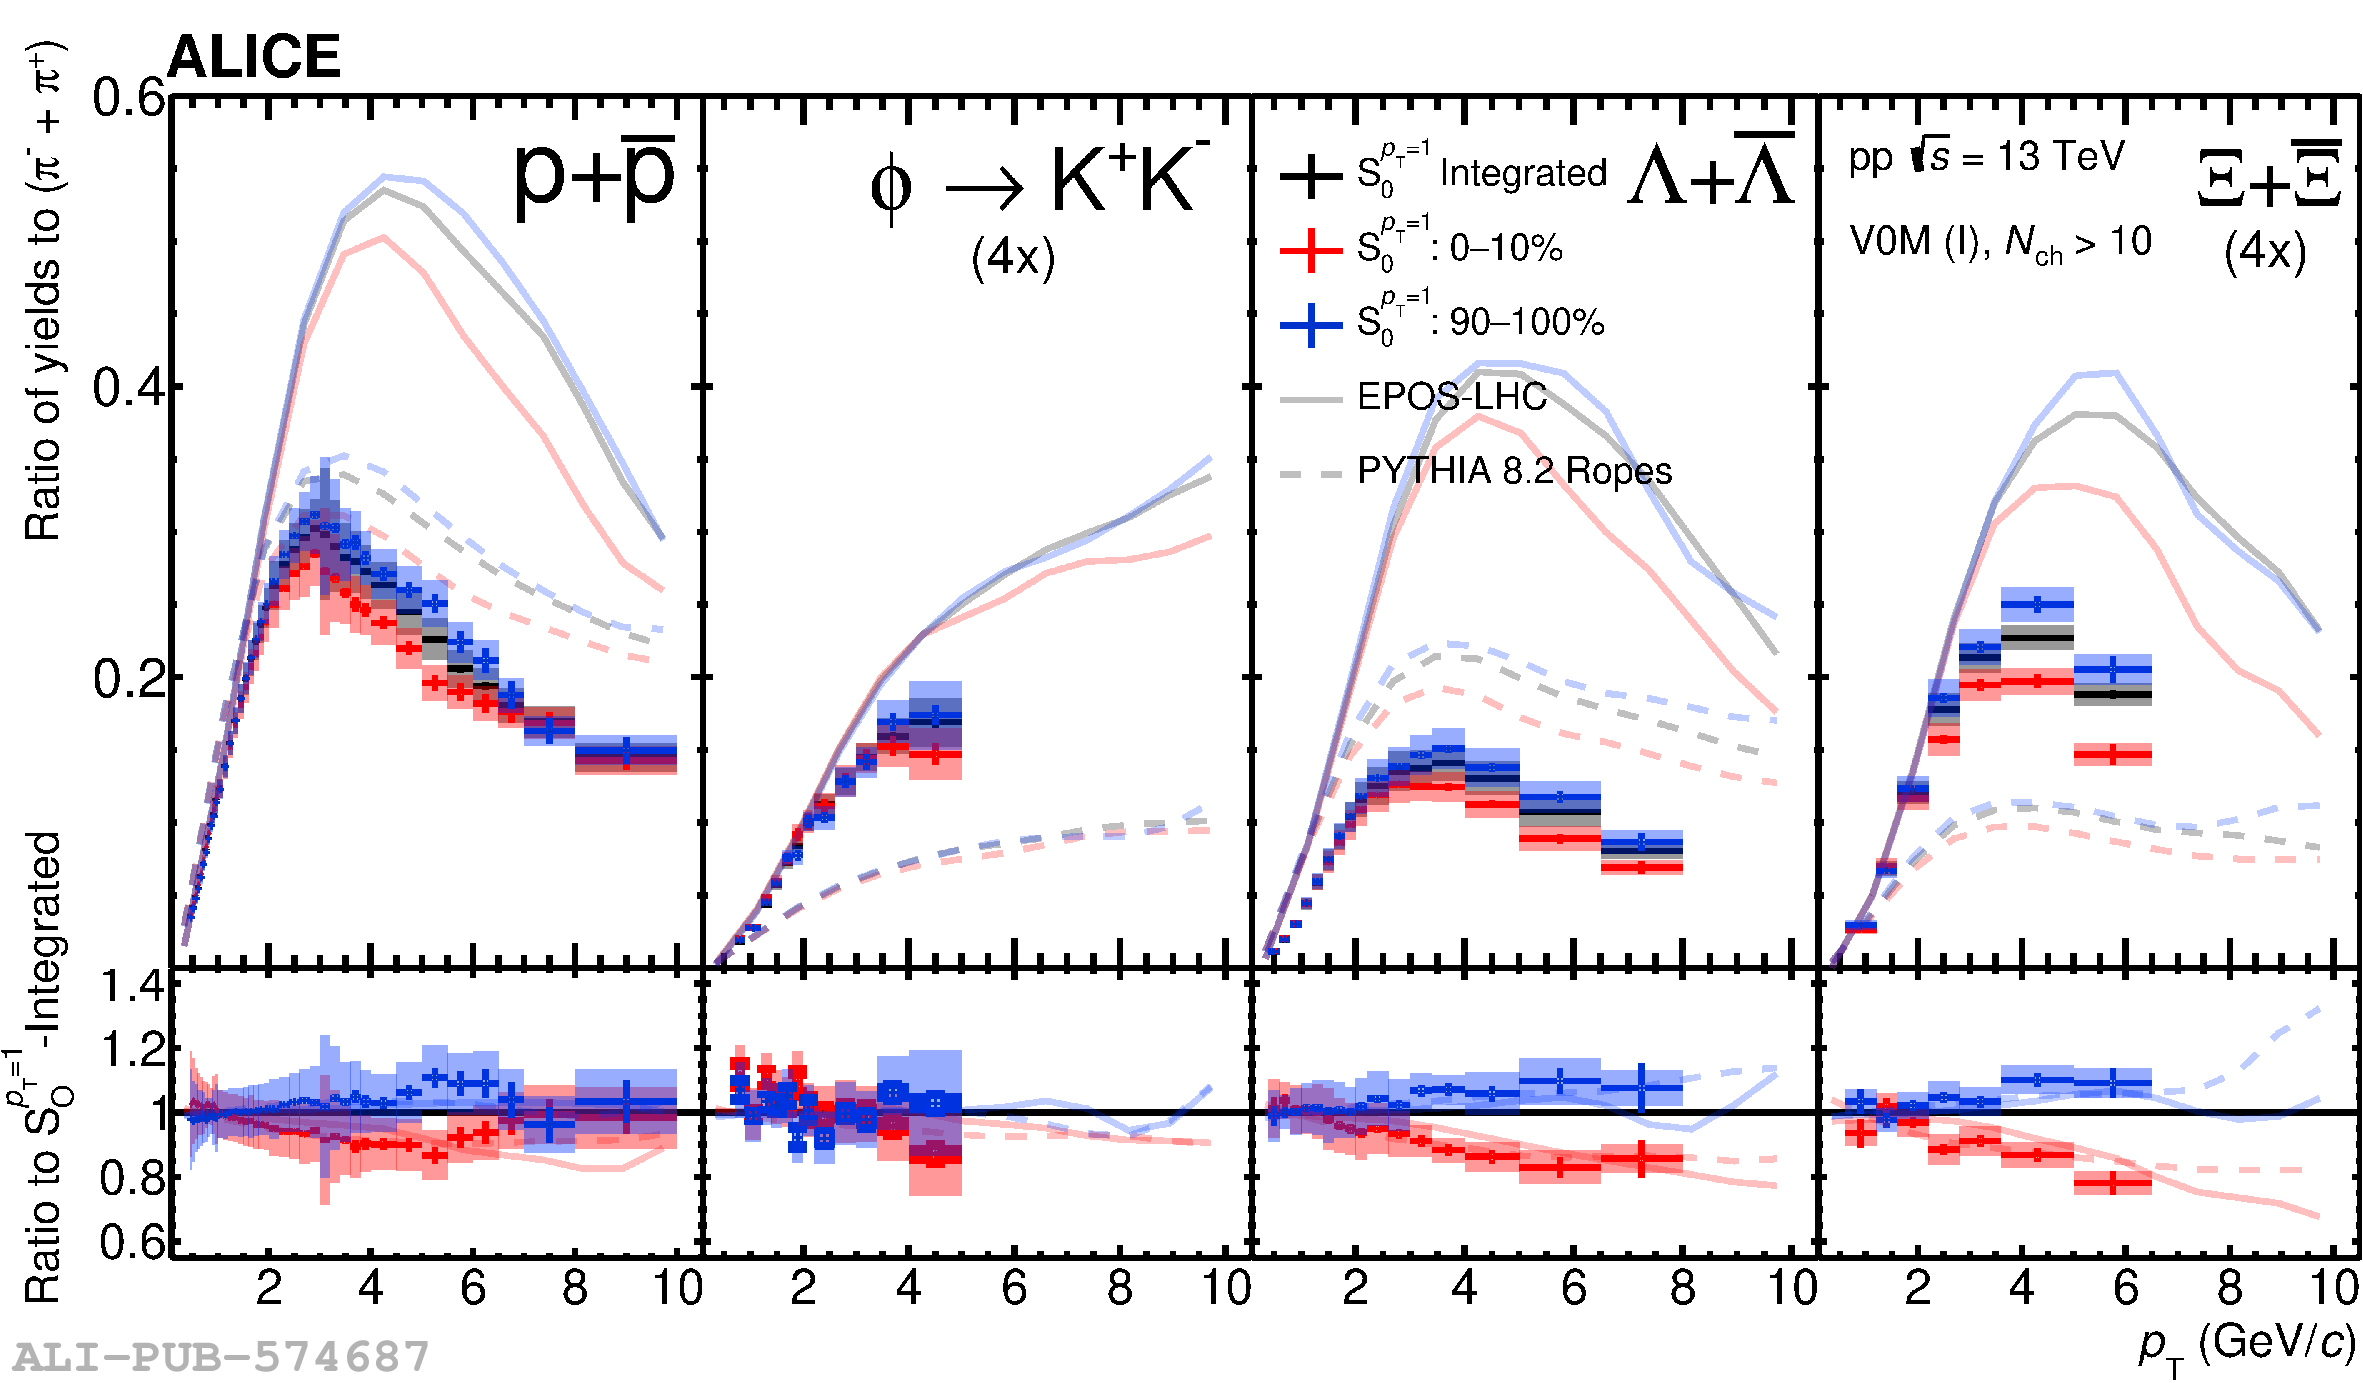 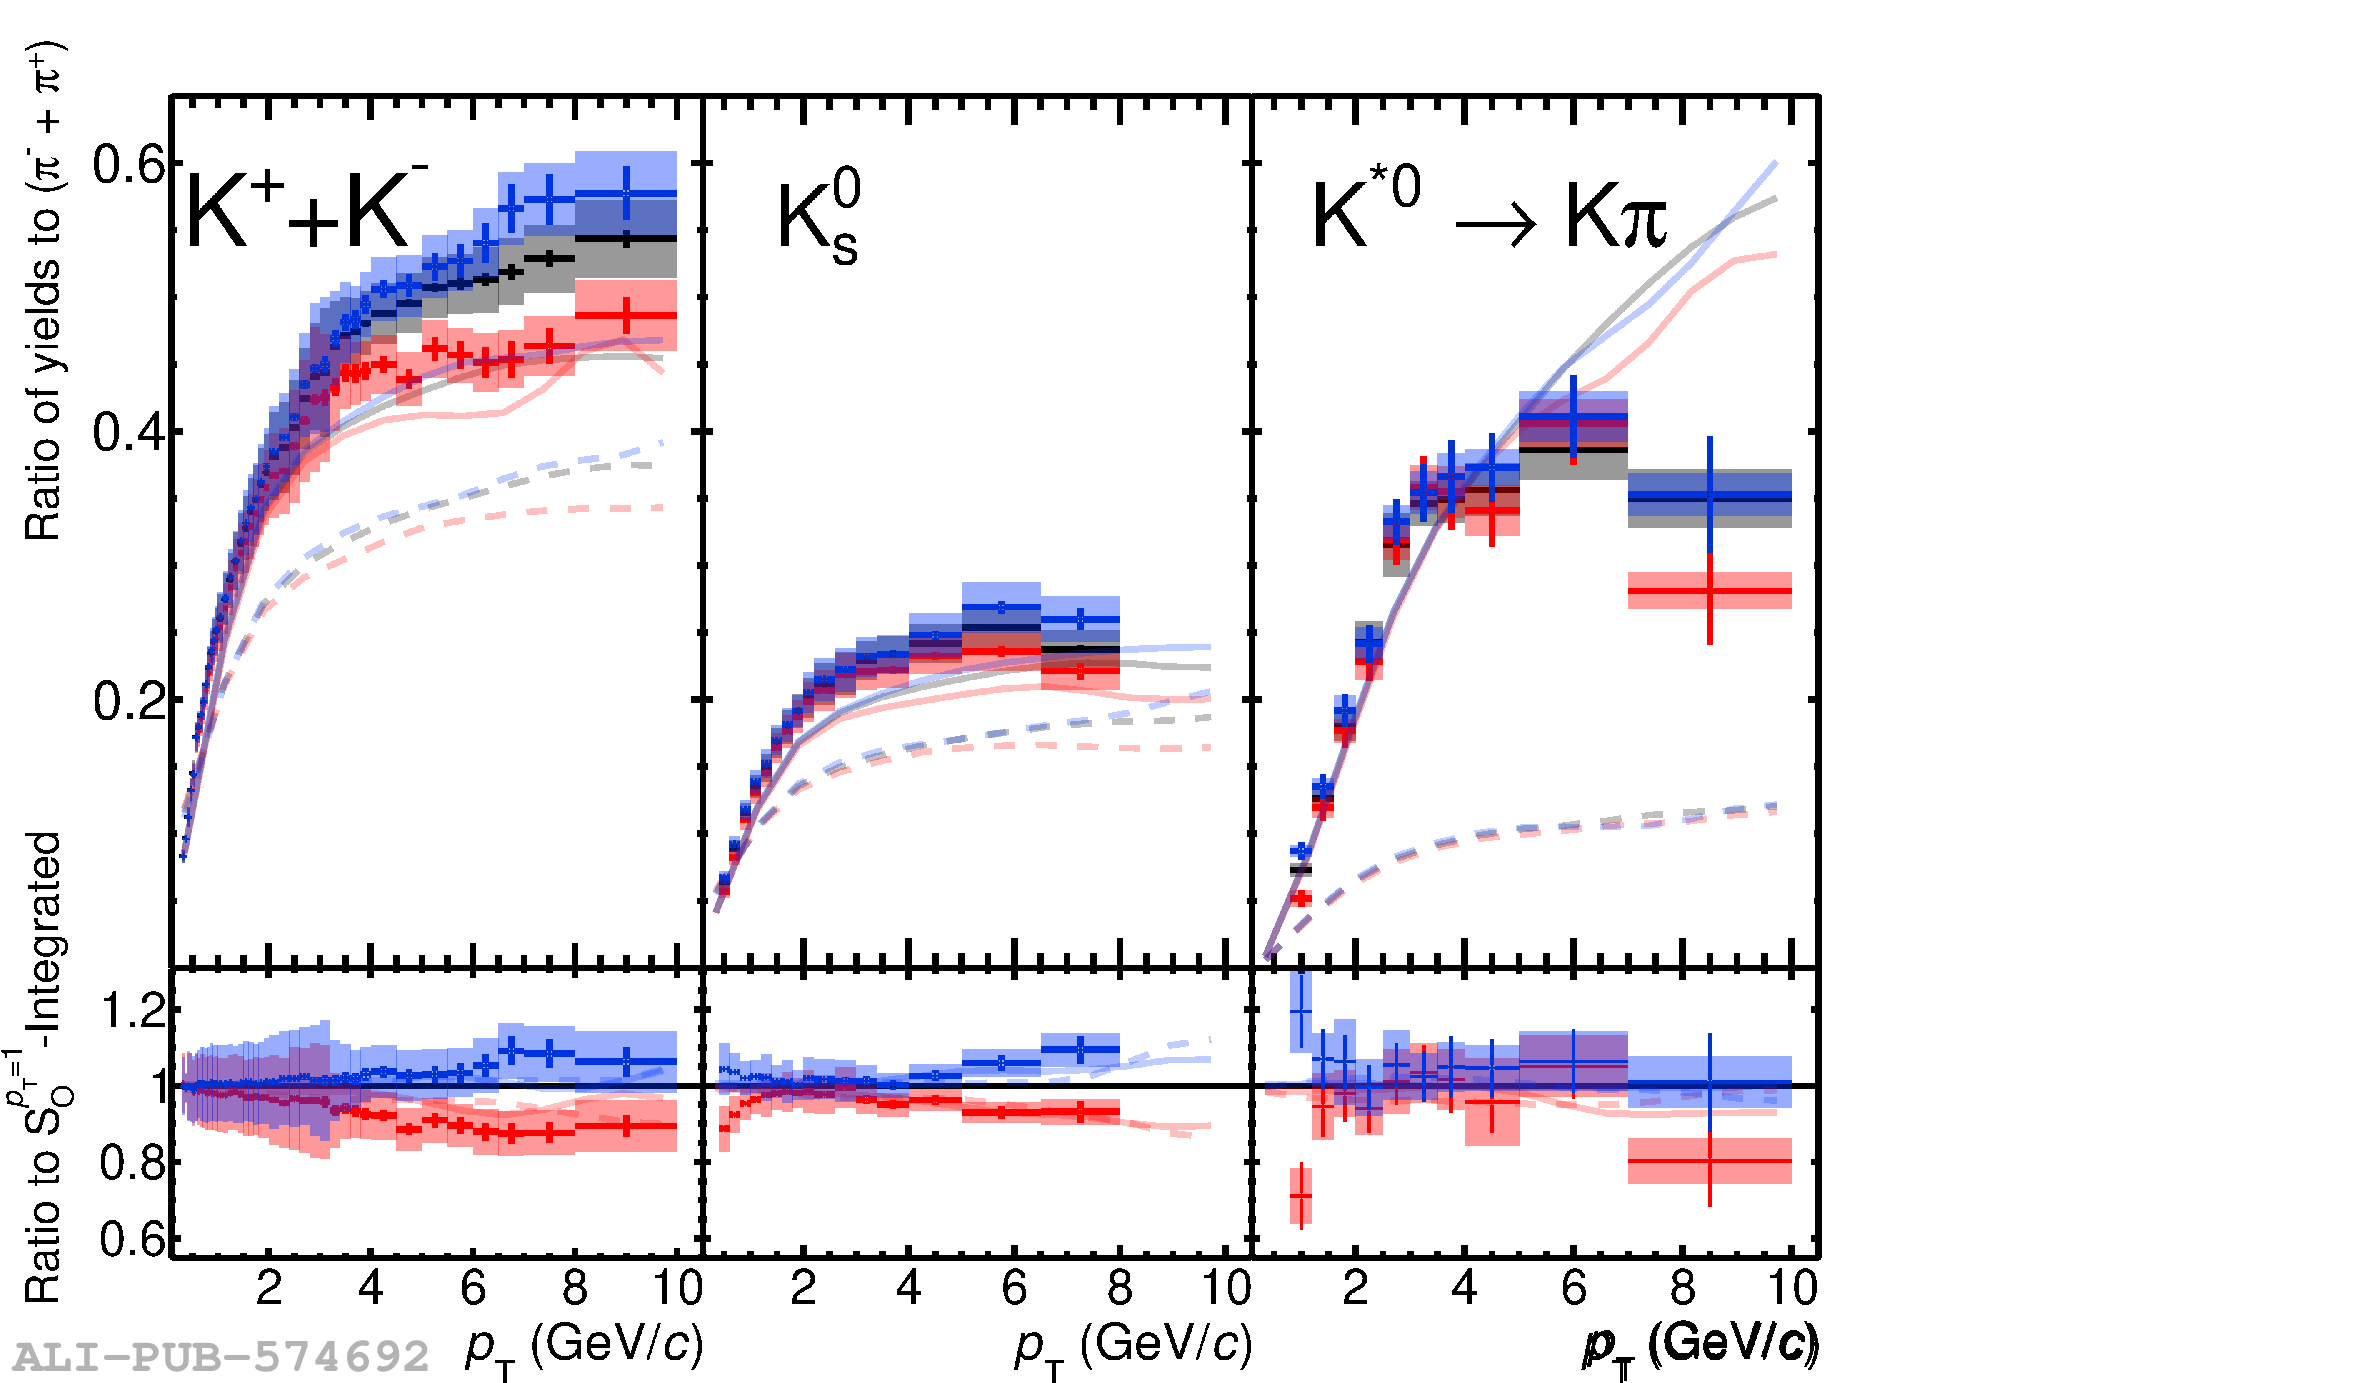 |
Figure 18
The double ratios of integrated yield as a function of $S_0^{p_{\rm T}=1}$ are presented for V0M 0--1\% (upper) and $N_{\rm tracklet}^{|\eta|< 0.8}$ 0--10\% (lower). Left and right panels show the same data points, but with different model predictions. Statistical and total systematic uncertainties are shown by bars and boxes, respectively. The curves represent different model predictions of the same measurement. | 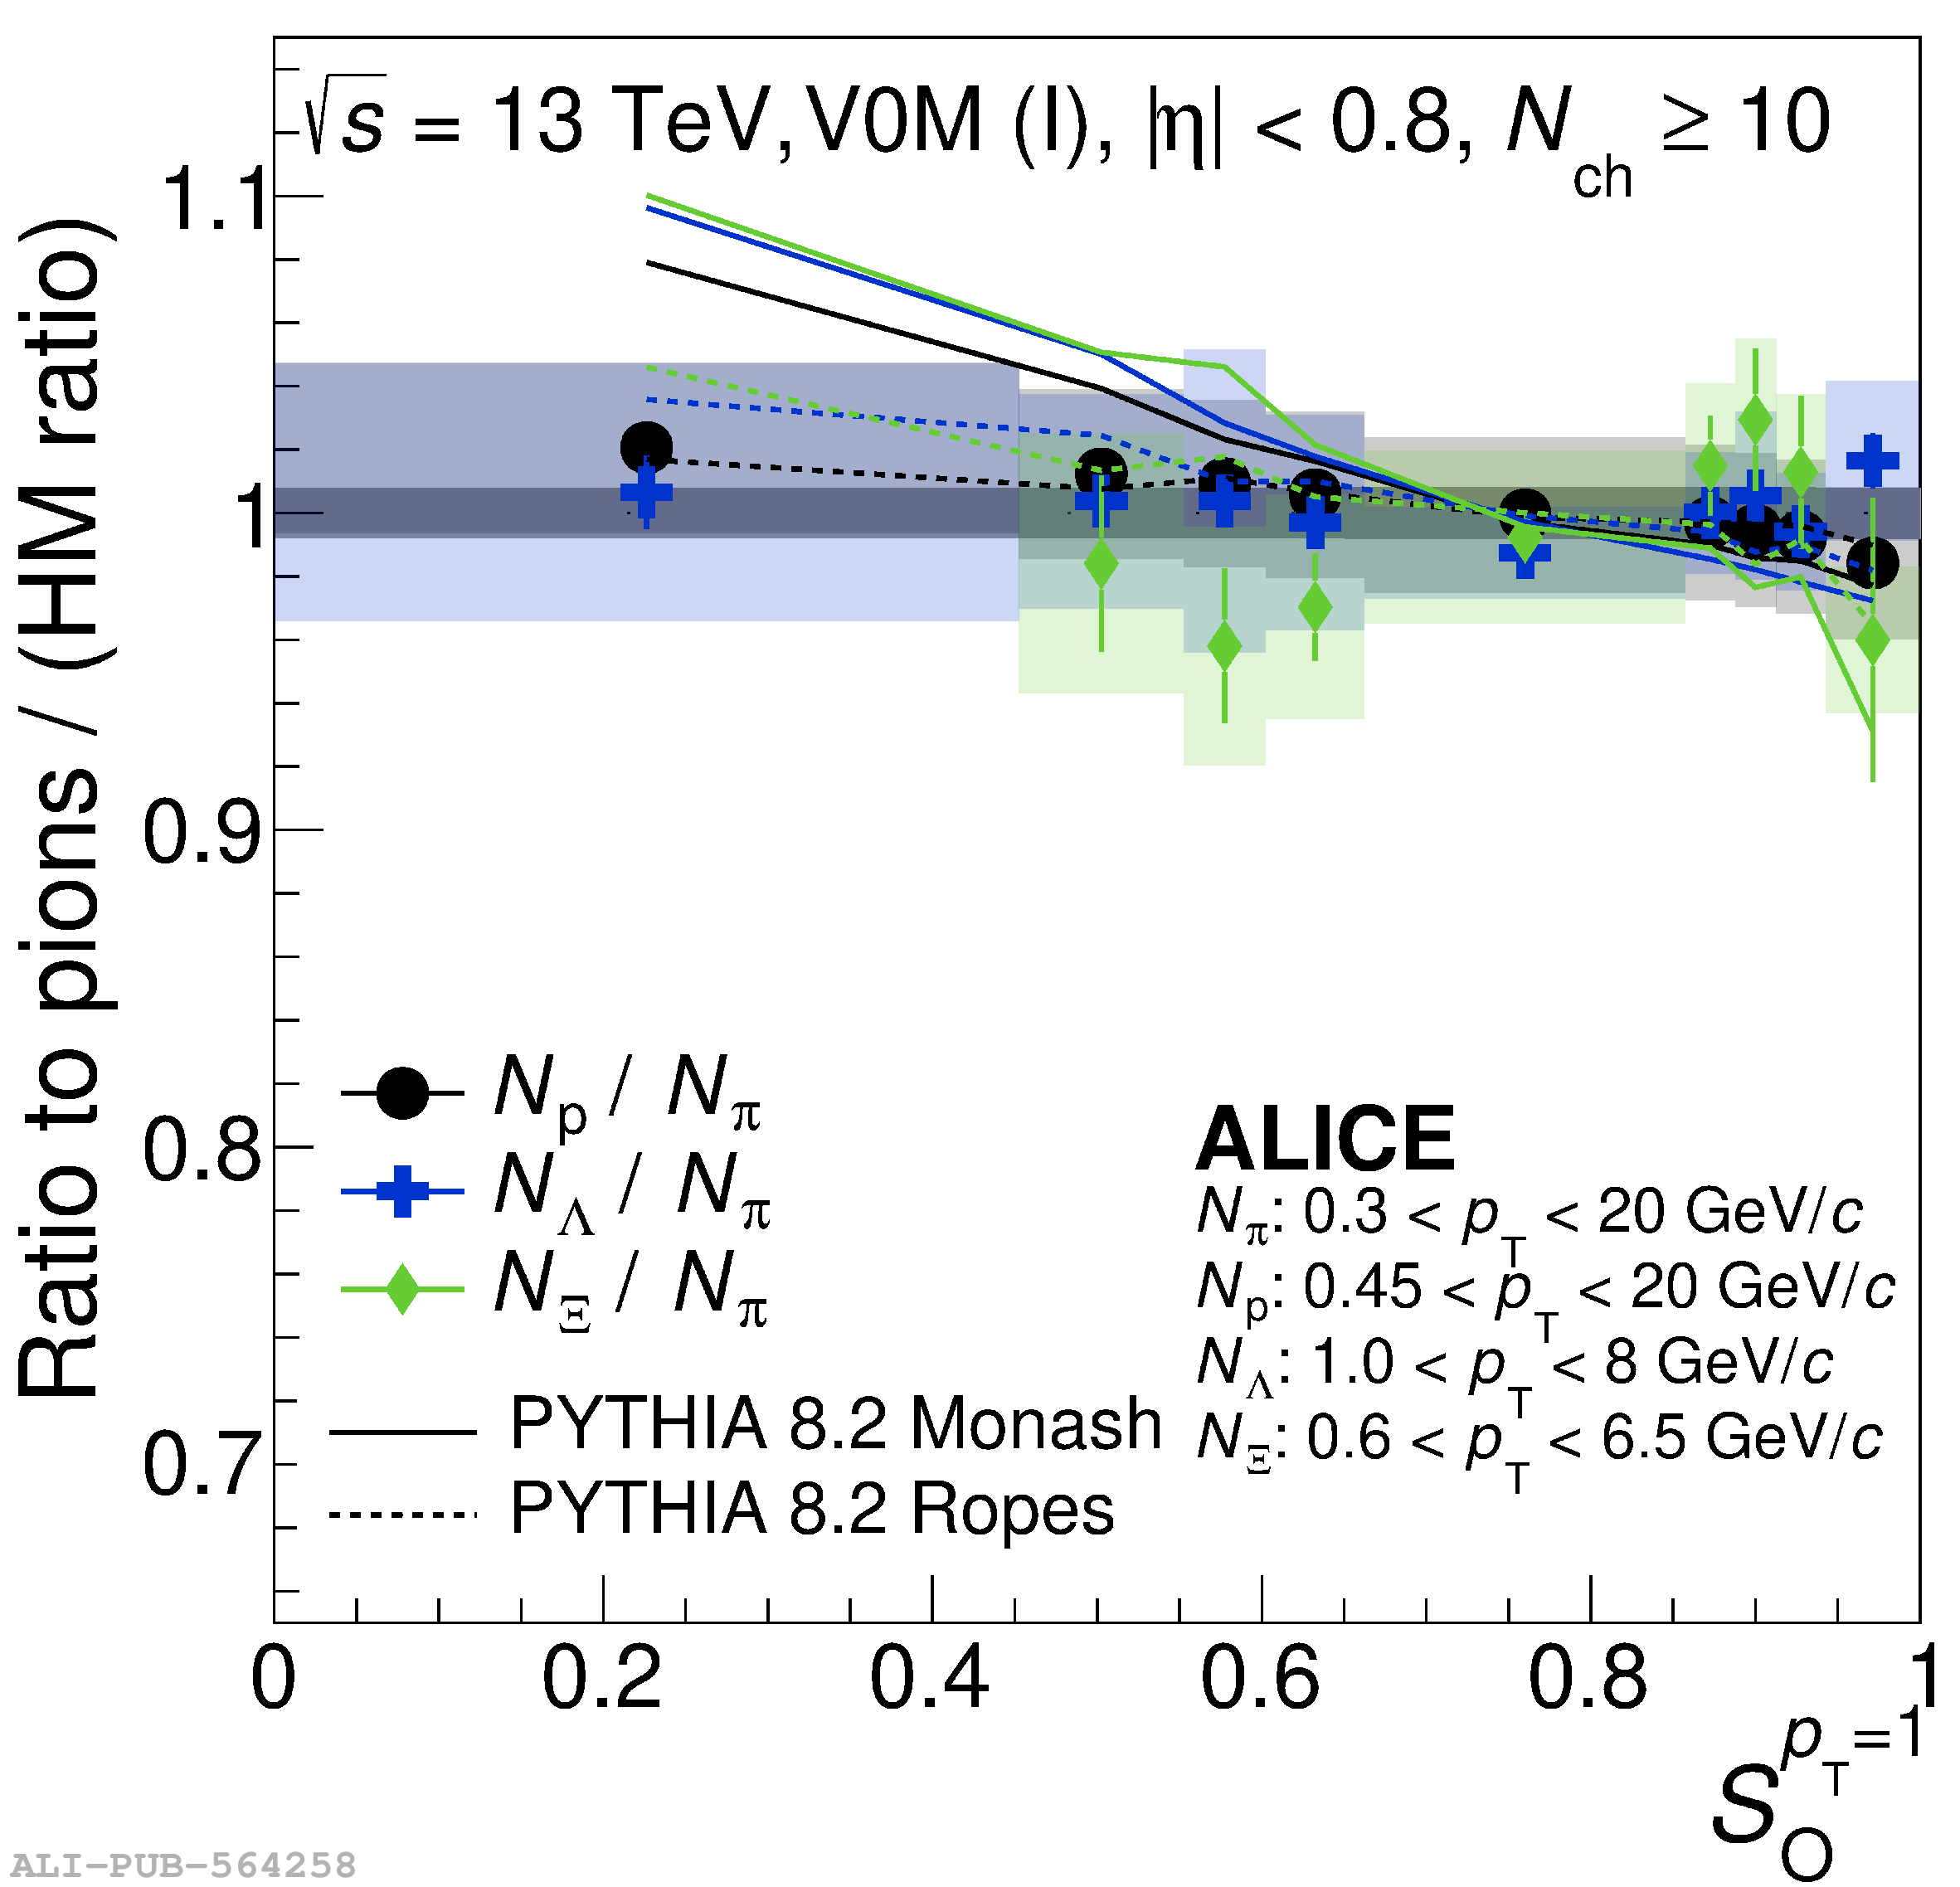 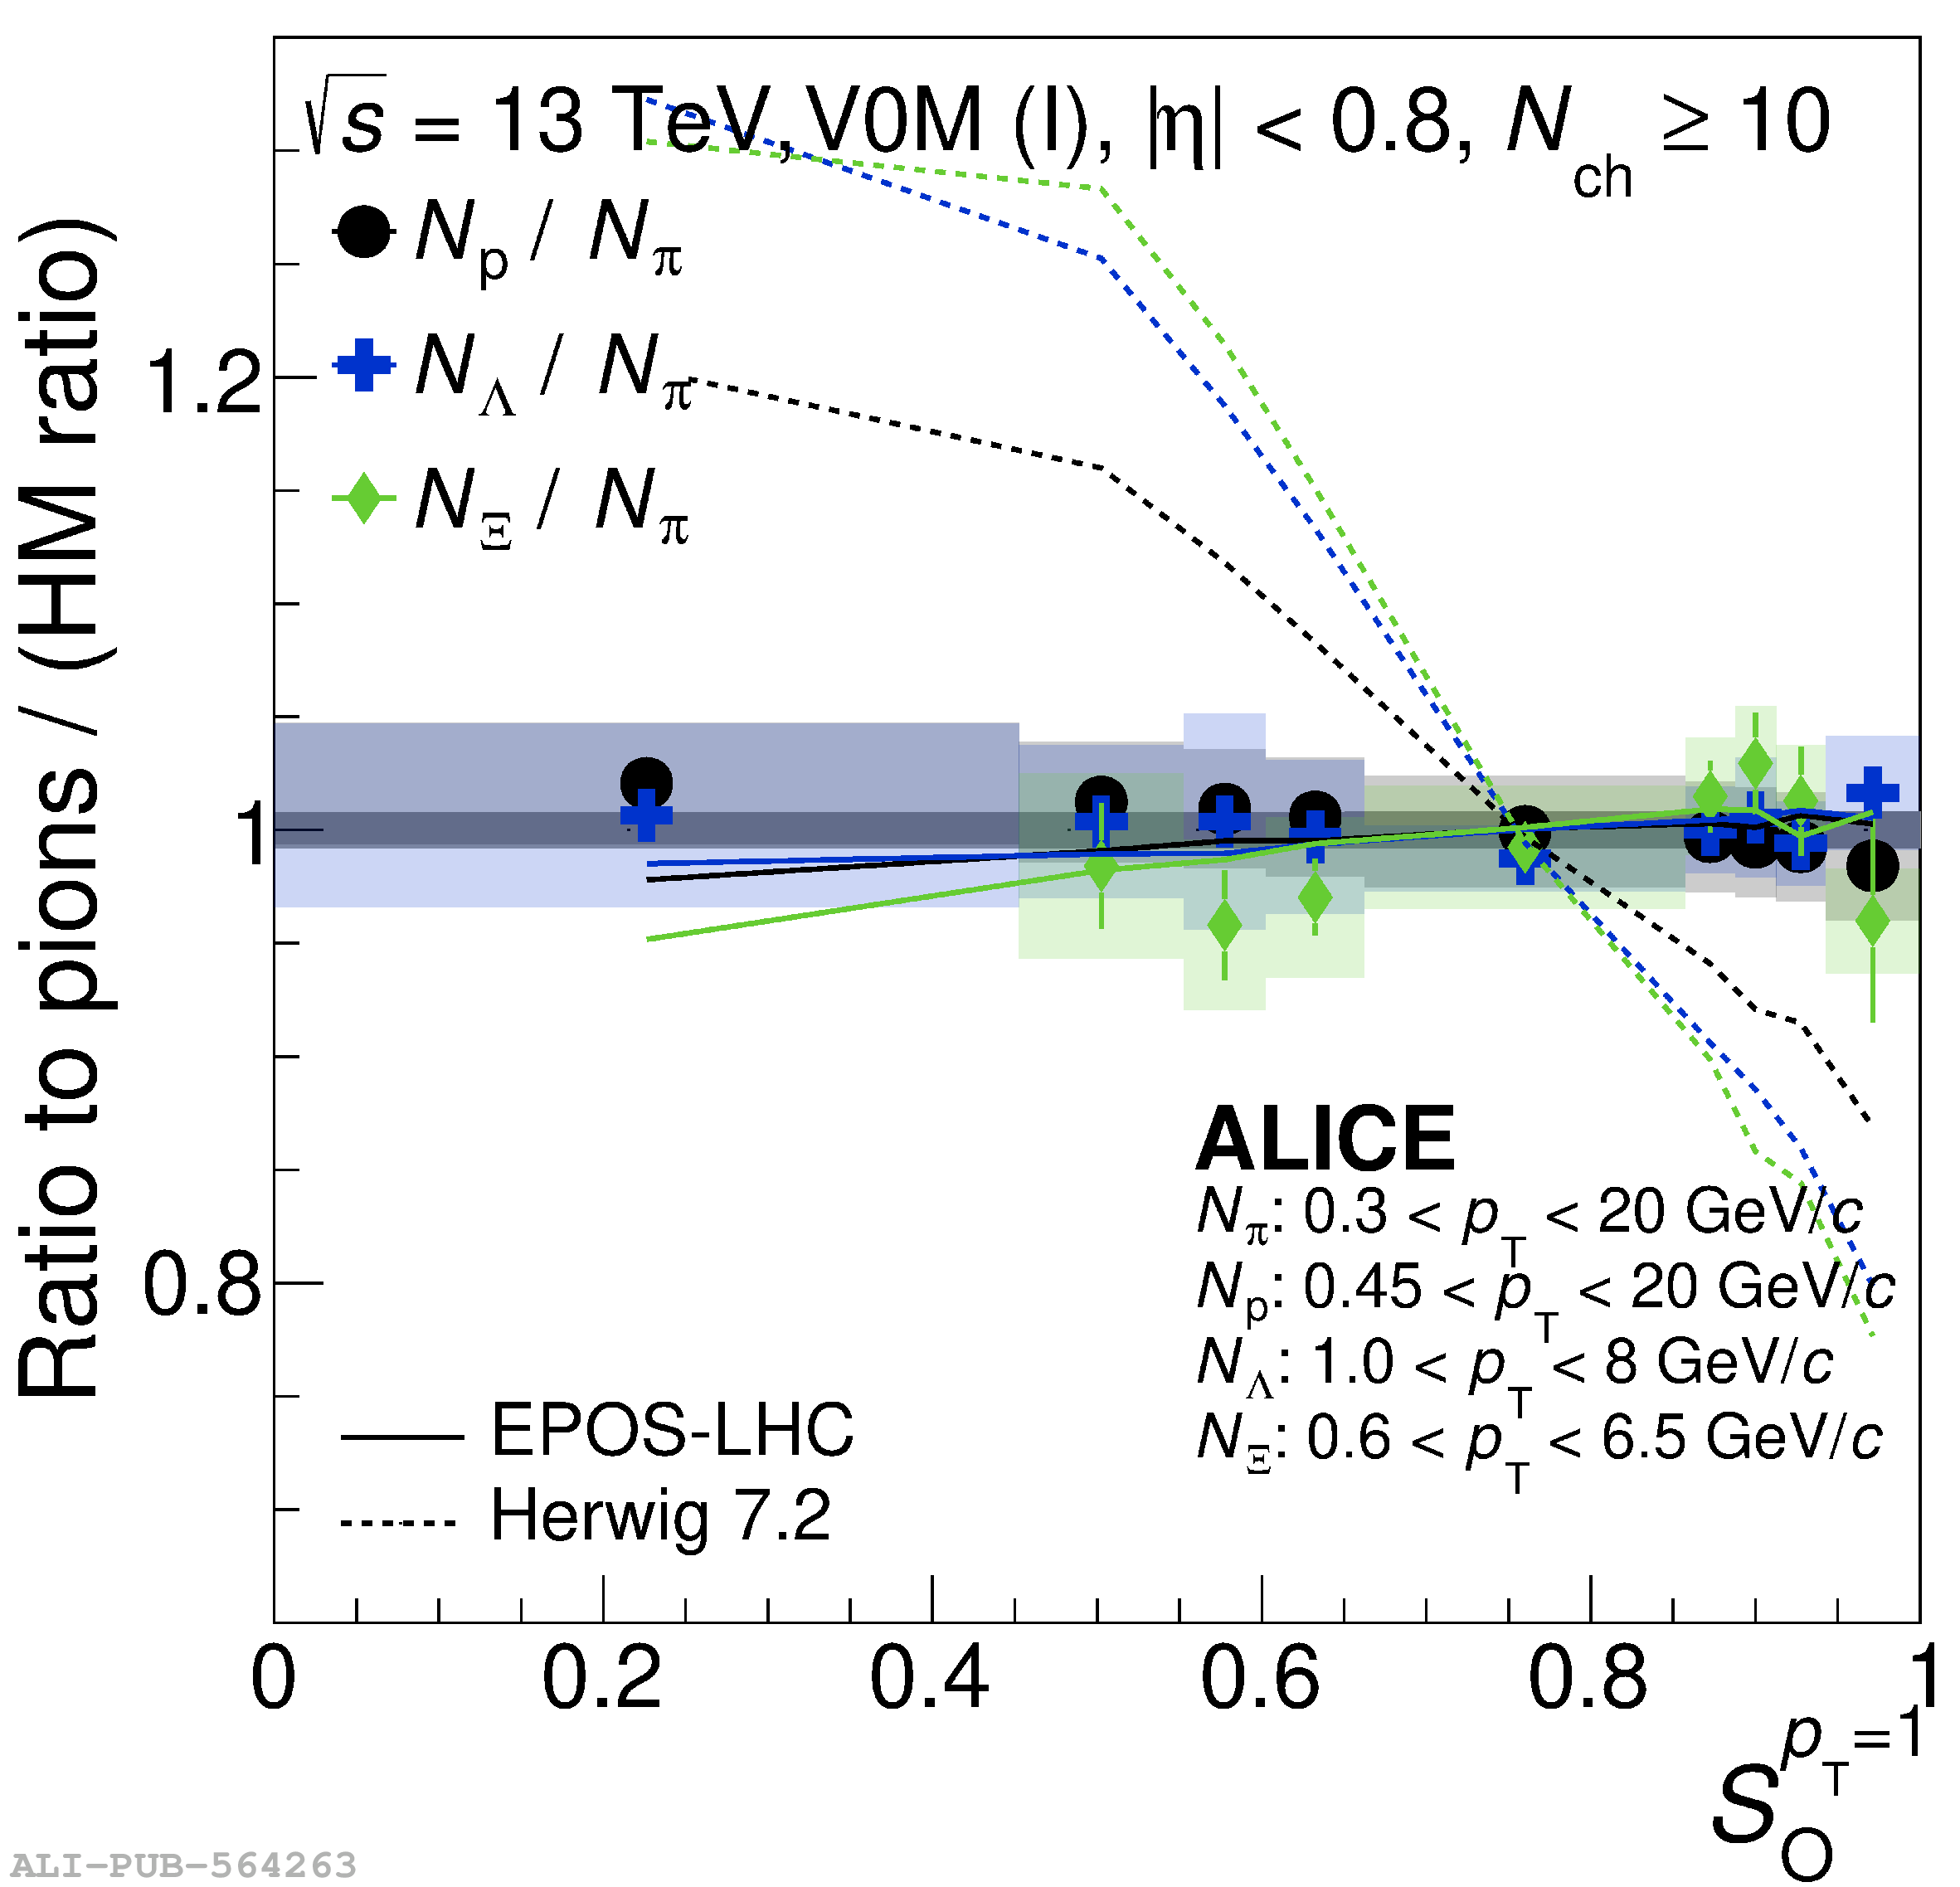 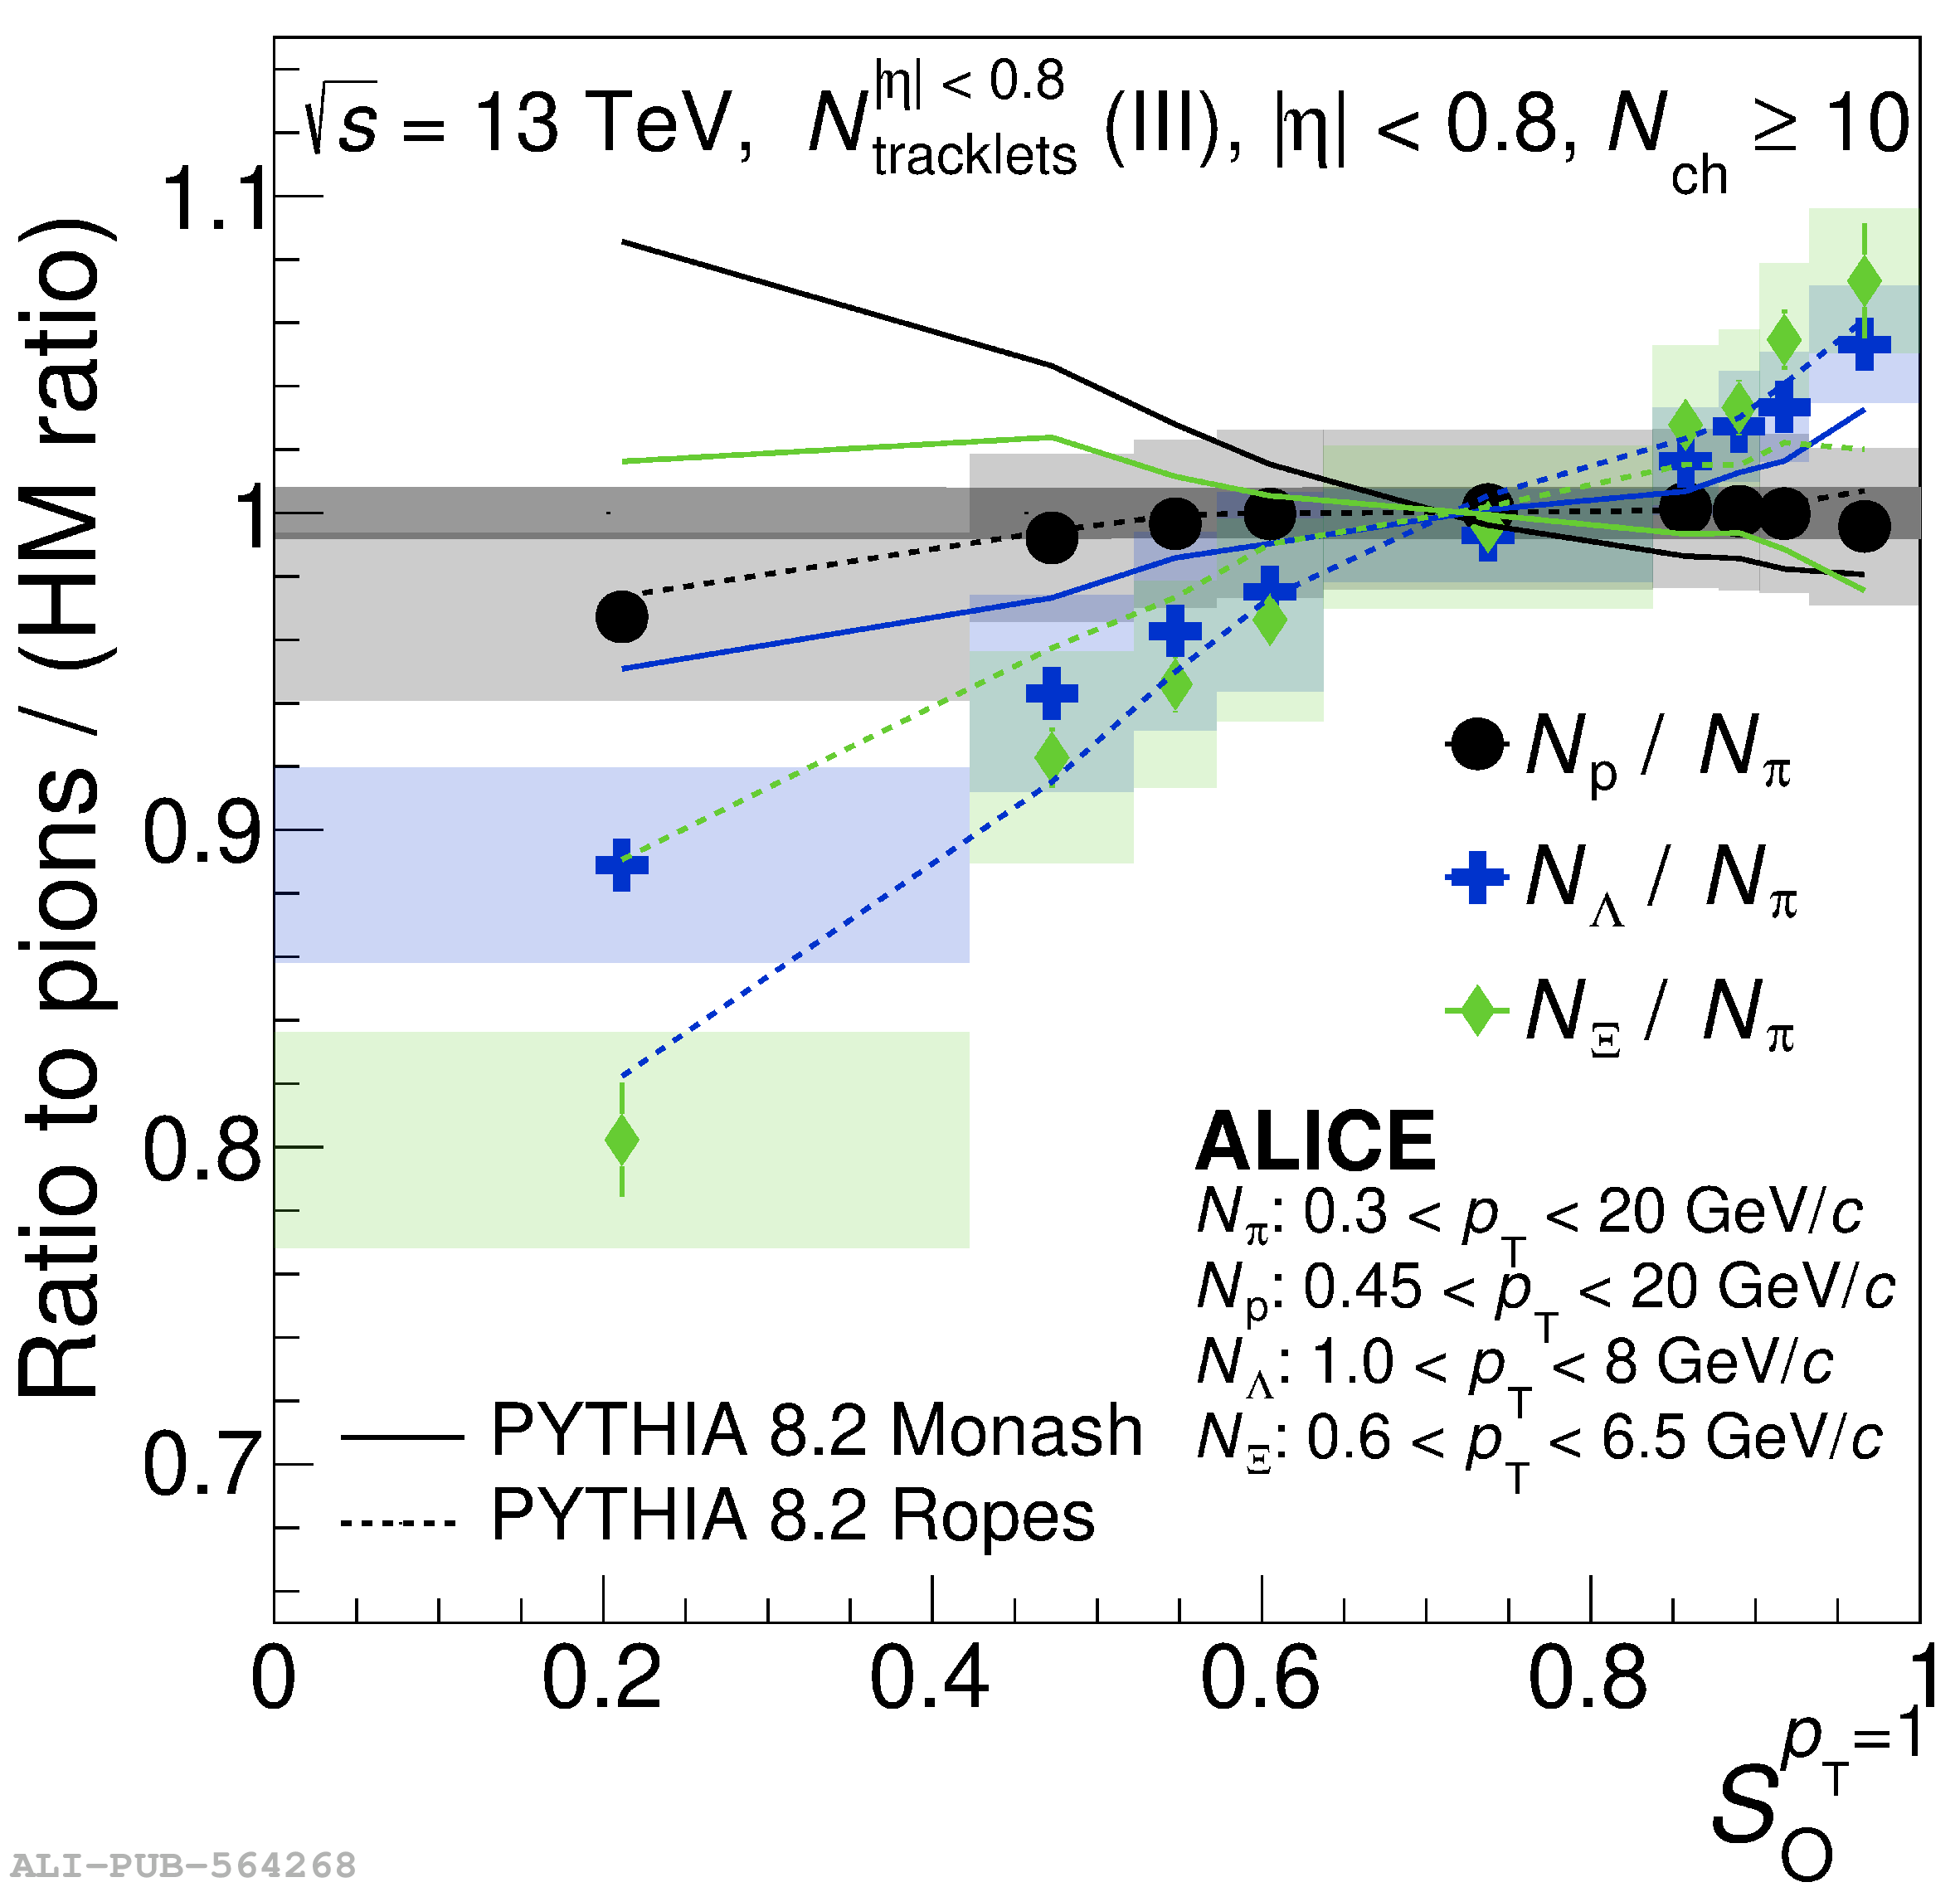 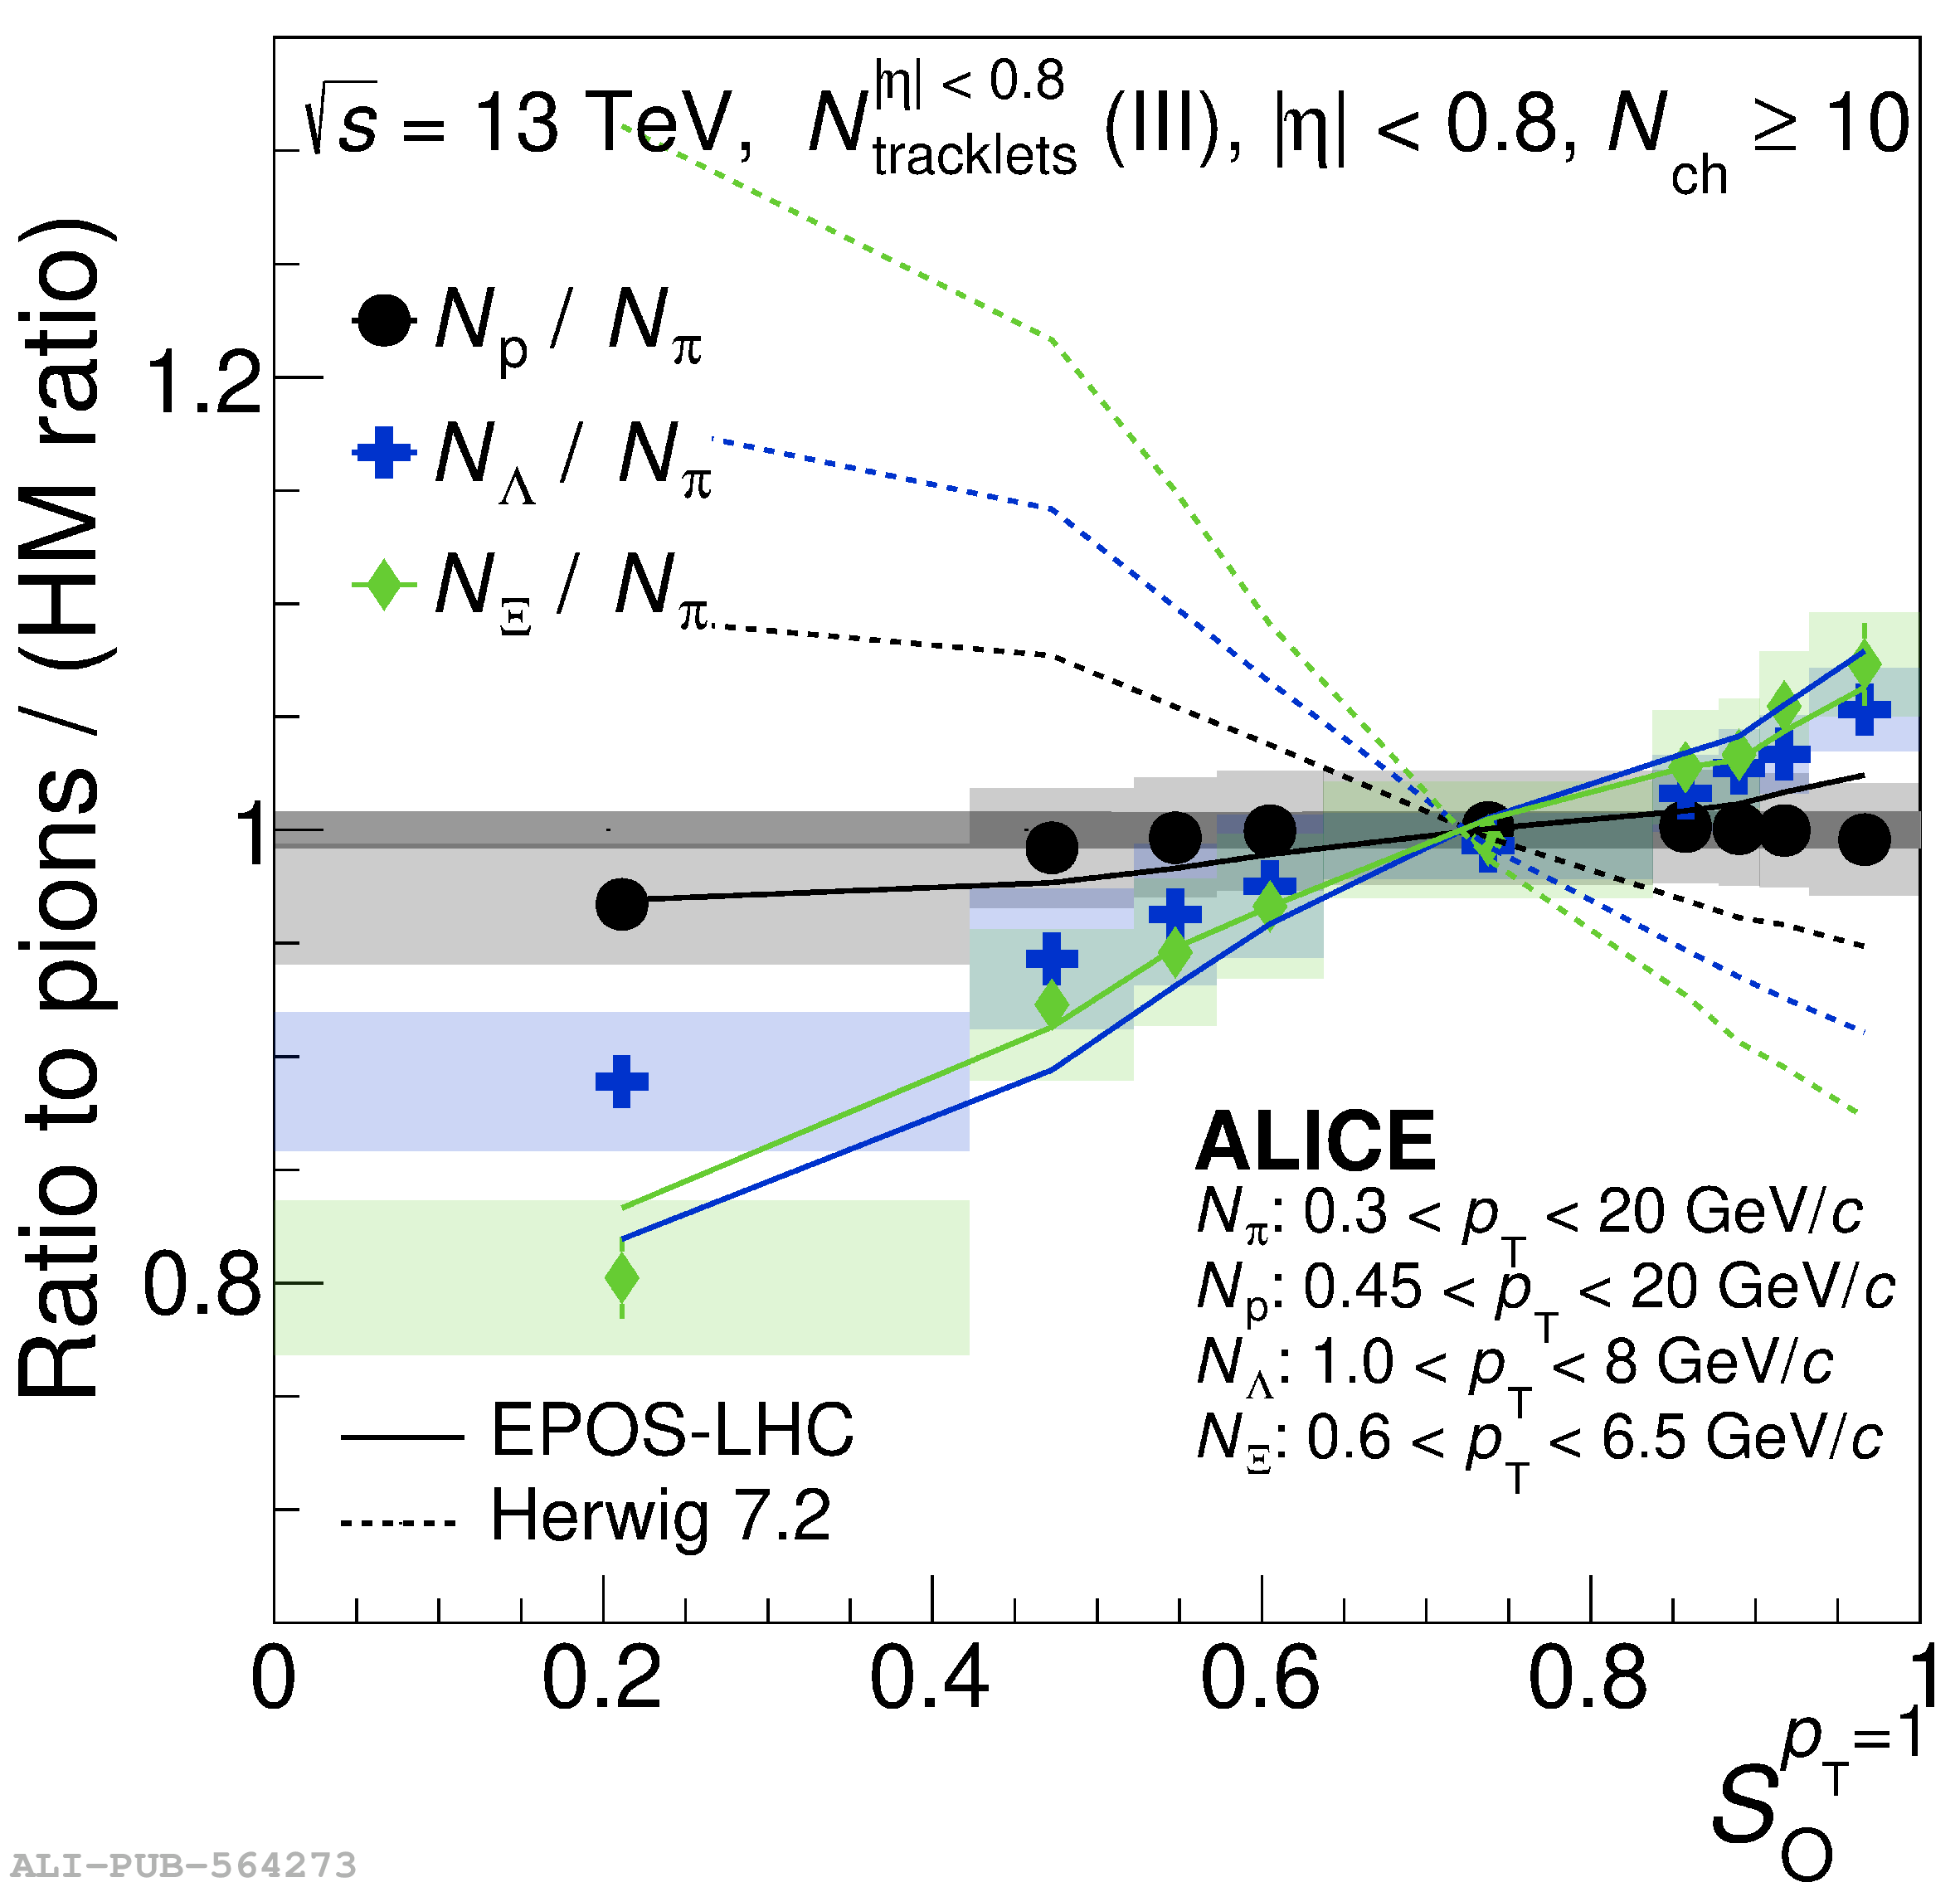 |
Figure 19
The double ratios of integrated yield as a function of $S_0^{p_{\rm T}=1}$in $N_{\rm tracklet}^{|\eta|< 0.8}$ 0--10\% for $\phi$ and $\Xi$. Statistical and total systematic uncertainties are shown by bars and boxes, respectively. The curves represent different model predictions of the same measurement. | 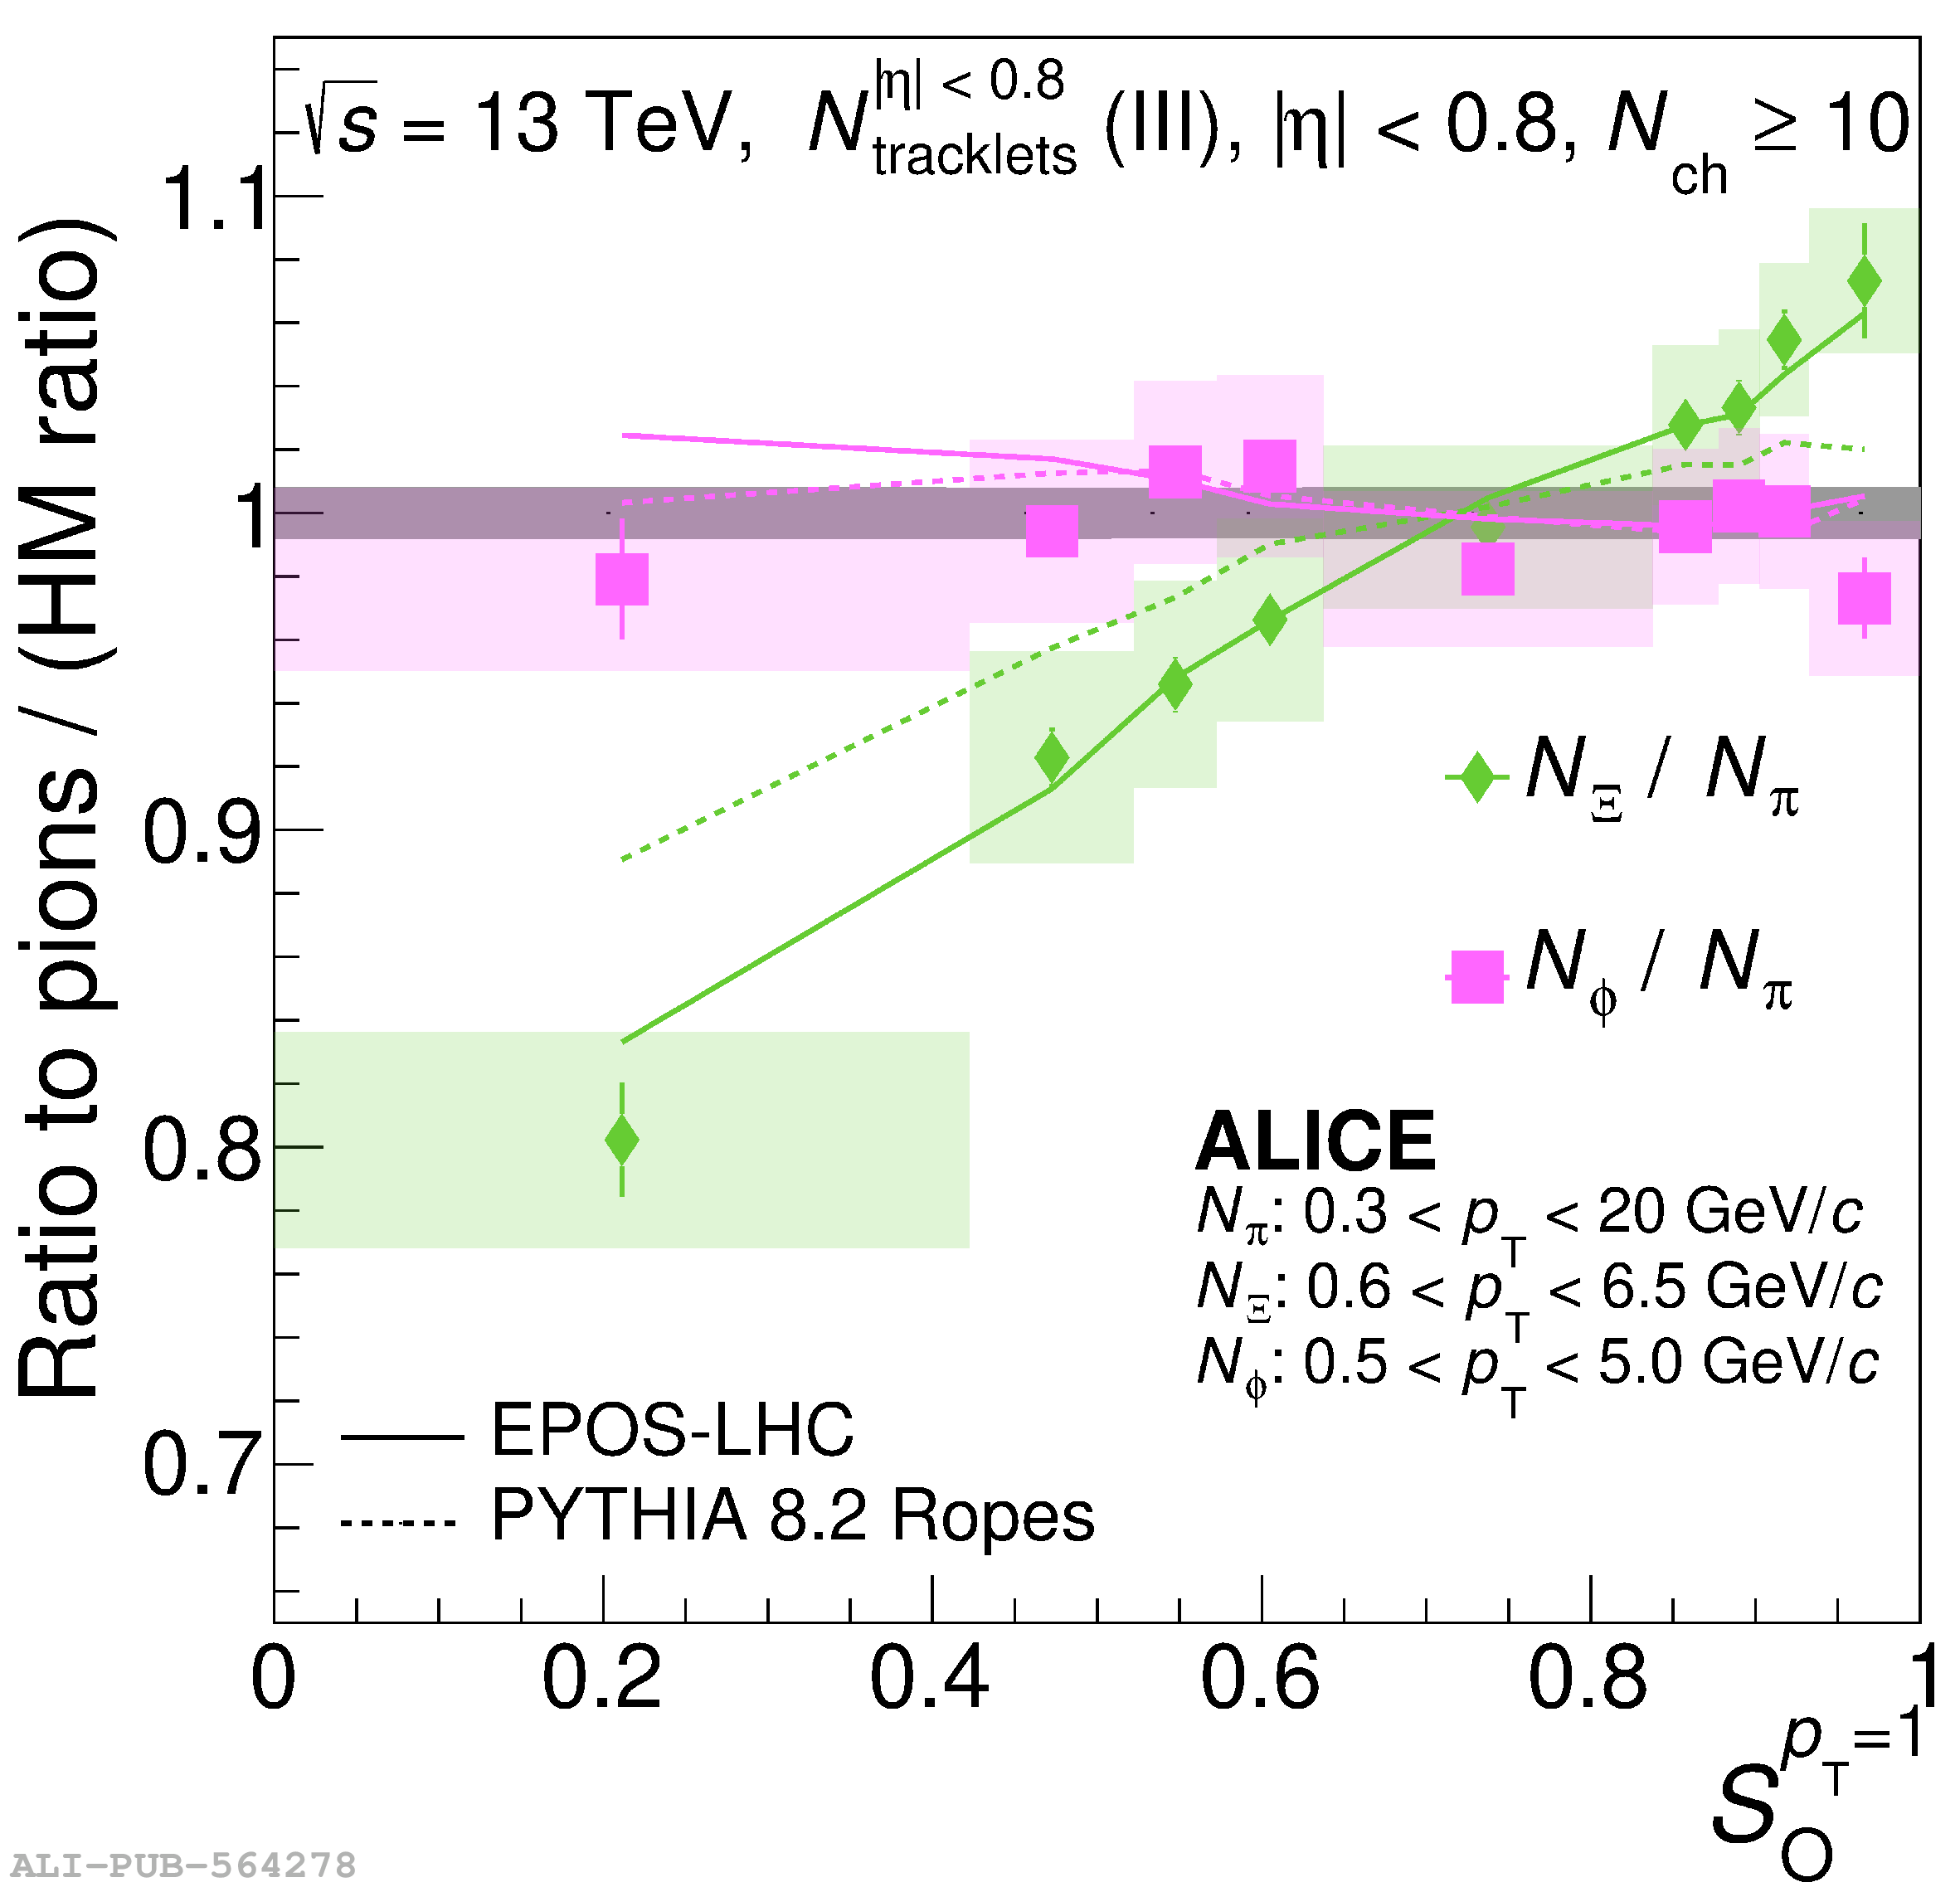 |