p/$\pi$, $\Lambda$/K and $\Xi/\phi$ ratios for different $S_0^{p_{\rm T}=1}$ classes are obtained for $0-1\%$ events measured by $N_{\rm tracklet}^{|\eta|< 0.8}$. Lower panels show the ratio to $S_0^{p_{\rm T}=1}$-integrated event selection. Statistical and total systematic uncertainties are shown by bars and boxes, respectively. The curves represent different model predictions of the same measurement. Note that for the p/$\pi$, the same data points are presented in Fig.7, with an extended $p_{\rm T}$ range now covering 10--20 GeV/$c$. | 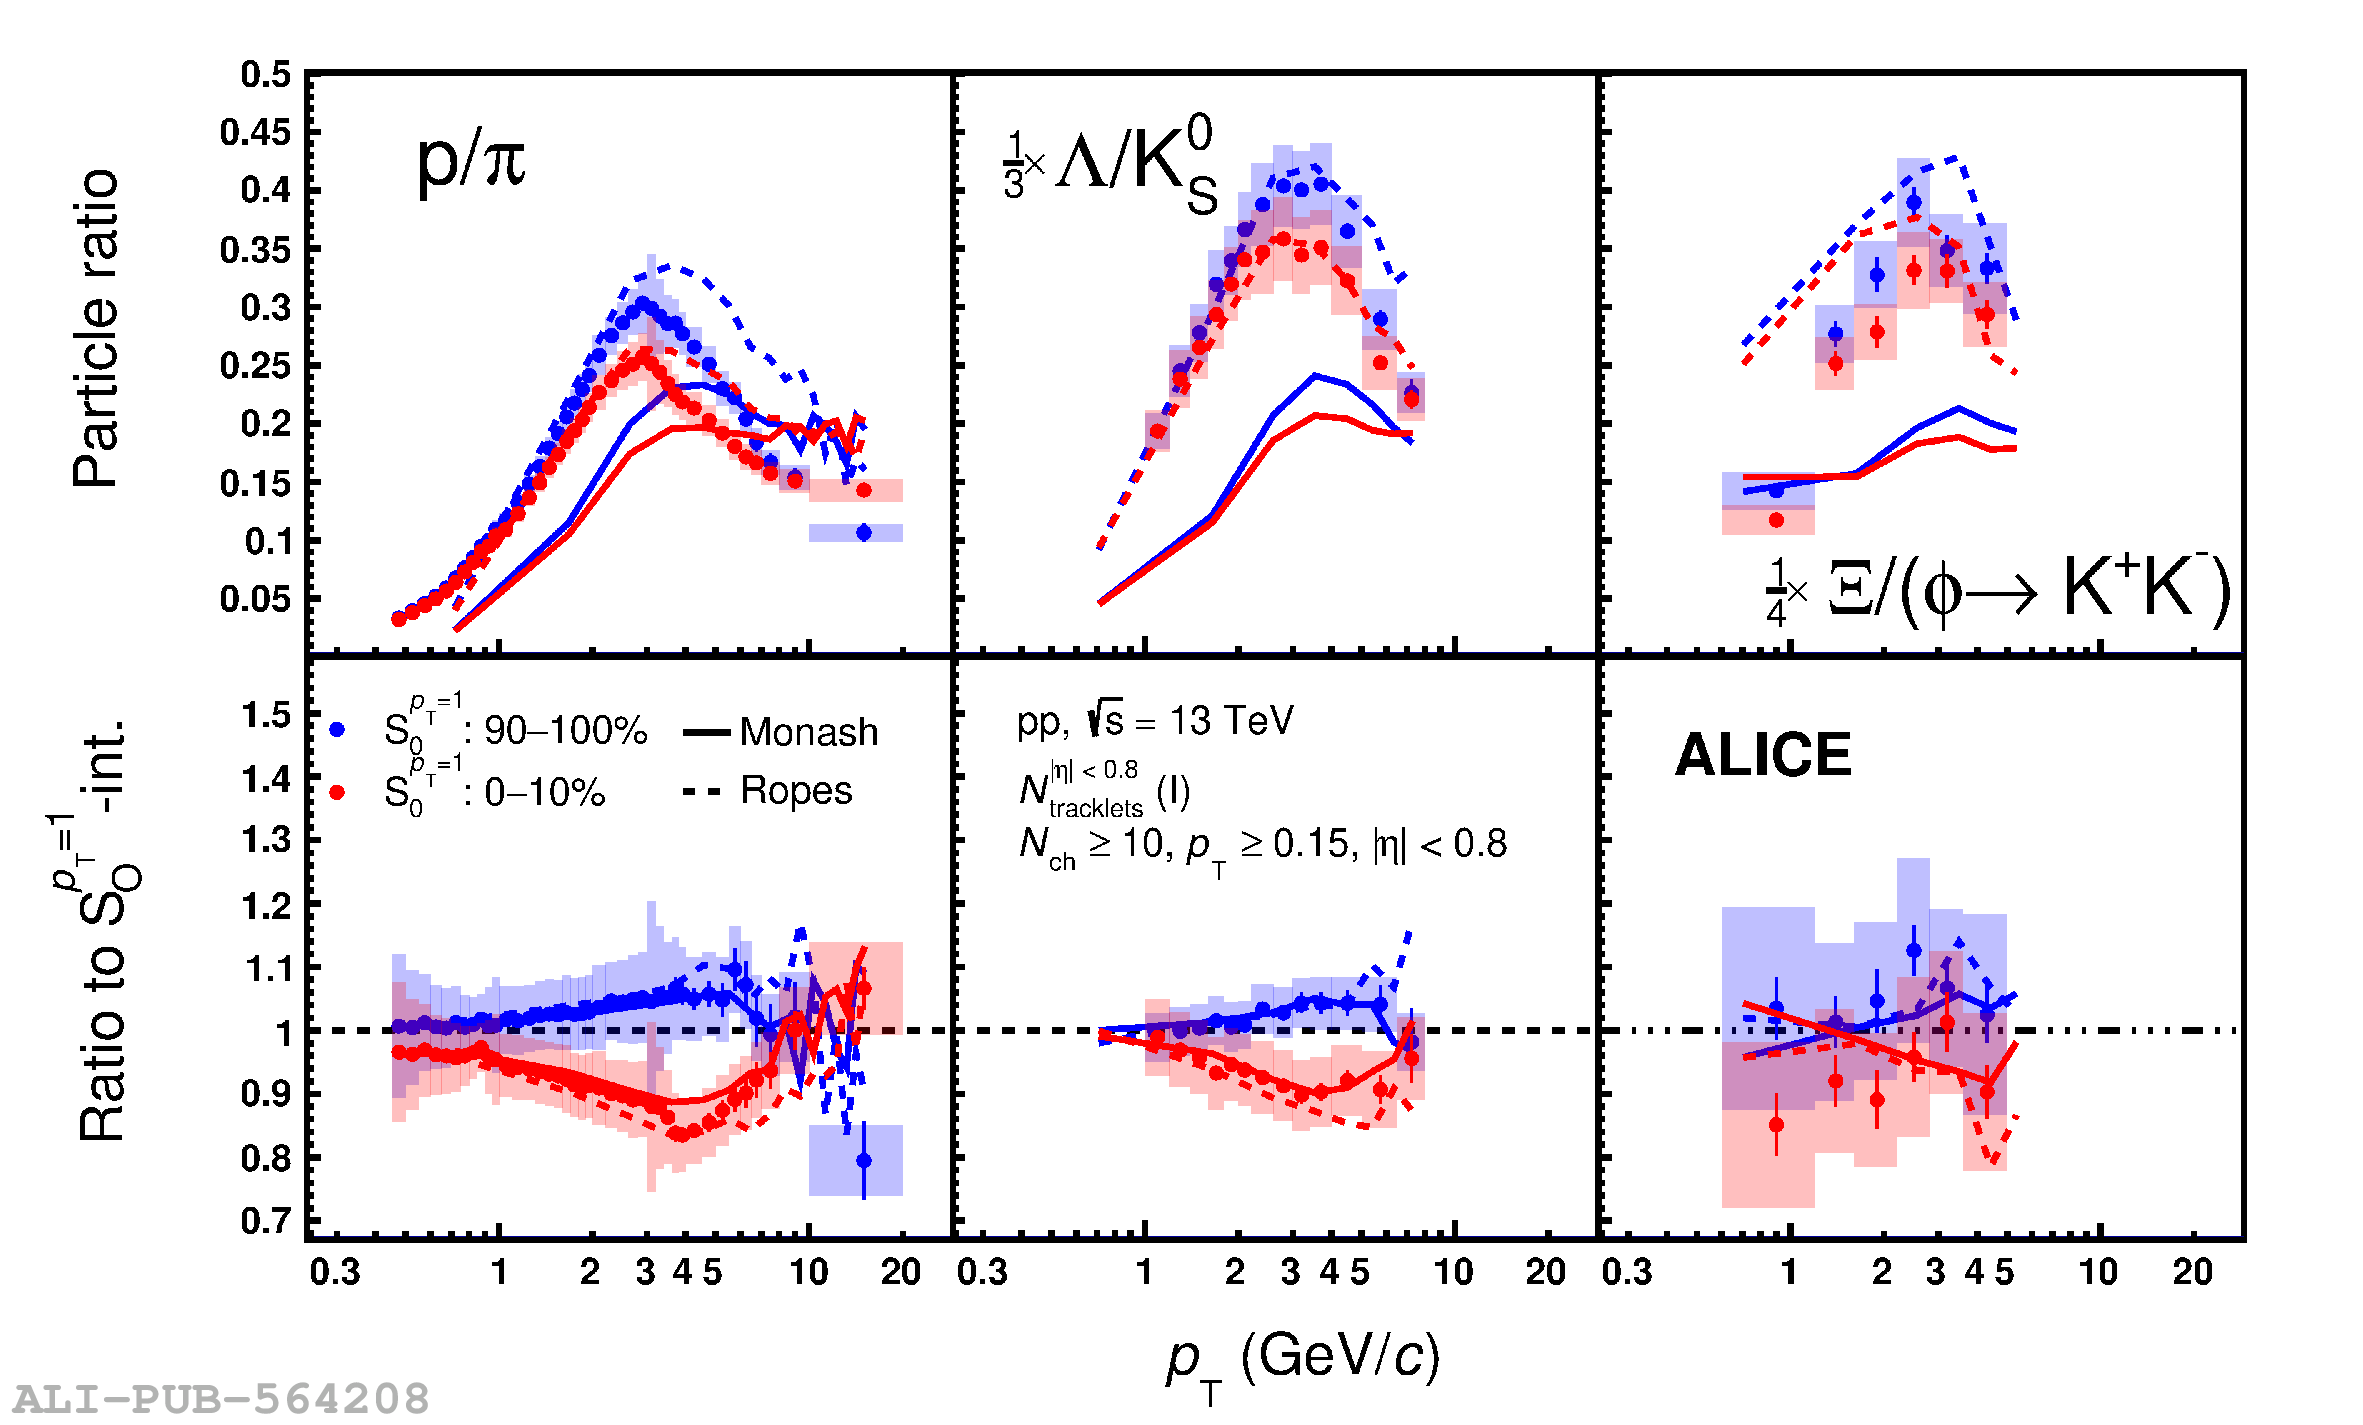 |