Long- and short-range correlations for pairs of charged particles are studied via two-particle angular correlations in pp collisions at $\sqrt{s}=13$ TeV and p$-$Pb collisions at $\sqrt{s_\mathrm{NN}} = 5.02$ TeV. The correlation functions are measured as a function of relative azimuthal angle $\Delta\varphi$ and pseudorapidity separation $\Delta\eta$ for pairs of primary charged particles within the pseudorapidity interval $|\eta| <~ 0.9$ and the transverse-momentum interval $1 <~ p_{\rm T} <~ 4$ GeV/$c$. Flow coefficients are extracted for the long-range correlations ($1.6 <~ |\Delta\eta| <~1.8$) in various high-multiplicity event classes using the low-multiplicity template fit method. The method is used to subtract the enhanced yield of away-side jet fragments in high-multiplicity events. These results show decreasing flow signals toward lower multiplicity events. Furthermore, the flow coefficients for events with hard probes, such as jets or leading particles, do not exhibit any significant changes compared to those obtained from high-multiplicity events without any specific event selection criteria. The results are compared with hydrodynamic-model calculations, and it is found that a better understanding of the initial conditions is necessary to describe the results, particularly for low-multiplicity events.
JHEP 03 (2024) 092
HEP Data
e-Print: arXiv:2308.16591 | PDF | inSPIRE
CERN-EP-2023-195
Figure group
Figure 1
Two-dimensional correlation functions are presented for high-multiplicity (0$-$0.1% or 0$-$5%, on the left) and low-multiplicity (60$-$100%, on the right) events in $\sqrt{s}=13$ TeV pp collisions in the top panels. The corresponding distributions for $\sqrt{s_{\mathrm{NN}}}=5.02$ TeV p$-$Pb collisions are shown in the bottom panels. All correlation functions are shown for 1 $<\it{p}_{\rm{T,trig}}<$ 2 GeV/$c$ and 1 $<\it{p}_{\rm{T,assoc}}<$ 4 GeV/$c$, respectively. | 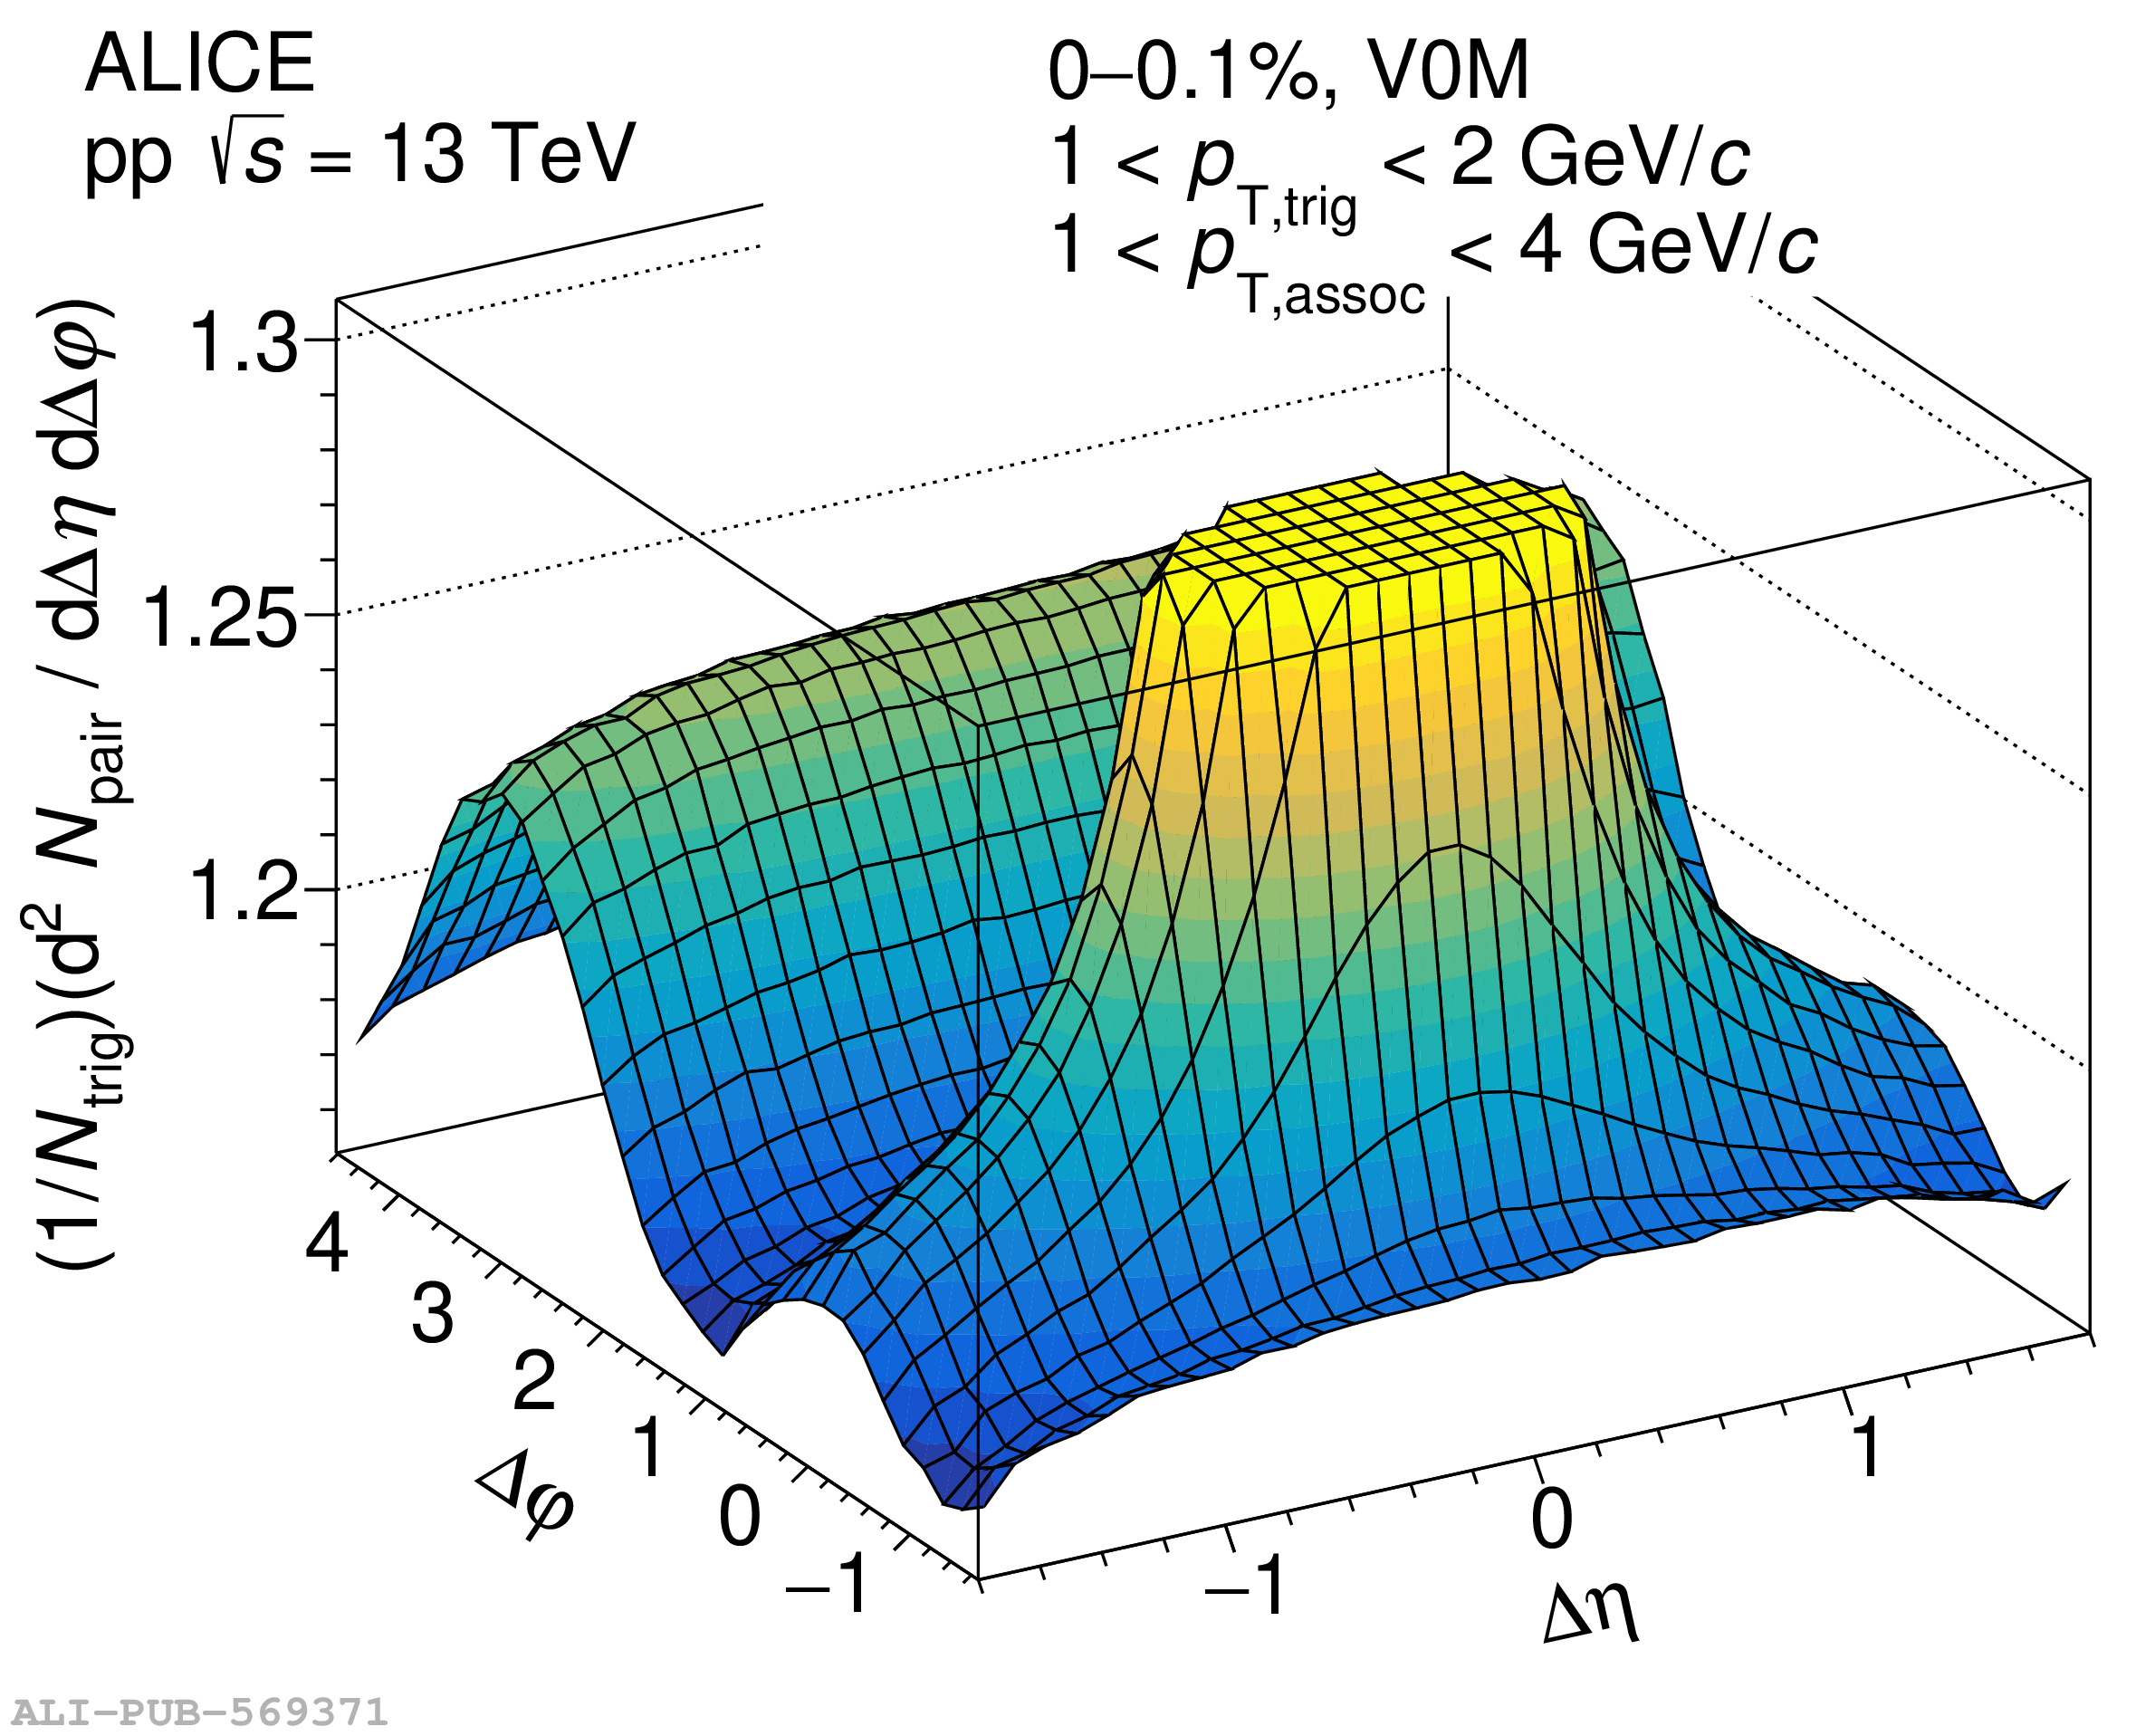 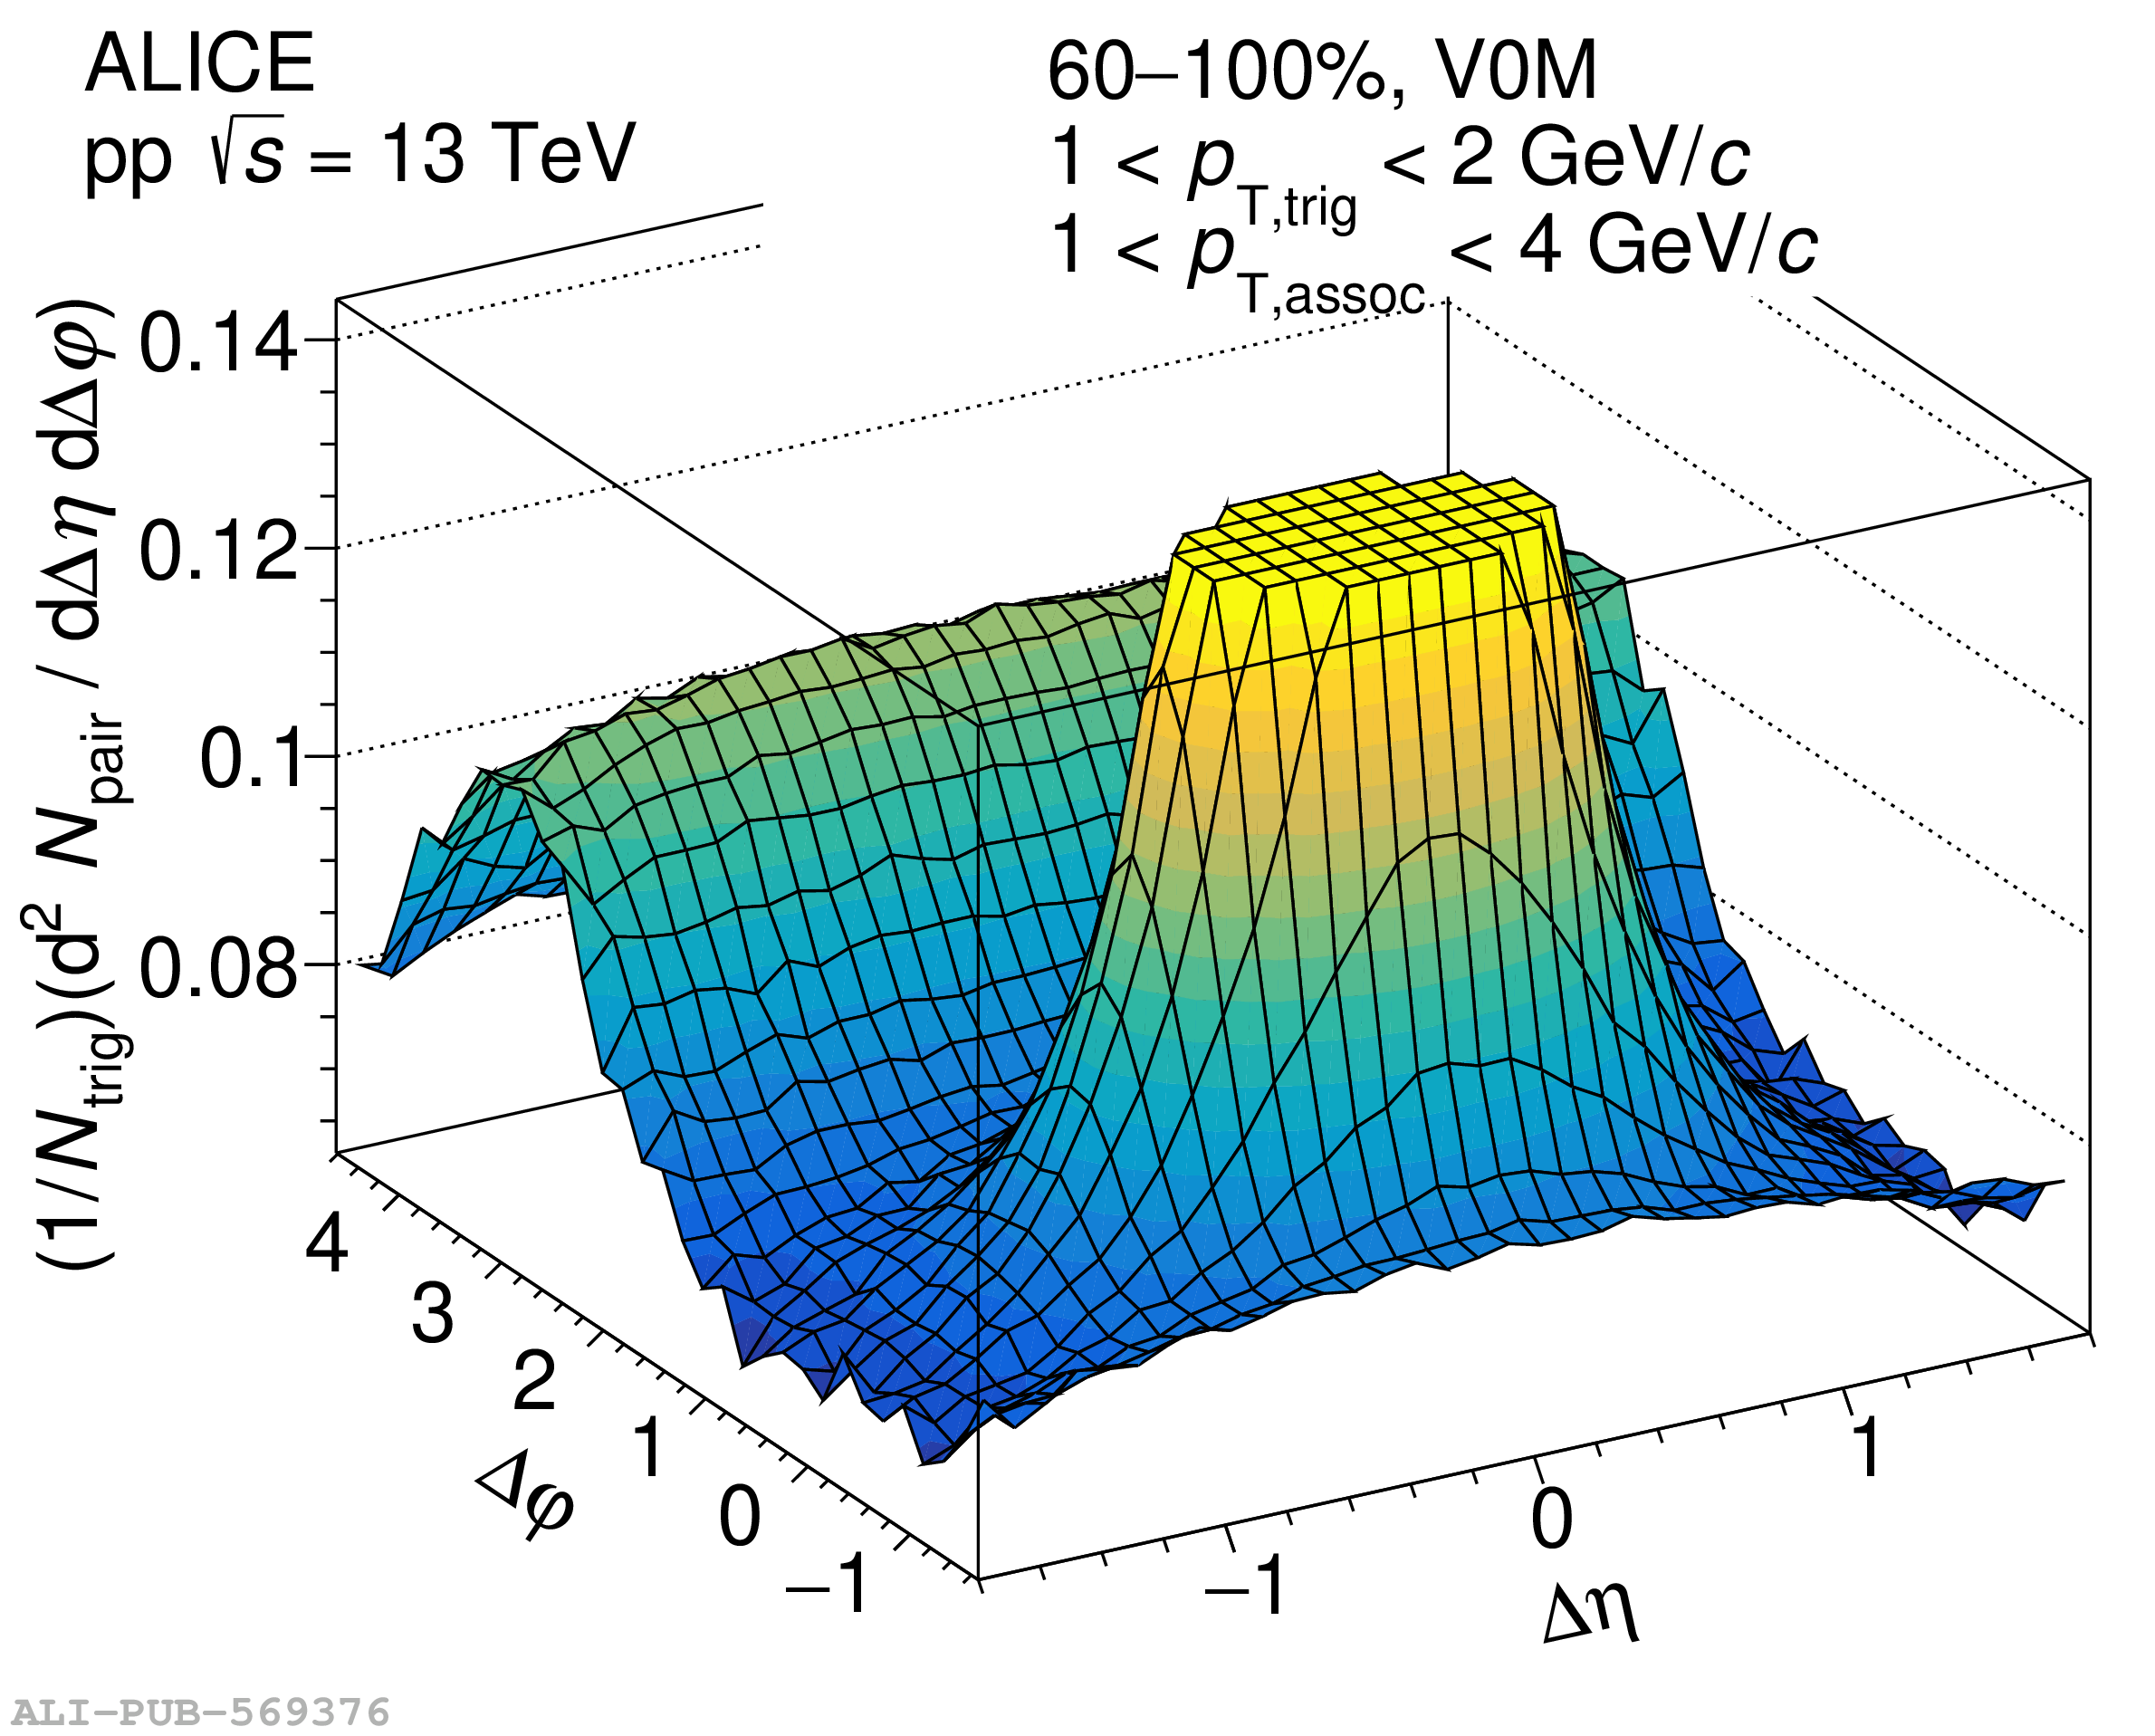 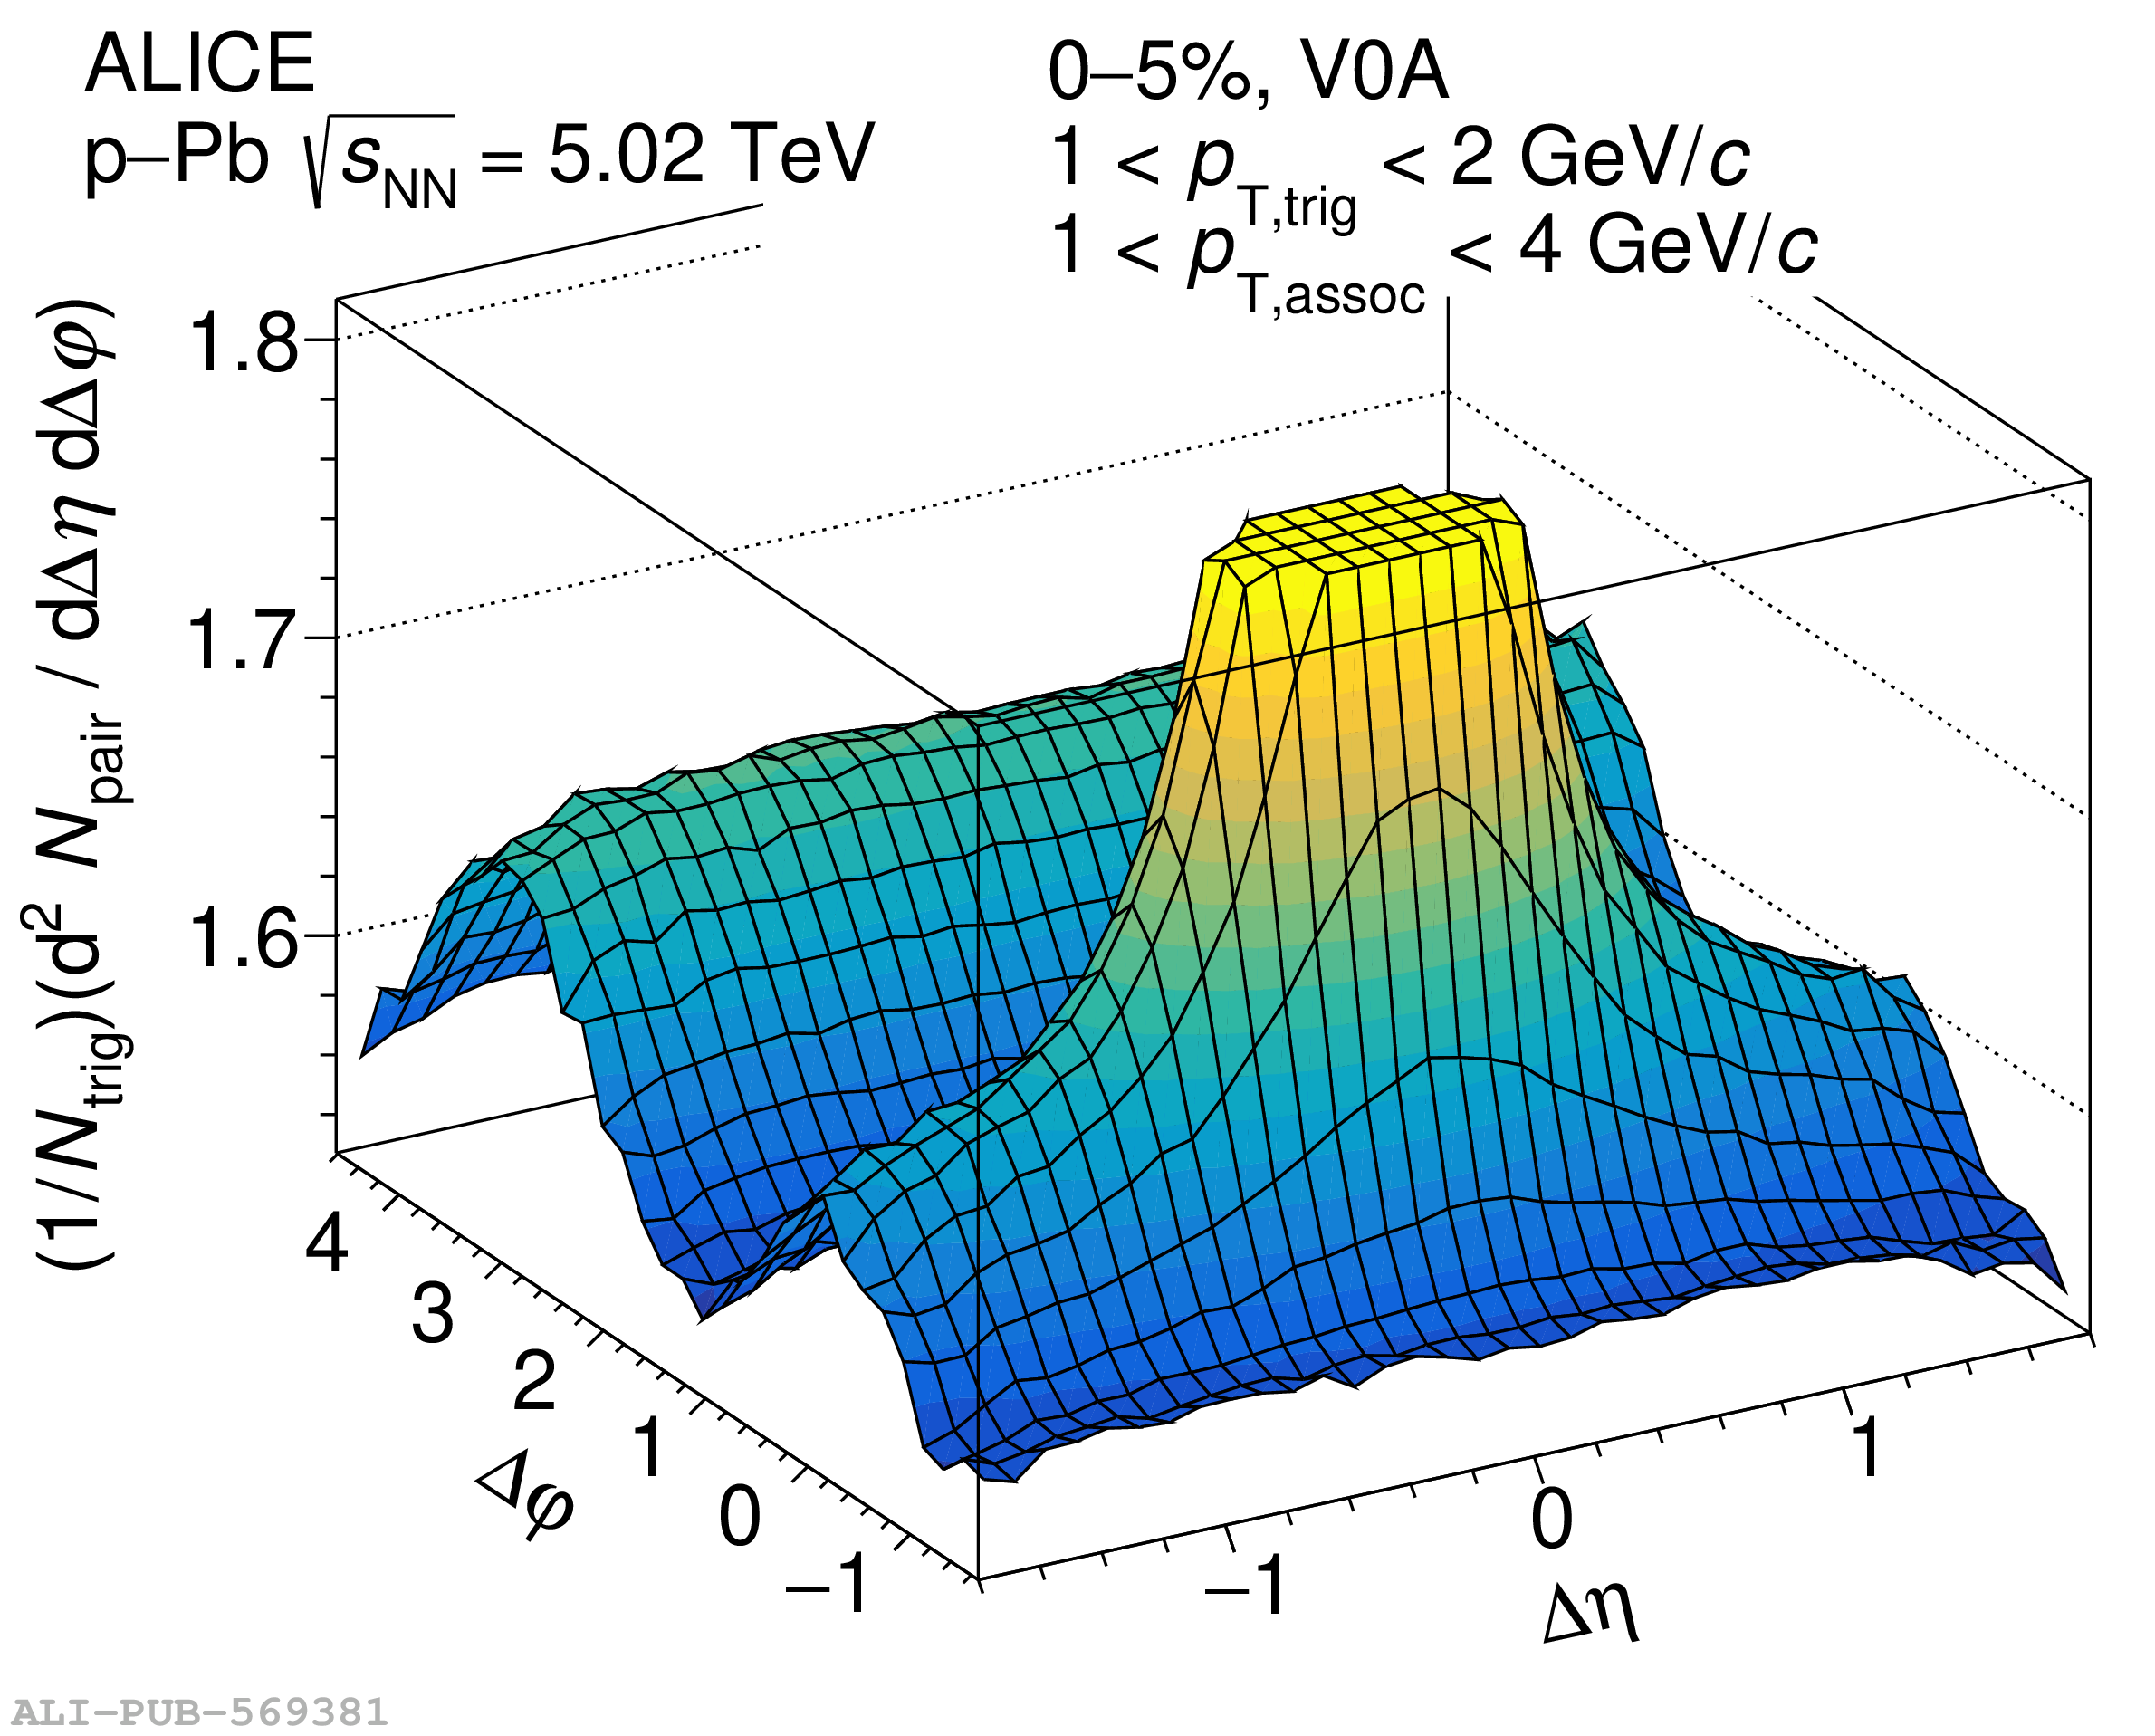 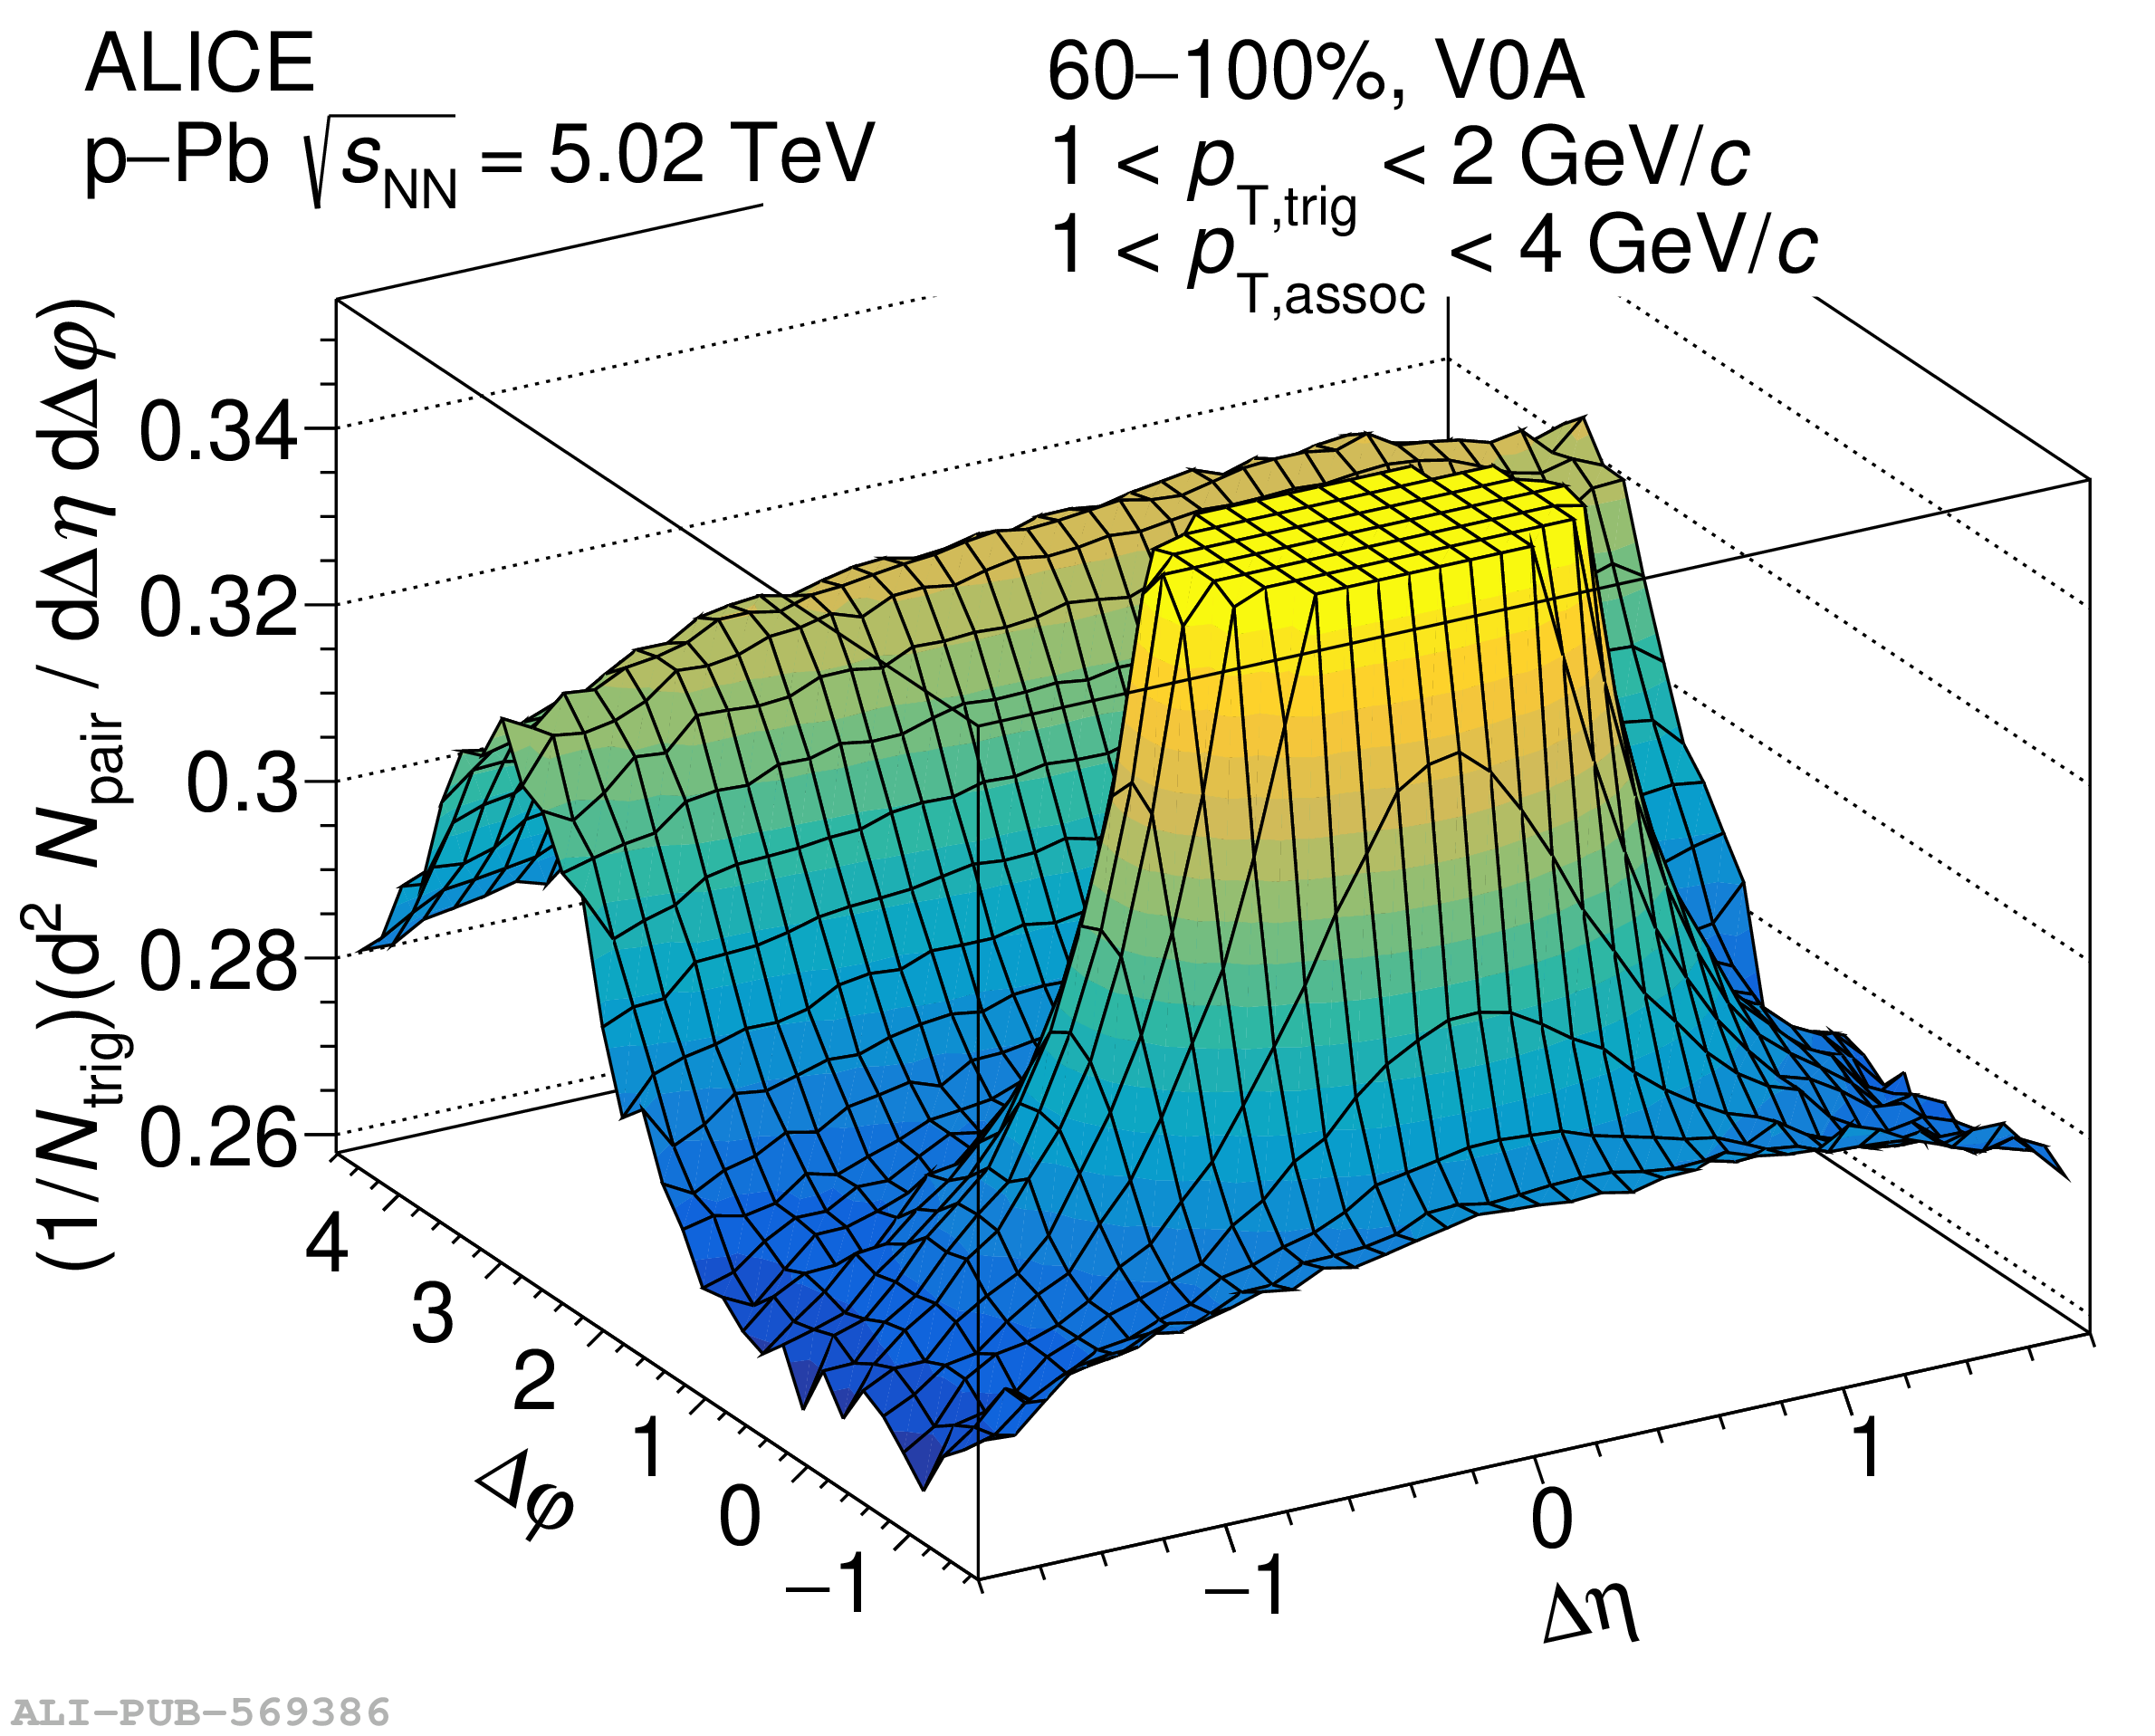 |
Figure 2
Per-trigger yield in $1.6<|\Delta\eta|<1.8$ extracted from 0$-$0.1% and 60$-$100% multiplicity percentile events in $\sqrt{s}=13$ TeV pp collisions. The data are fitted with the template fit method described by Eq. 3. The black markers show the signal for the 0$-$0.1% multiplicity percentile. The red squares correspond to the low-multiplicity signal. The red and gray curves correspond to the extracted $v_{2,2}$ and $v_{3,3}$ signals, respectively. To improve visibility, the baselines of flow signals are shifted by $FY_{\mathrm{LM,min}}$, which represents the minimum yield of $FY_{\mathrm{LM}}(\Delta\varphi)$. The signal-to-fit ratio is shown in the bottom panel. The $\chi^{2}$ divided by the number of degrees of freedom is 0.894. | 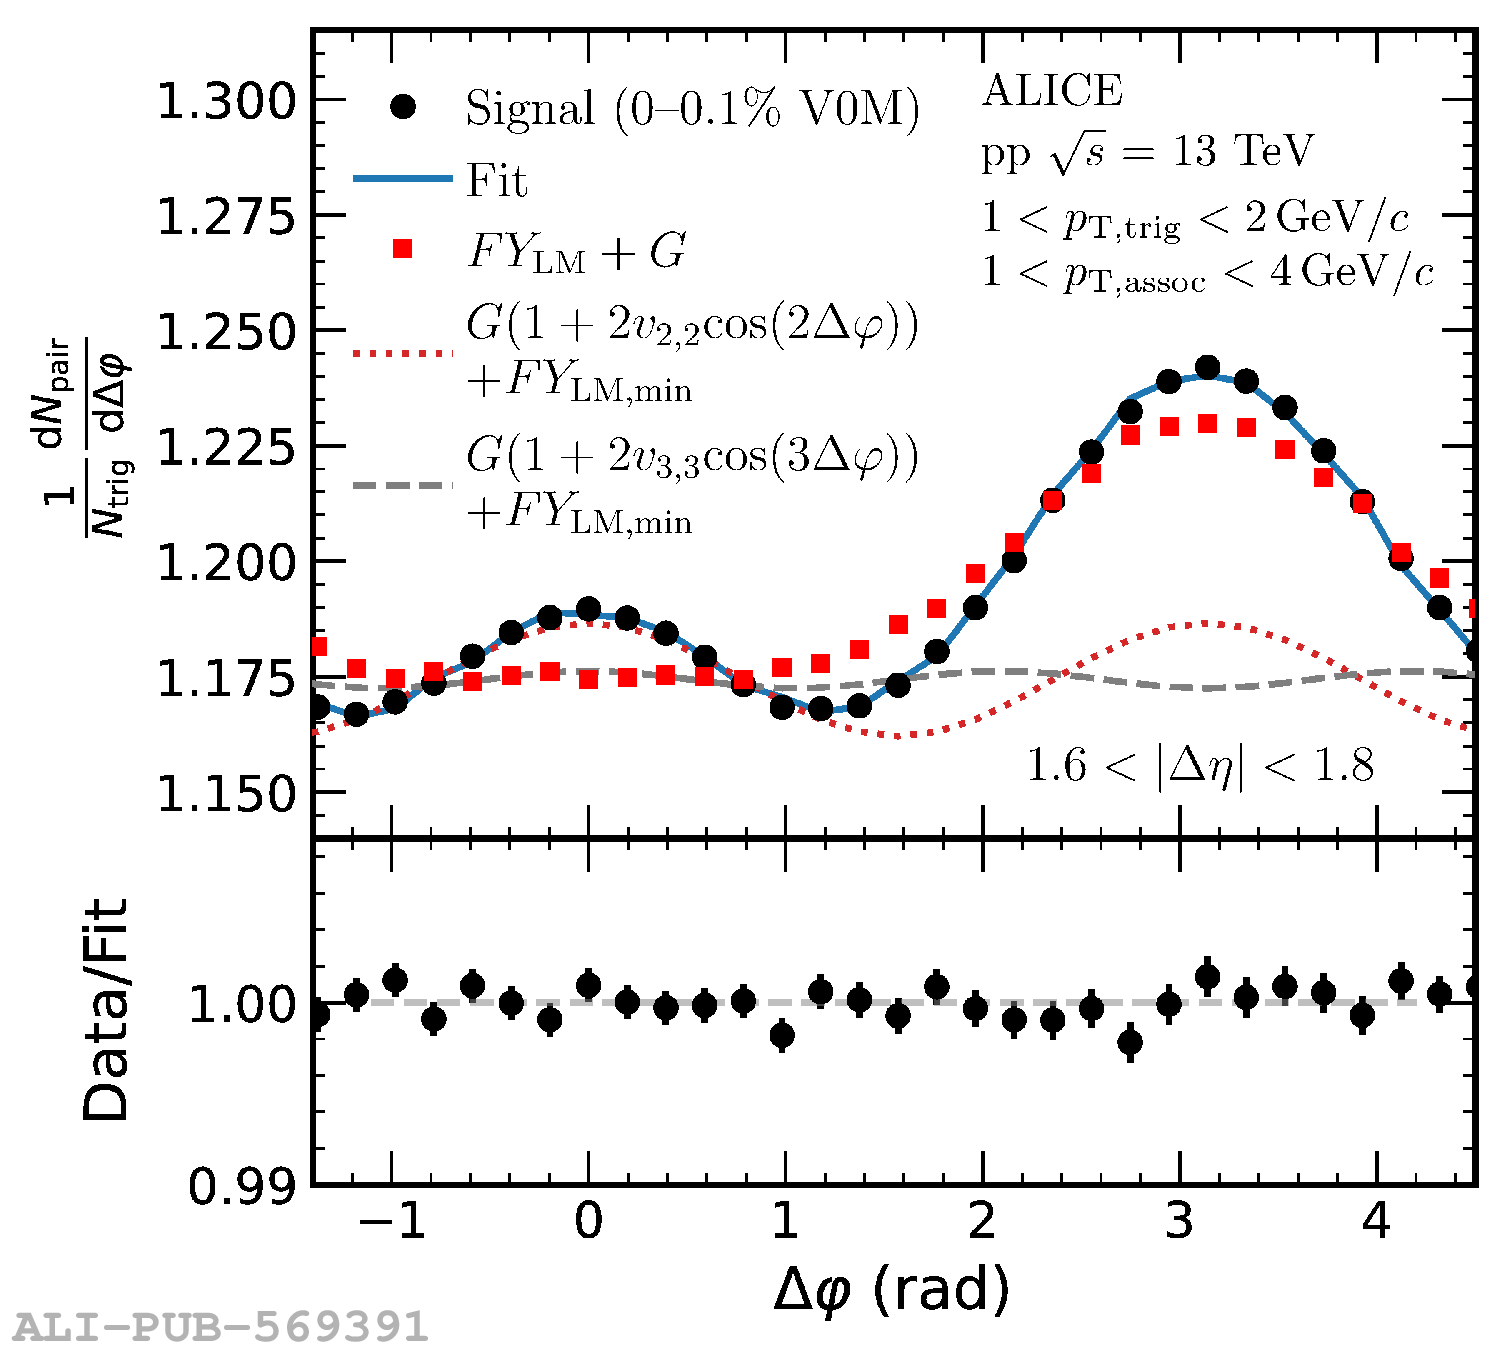 |
Figure 3
The $Y_{\rm{frag}}$ for the near- and away-side as a function of multiplicity percentiles with both ALICE and PYTHIA data. Systematic uncertainties are represented by the boxes. The bottom panel presents ratios of the yields. Here the reported uncertainty is obtained by adding statistical error and systematic uncertainty in quadrature. For PYTHIA, the statistical uncertainty is smaller than the thickness of the lines. | 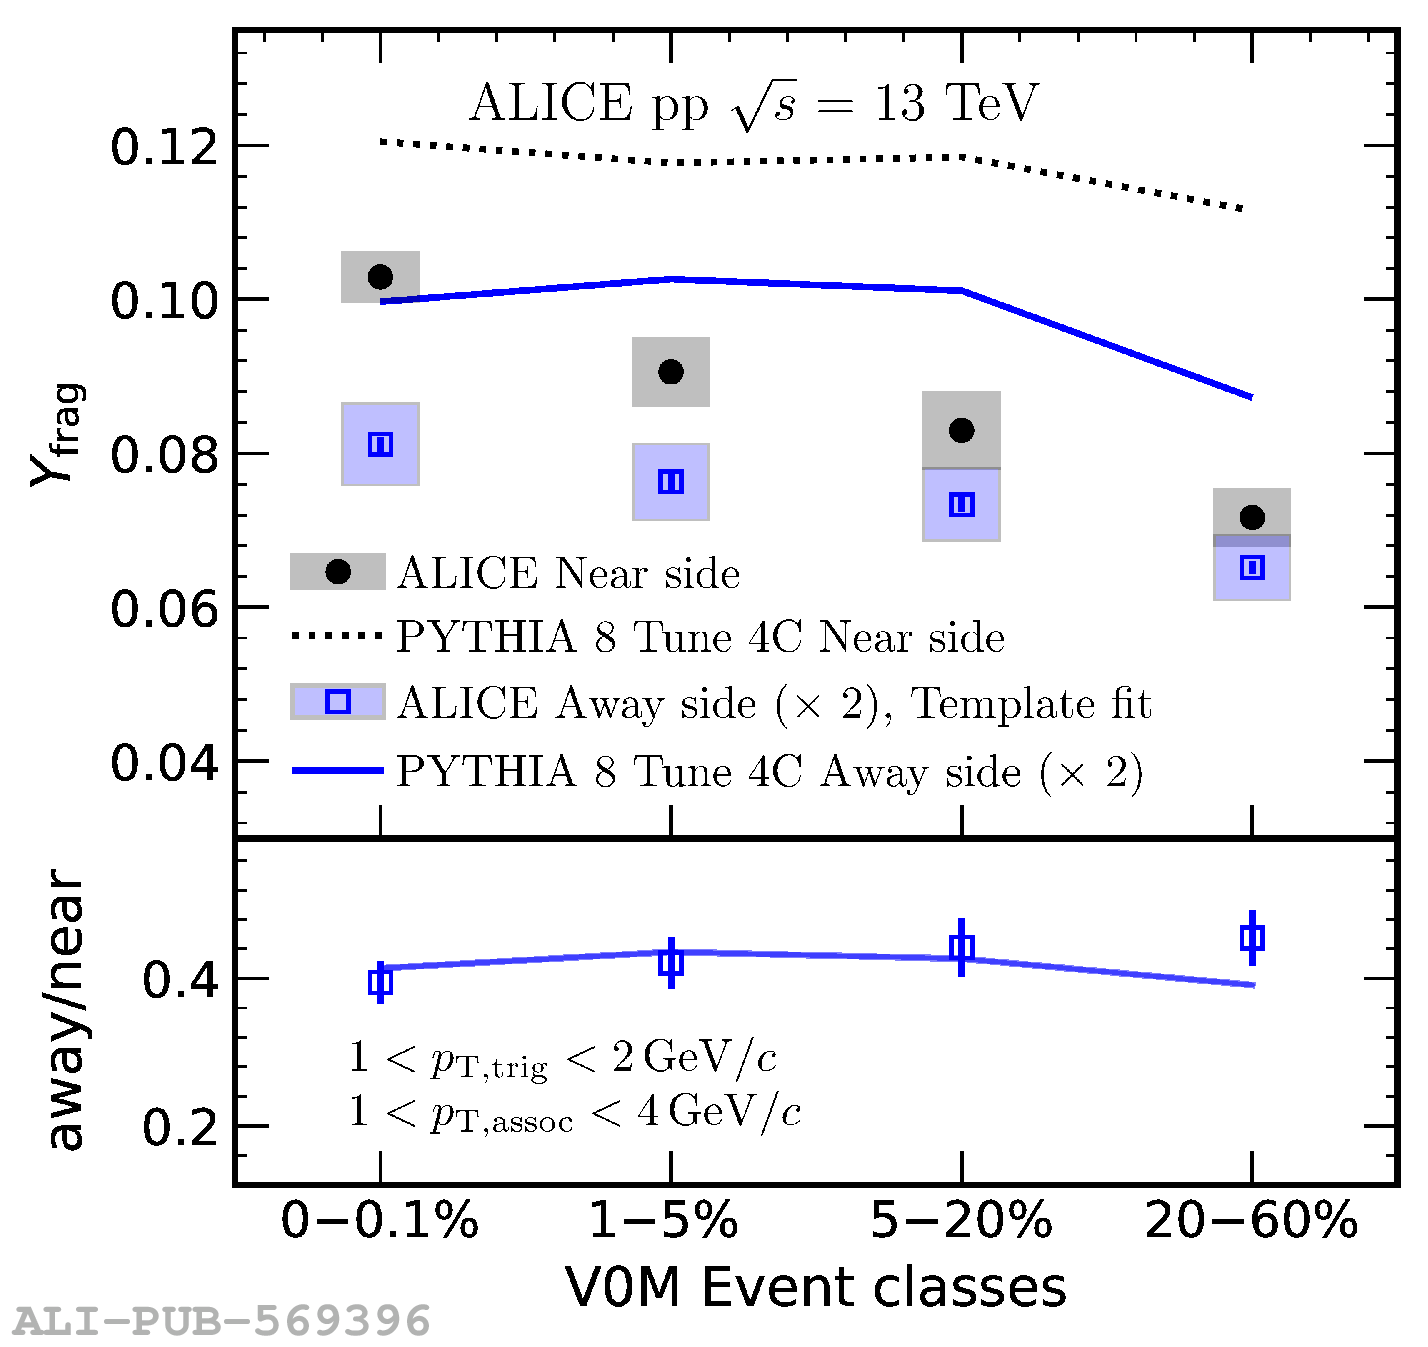 |
Figure 4
The magnitude of $v_2$ (left) and $v_3$ (right) as a function of $p_\mathrm{T}$ for the 0$-$0.1\% multiplicity interval in pp collisions at $\sqrt{s}=13$ TeV and 0$-$20\% in p$-$Pb collisions at $\sqrt{s_\mathrm{NN}} = 5.02$ TeV. The boxes around the data points represent the estimated systematic uncertainty and the error bars correspond to statistical errors. | 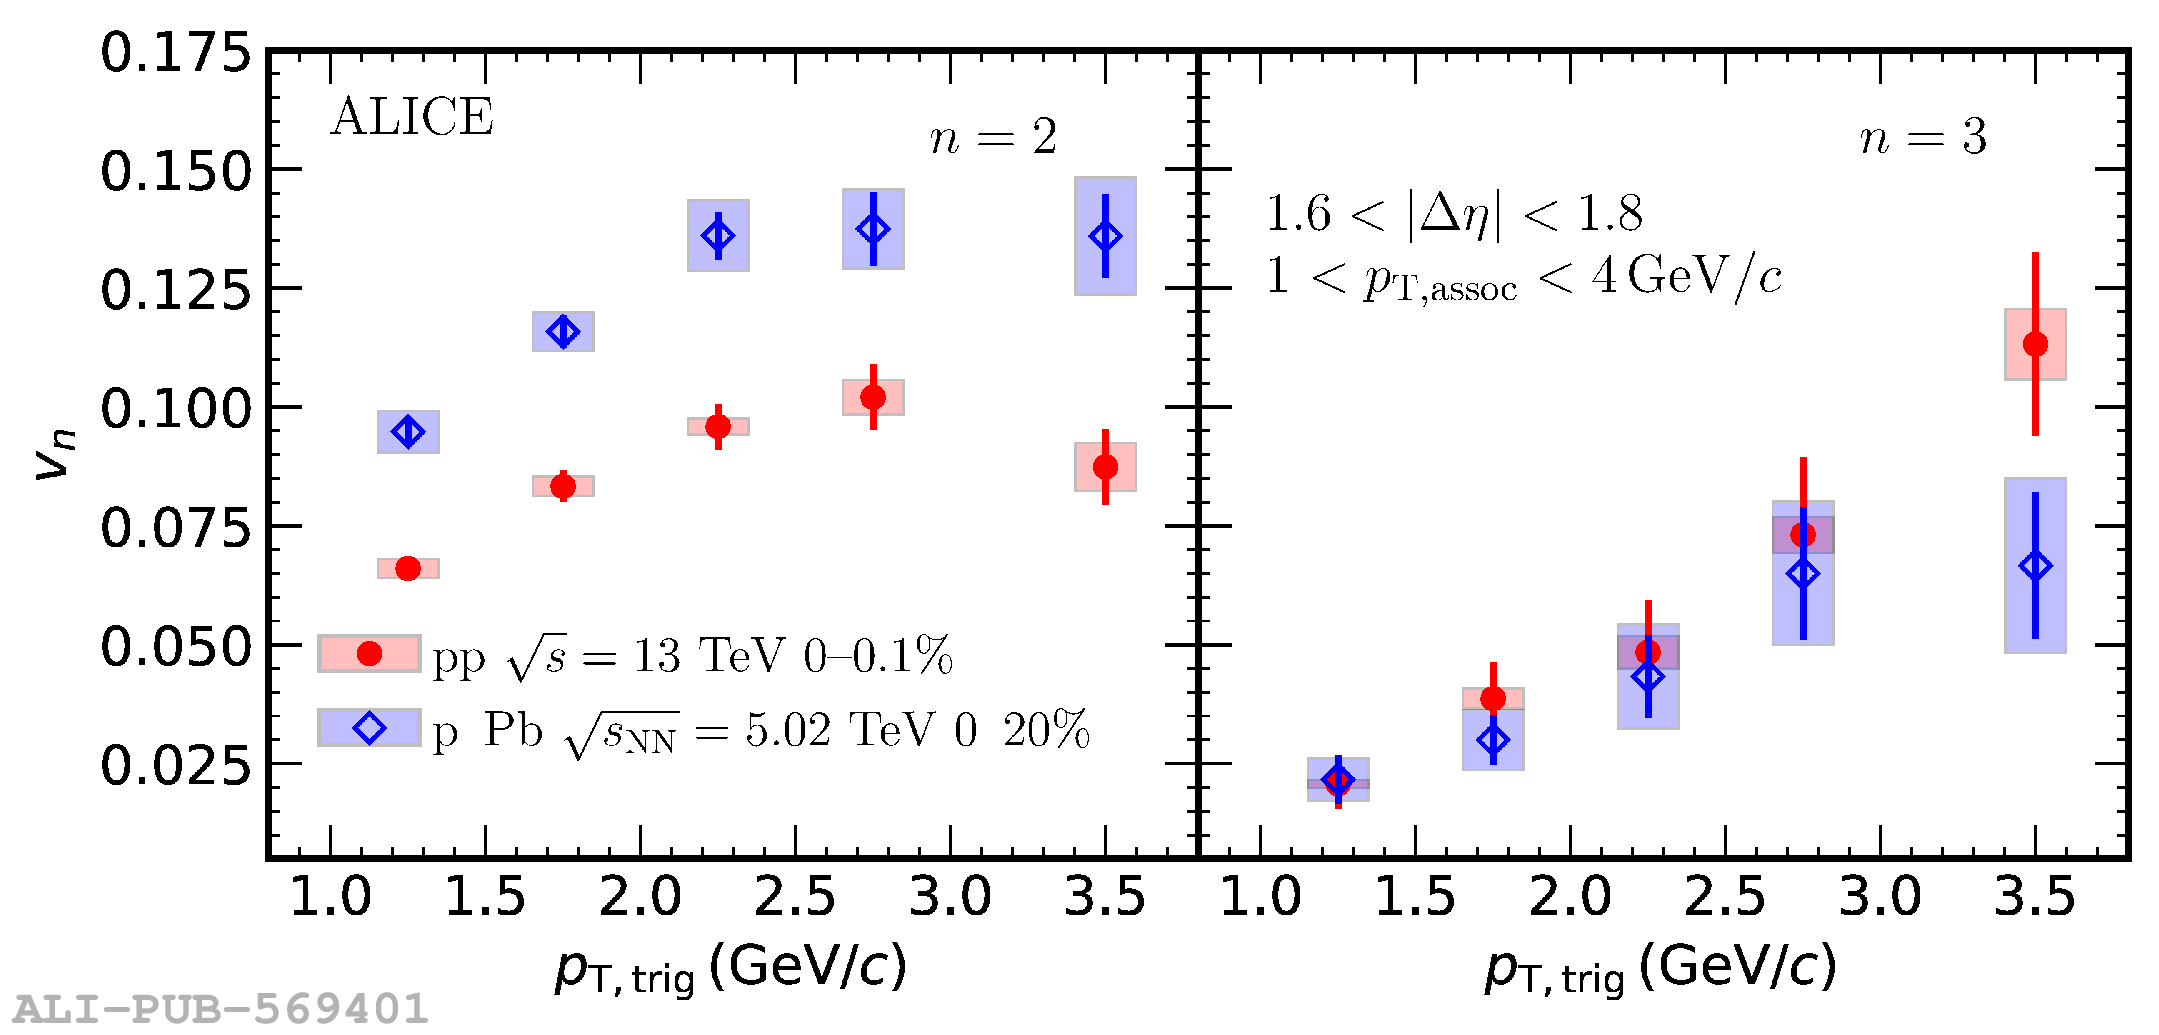 |
Figure 5
The magnitudes of $v_2$ (left panel) and $v_3$ (right panel) for two different collision systems, pp and p$-$Pb as a function of charged-particle multiplicity at midrapidity. For pp collisions, two different $p_\mathrm{T}$ intervals are shown, $1.0< \pt< 2.0$ GeV/$c$ and $1.0< \pt< 4.0$ GeV/$c$. The boxes around the data points represent the estimated systematic uncertainties and the error bars corresponds to statistical errors. | 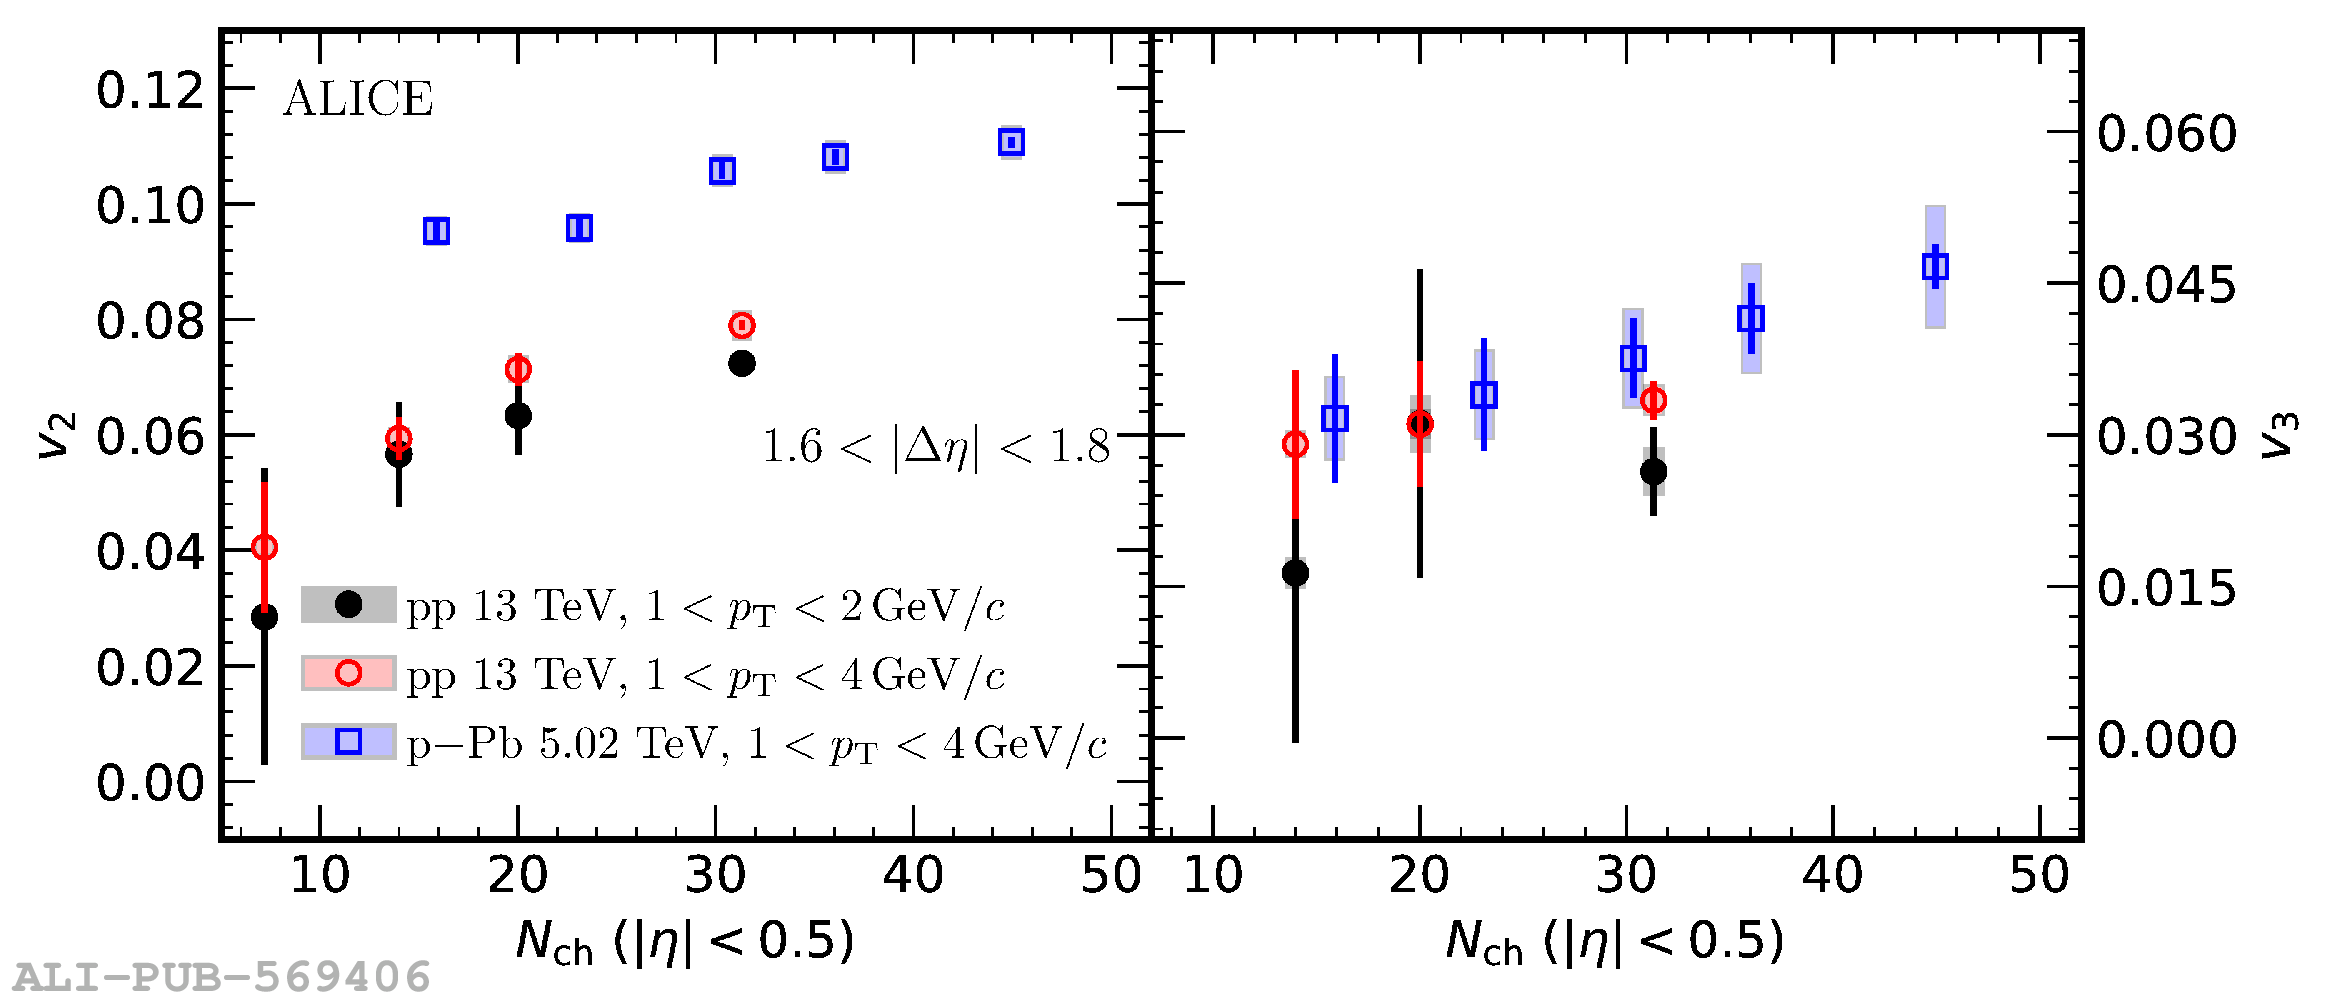 |
Figure 6
The magnitudes of $v_2$ (top) and $v_3$ (bottom) as a function of $\it{p}^{\rm{LP}}_{\rm{T,min}}$ (left) and $\it{p}^{\rm{jet}}_{\rm{T,min}}$ (right) for the high-multiplicity in pp collisions at $\sqrt{s}=13$ TeV. The measured $p_{\mathrm{T}}$ intervals are $1< \pt< 2$ GeV/$c$ (in red) and $1< \pt< 4$ GeV/$c$ (in black). The statistical errors and systematic uncertainties are shown as vertical bars and boxes, respectively. | 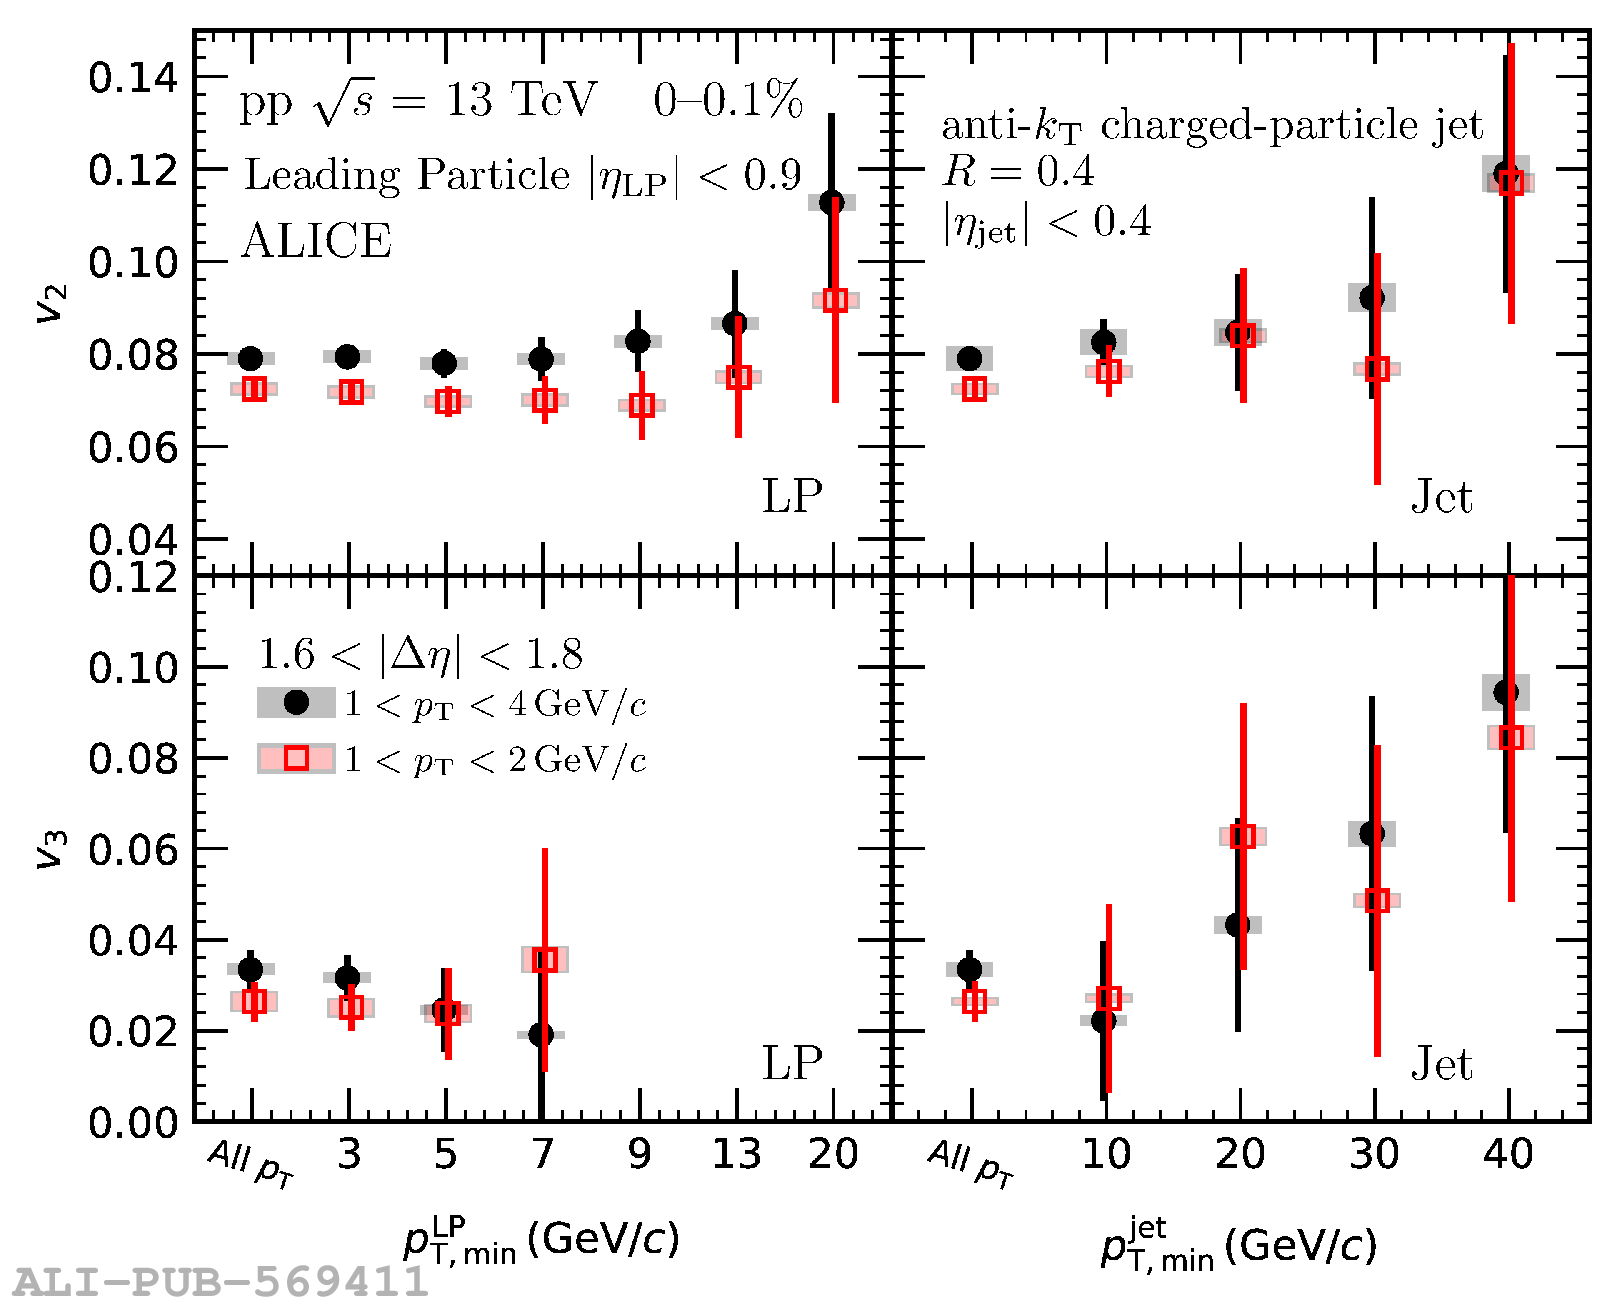 |
Figure 7
The measured and calculated evolution of $v_2$ (left) and $v_3$ (right) in pp and p--Pb collisions as a function of charged-particle multiplicity at midrapidity The blue and red markers represent the measured p--Pb and pp data, respectively. The calculations provided by hydrodynamical models are presented with colored lines. The corresponding bands mark their statistical uncertainty. For GubsHyd calculations, the statistical uncertainty is smaller than the line thickness. | 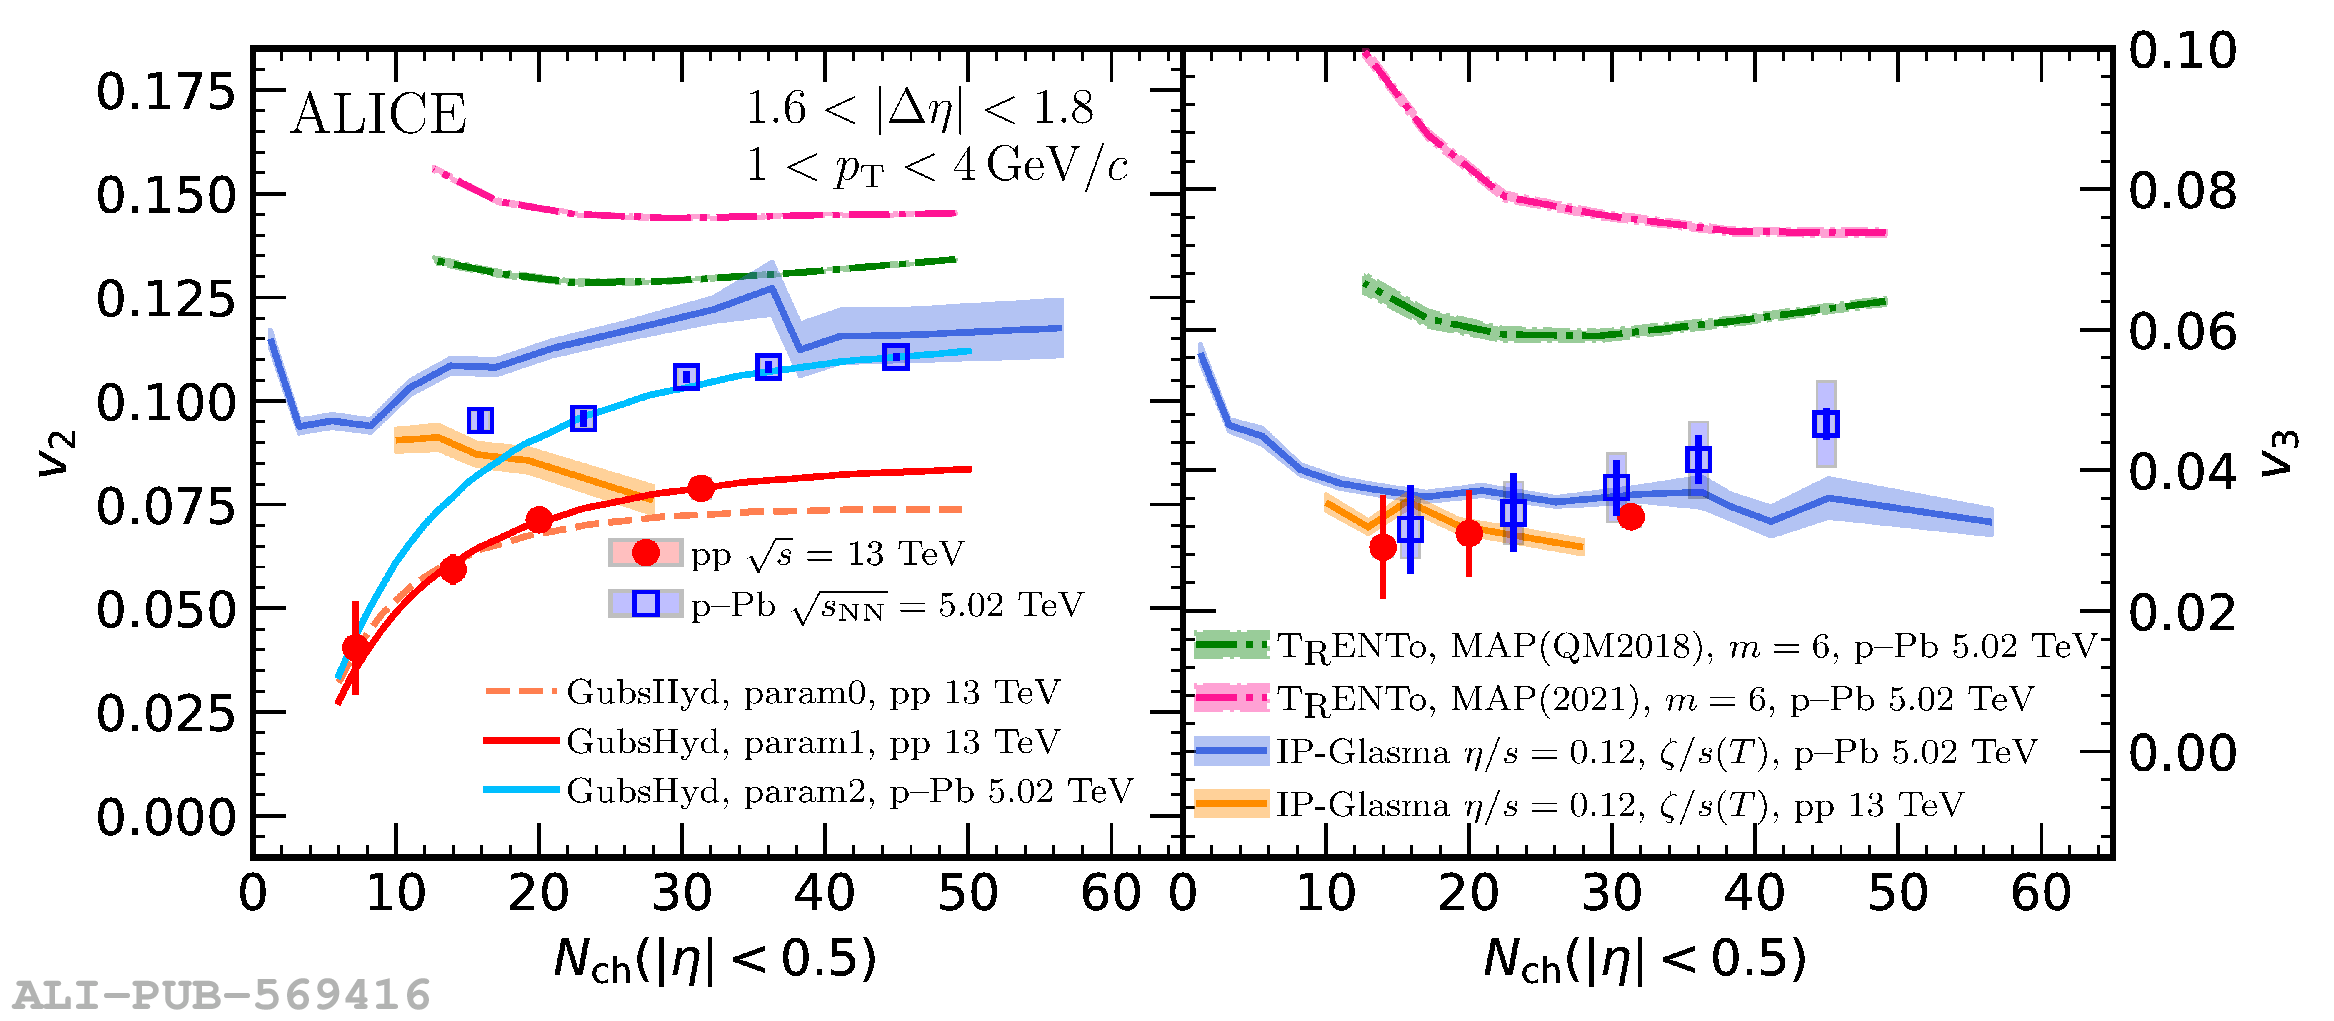 |