The measured and calculated evolution of $v_2$ (left) and $v_3$ (right) in pp and p--Pb collisions as a function of charged-particle multiplicity at midrapidity The blue and red markers represent the measured p--Pb and pp data, respectively. The calculations provided by hydrodynamical models are presented with colored lines. The corresponding bands mark their statistical uncertainty. For GubsHyd calculations, the statistical uncertainty is smaller than the line thickness. | 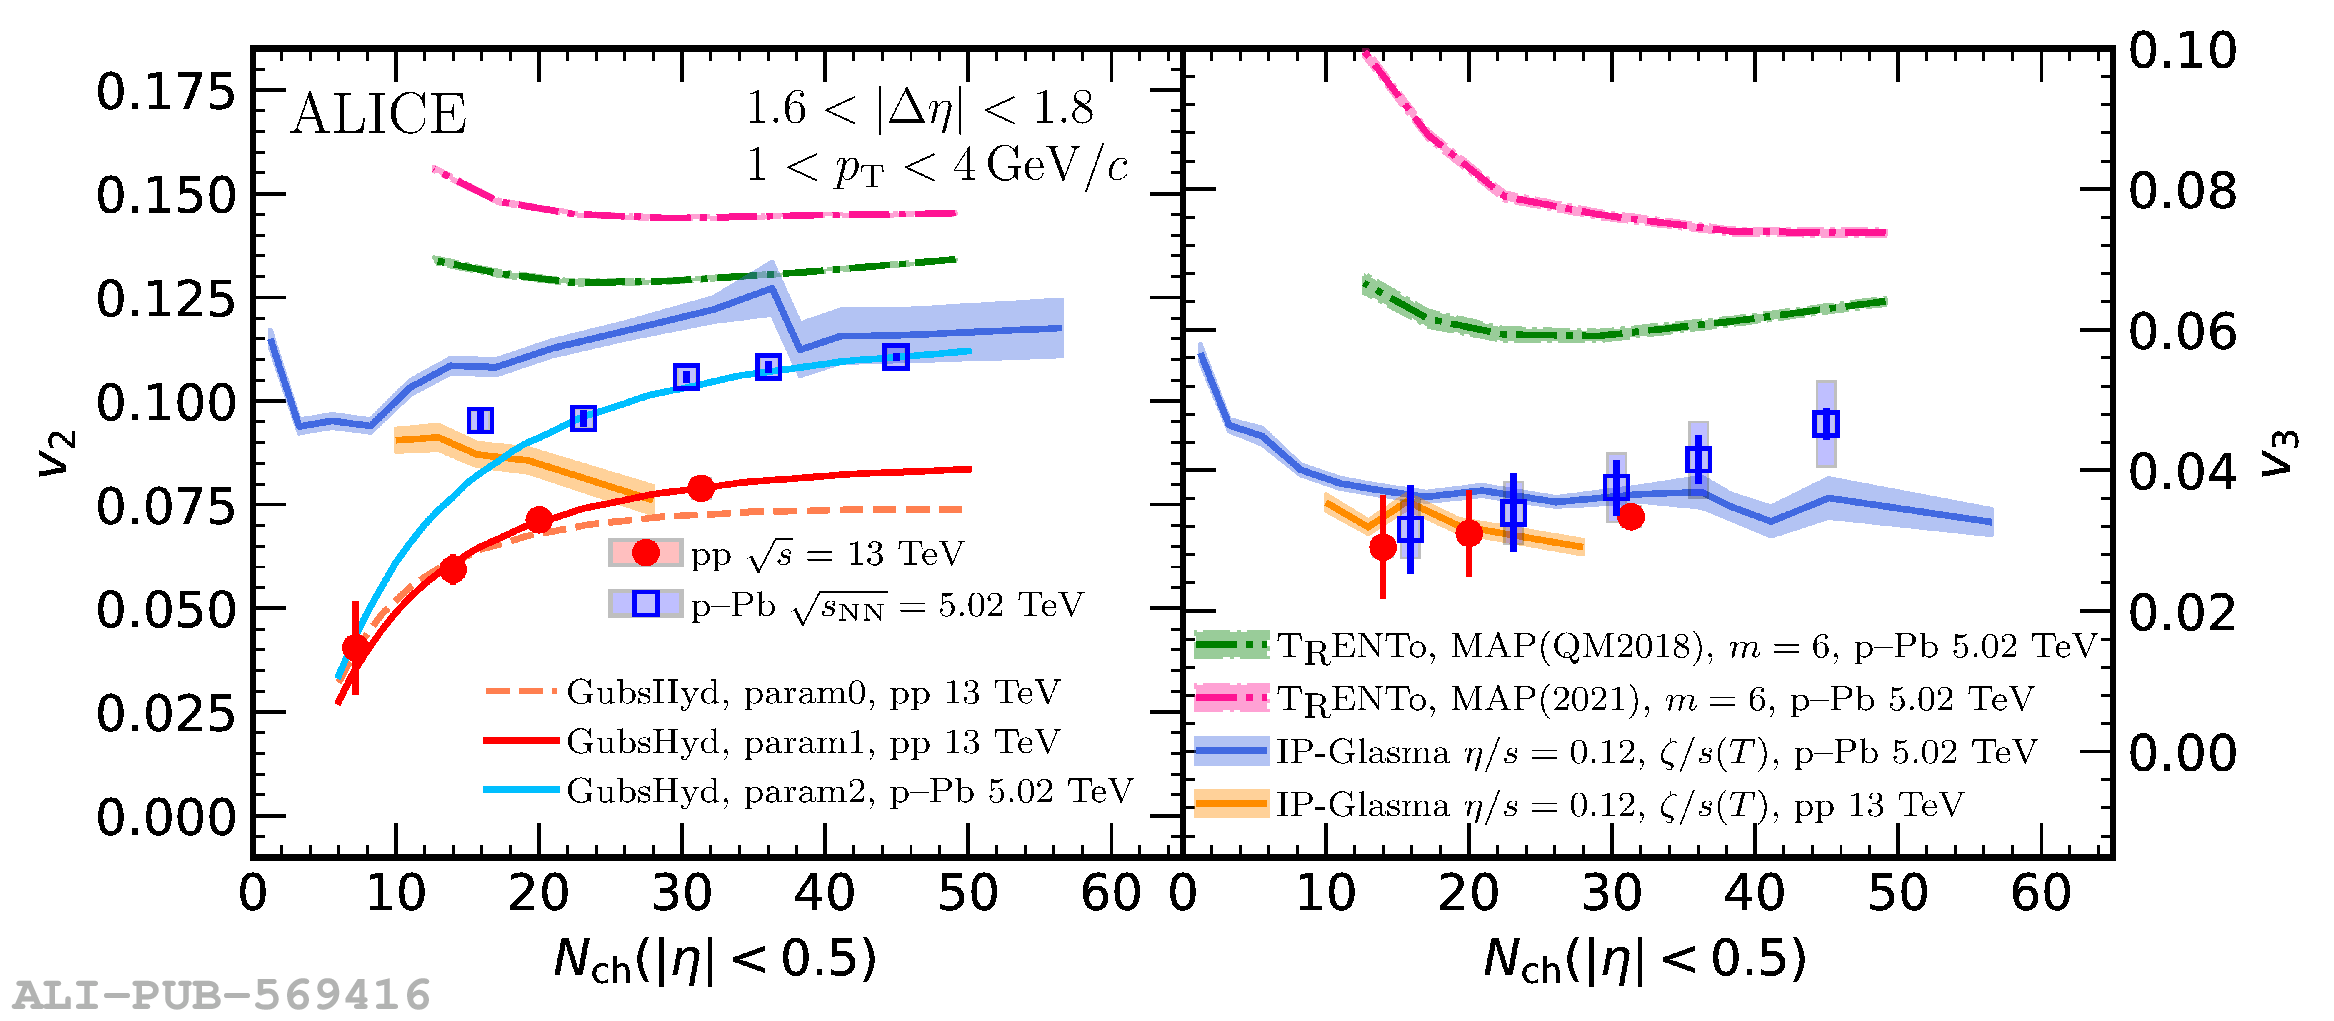 |