The magnitude of $v_2$ (left) and $v_3$ (right) as a function of $p_\mathrm{T}$ for the 0$-$0.1\% multiplicity interval in pp collisions at $\sqrt{s}=13$ TeV and 0$-$20\% in p$-$Pb collisions at $\sqrt{s_\mathrm{NN}} = 5.02$ TeV. The boxes around the data points represent the estimated systematic uncertainty and the error bars correspond to statistical errors. | 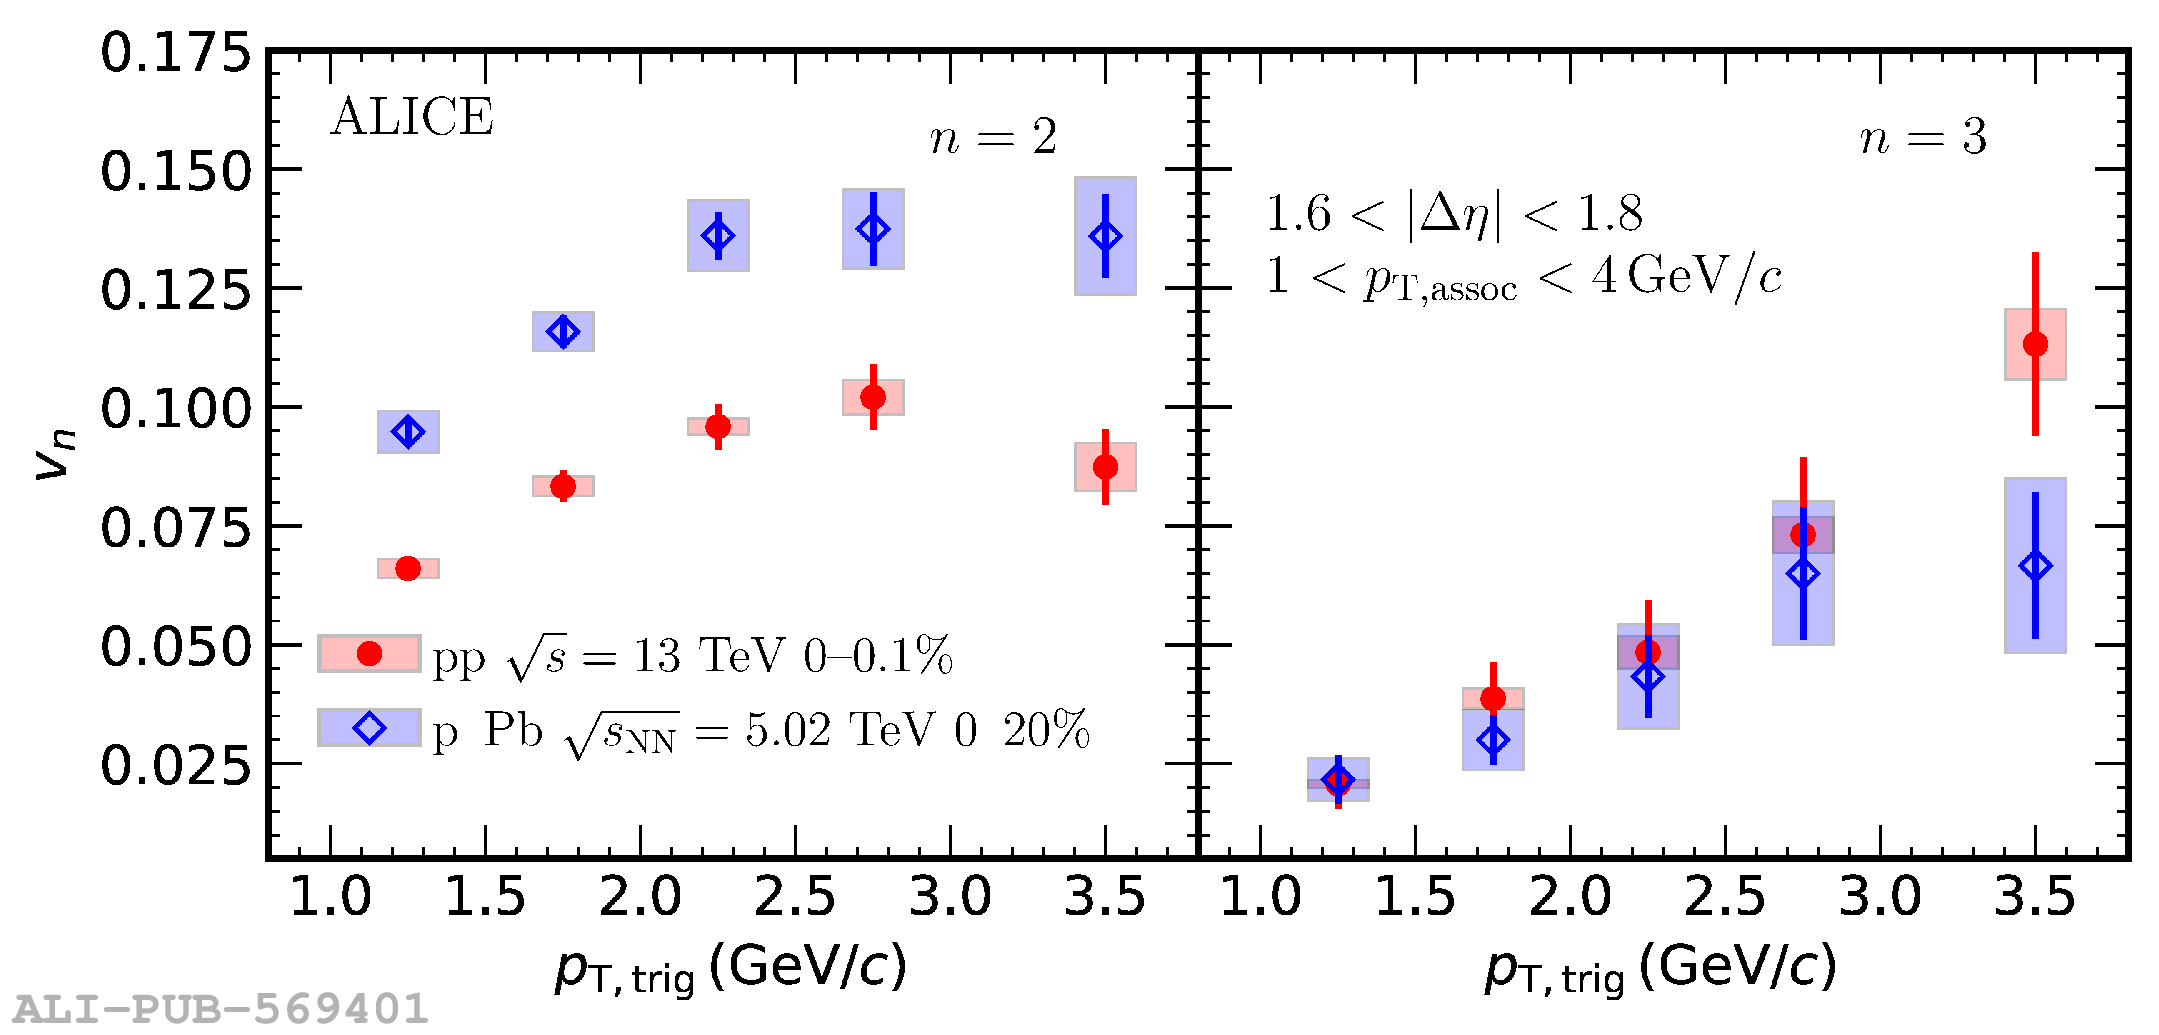 |