The production of $\pi^{\pm}$, $\rm{K}^{\pm}$, $\rm{K}^{0}_{S}$, $\rm{K}^{*}(892)^{0}$, $\rm{p}$, $\phi(1020)$, $\Lambda$, $\Xi^{-}$, $\Omega^{-}$, and their antiparticles was measured in inelastic proton-proton (pp) collisions at a center-of-mass energy of $\sqrt{s}$ = 13 TeV at midrapidity ($|y|<~0.5$) as a function of transverse momentum ($p_{\rm{T}}$) using the ALICE detector at the CERN LHC. Furthermore, the single-particle $p_{\rm{T}}$ distributions of $\rm{K}^{0}_{S}$, $\Lambda$, and $\overline{\Lambda}$ in inelastic pp collisions at $\sqrt{s}$ = 7 TeV are reported here for the first time. The $p_{\rm{T}}$ distributions are studied at midrapidity within the transverse momentum range $0\leq p_{\rm{T}}\leq20$ GeV/$c$, depending on the particle species. The $p_{\rm{T}}$ spectra, integrated yields, and particle yield ratios are discussed as a function of collision energy and compared with measurements at lower $\sqrt{s}$ and with results from various general-purpose QCD-inspired Monte Carlo models. A hardening of the spectra at high $p_{\rm{T}}$ with increasing collision energy is observed, which is similar for all particle species under study. The transverse mass and $x_{\rm{T}}\equiv2p_{\rm{T}}/\sqrt{s}$ scaling properties of hadron production are also studied. As the collision energy increases from $\sqrt{s}$ = 7 to 13 TeV, the yields of non- and single-strange hadrons normalized to the pion yields remain approximately constant as a function of $\sqrt{s}$, while ratios for multi-strange hadrons indicate enhancements. The $p_{\rm{T}}$-differential cross sections of $\pi^{\pm}$, $\rm{K}^{\pm}$ and $\rm{p}$ ($\overline{\rm{p}}$) are compared with next-to-leading order perturbative QCD calculations, which are found to overestimate the cross sections for $\pi^{\pm}$ and $\rm{p}$ ($\overline{\rm{p}}$) at high $p_{\rm{T}}$.
Eur. Phys. J. C 81 (2021) 256
HEP Data
e-Print: arXiv:2005.11120 | PDF | inSPIRE
CERN-EP-2020-059
Figure 1
The performance during the LHC Run 2 period of the ALICE central barrel detectors used for the measurements described in this paper Panels a), b), c), and d) indicate the characteristic signal distributions of identified charged particles measured by the ITS, TPC, TOF, and HMPID detector, respectively | 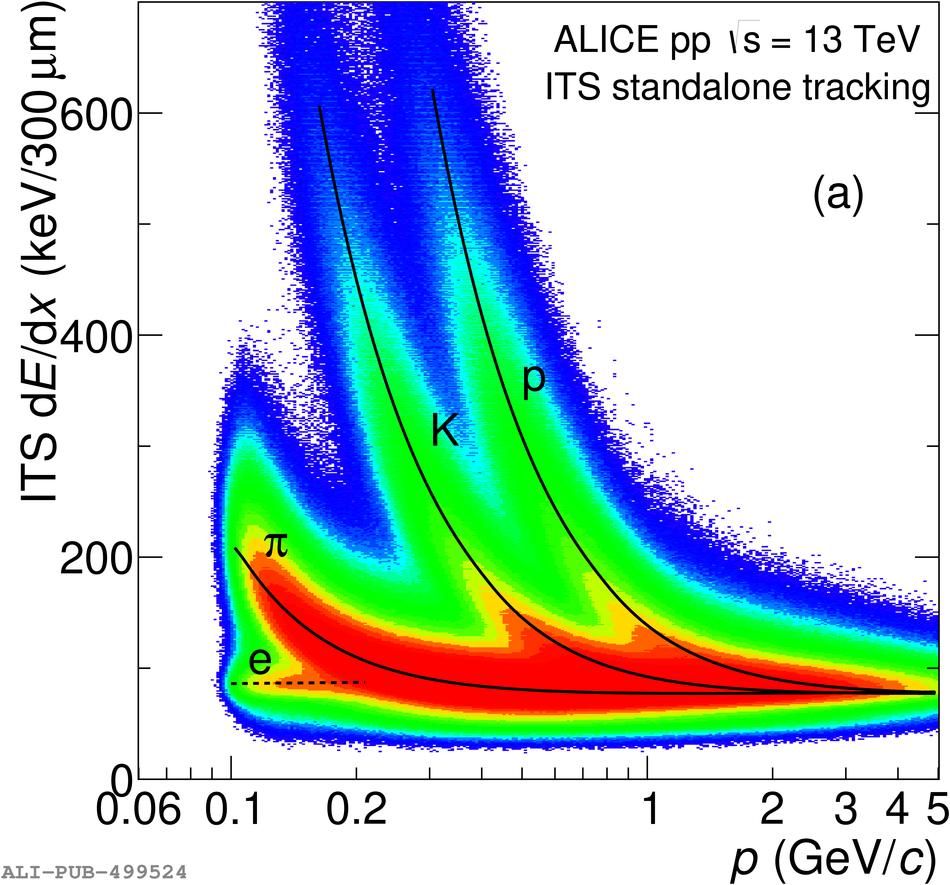 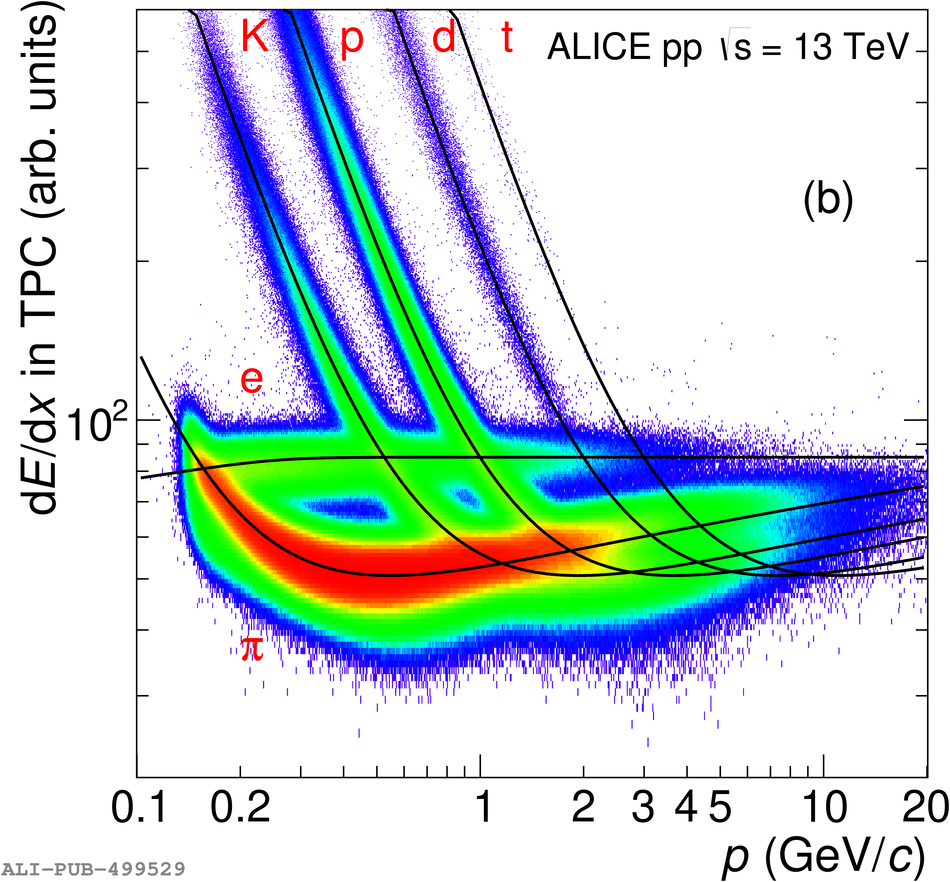 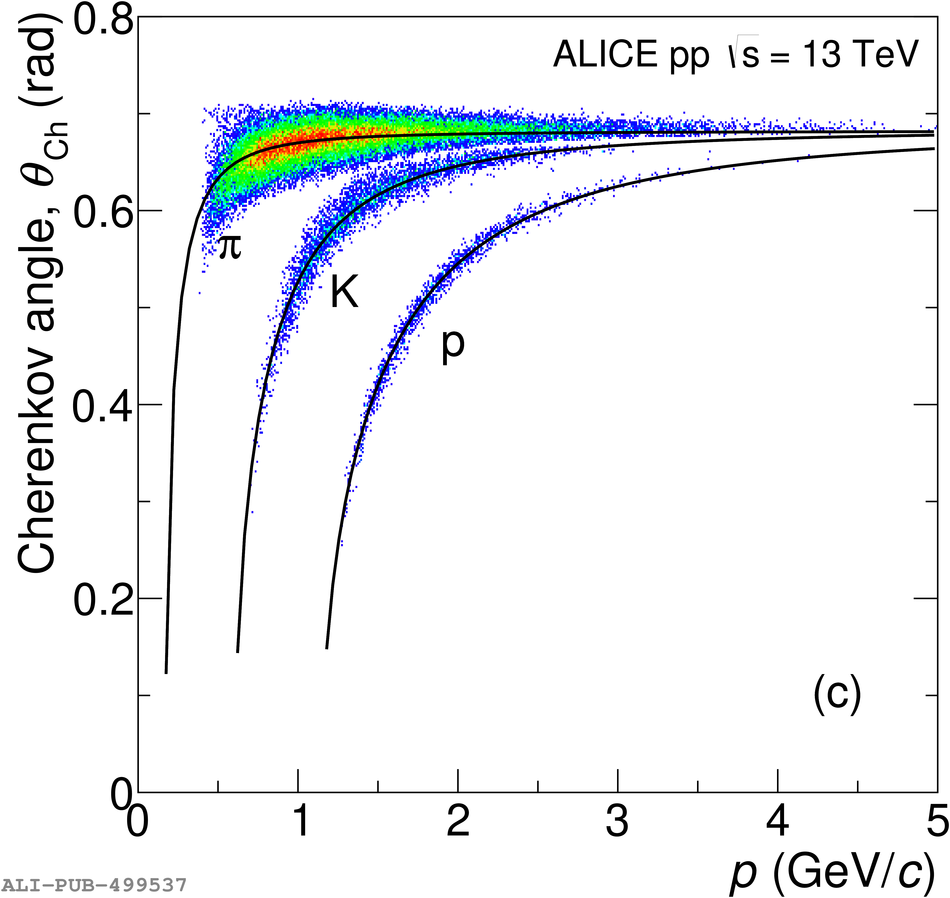 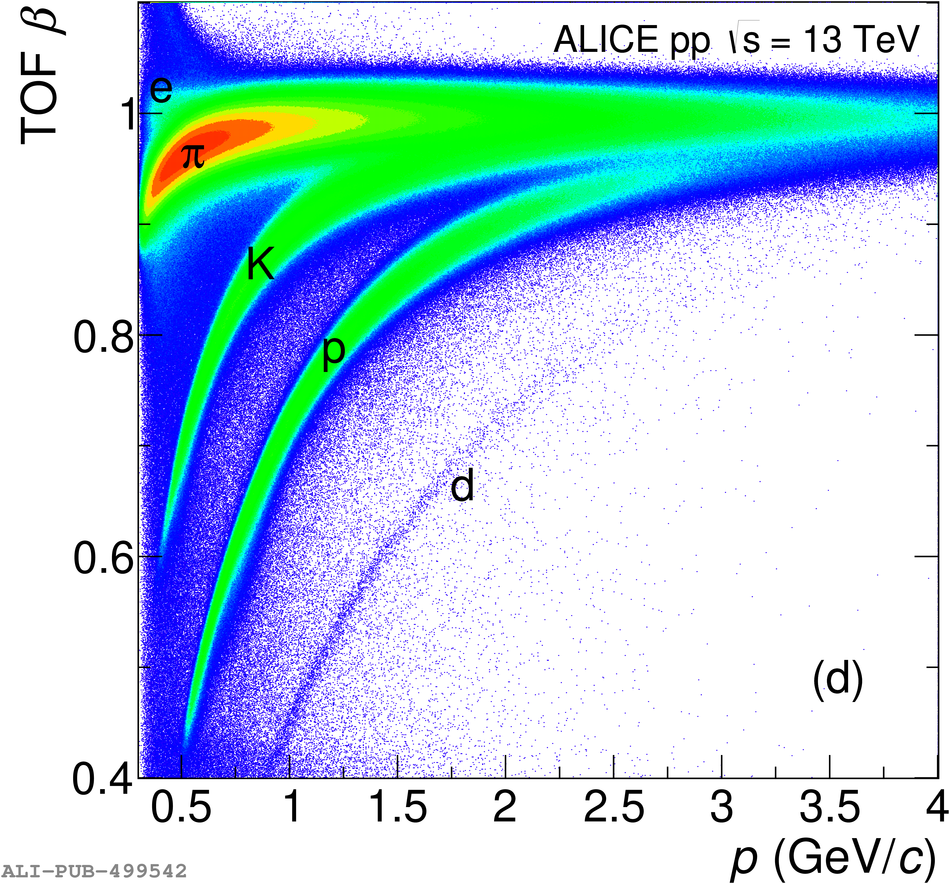 |
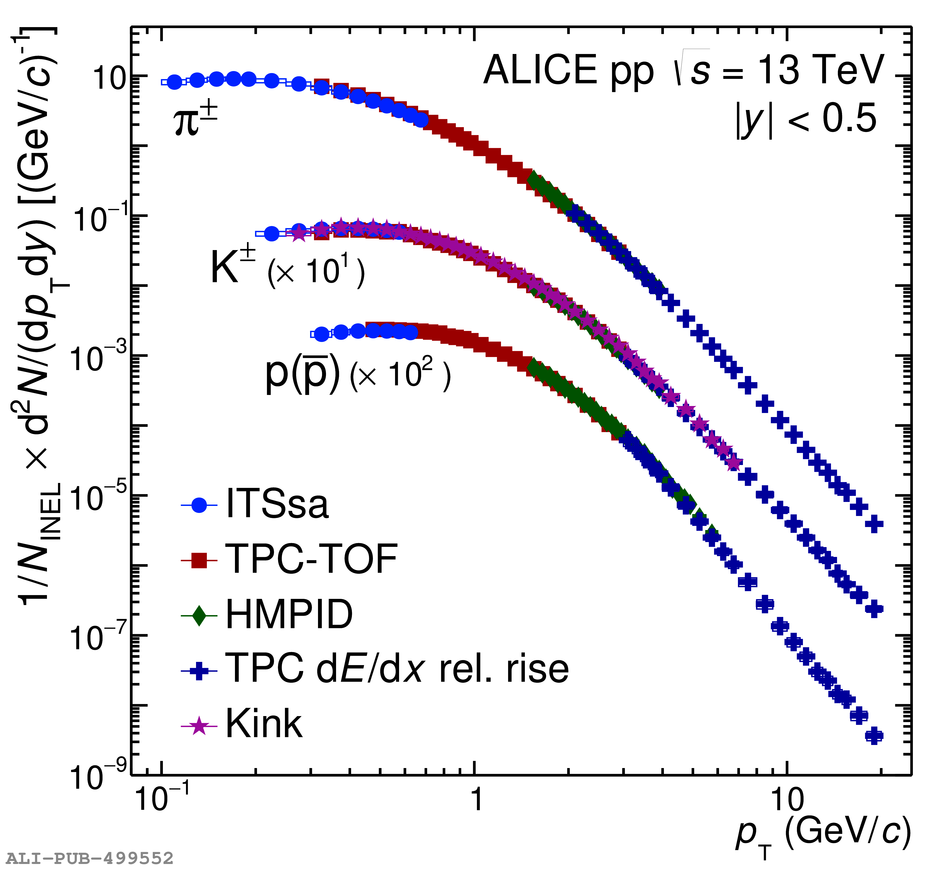
Figure 6
Ratios of the transverse-momentum spectra of light-flavor hadrons in inelastic \pp collisions at \sppt{13} to those for \sppt{7} . The ratio for \pix is shown in each panel with grey crosses and boxes. Statistical and systematic uncertainties are shown as vertical bars and boxes, respectively. The normalization uncertainty ($^{+10.8}_{-6.3}\%$) is excluded from the plotted uncertainties | 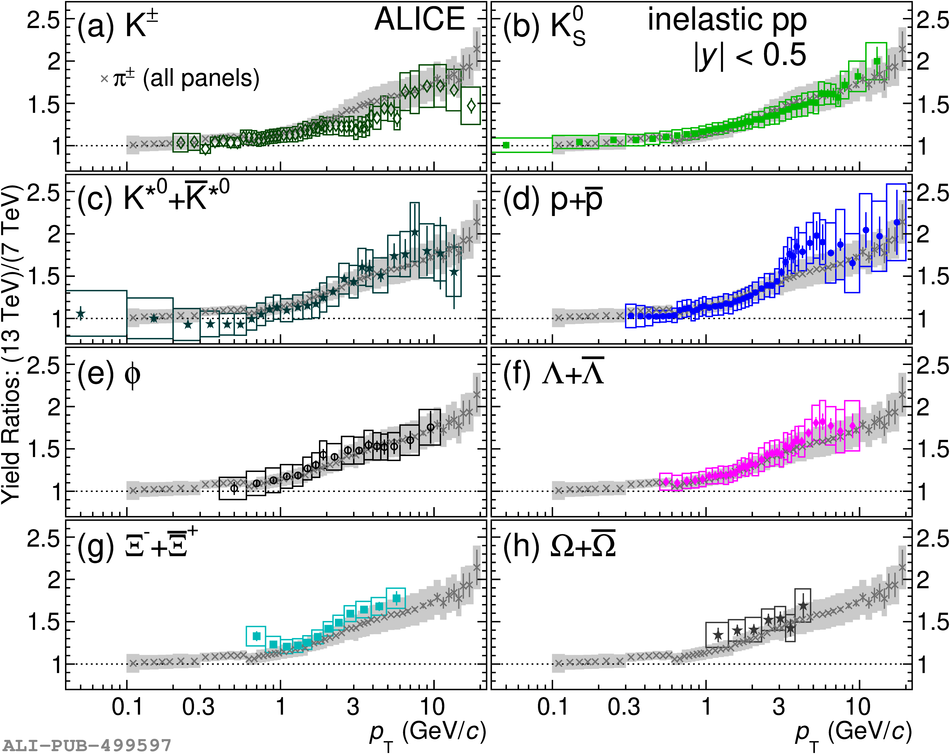 |
Figure 7
Upper panels: Scaled \mT spectra for identified particles in pp collisions at \rs[7 TeV] (left) and 13 TeV (right). Lower panels: Ratios of the scaled \mT spectra to the \kx fit functions. The reference data for \pp at \sppt{7} are from Refs. | 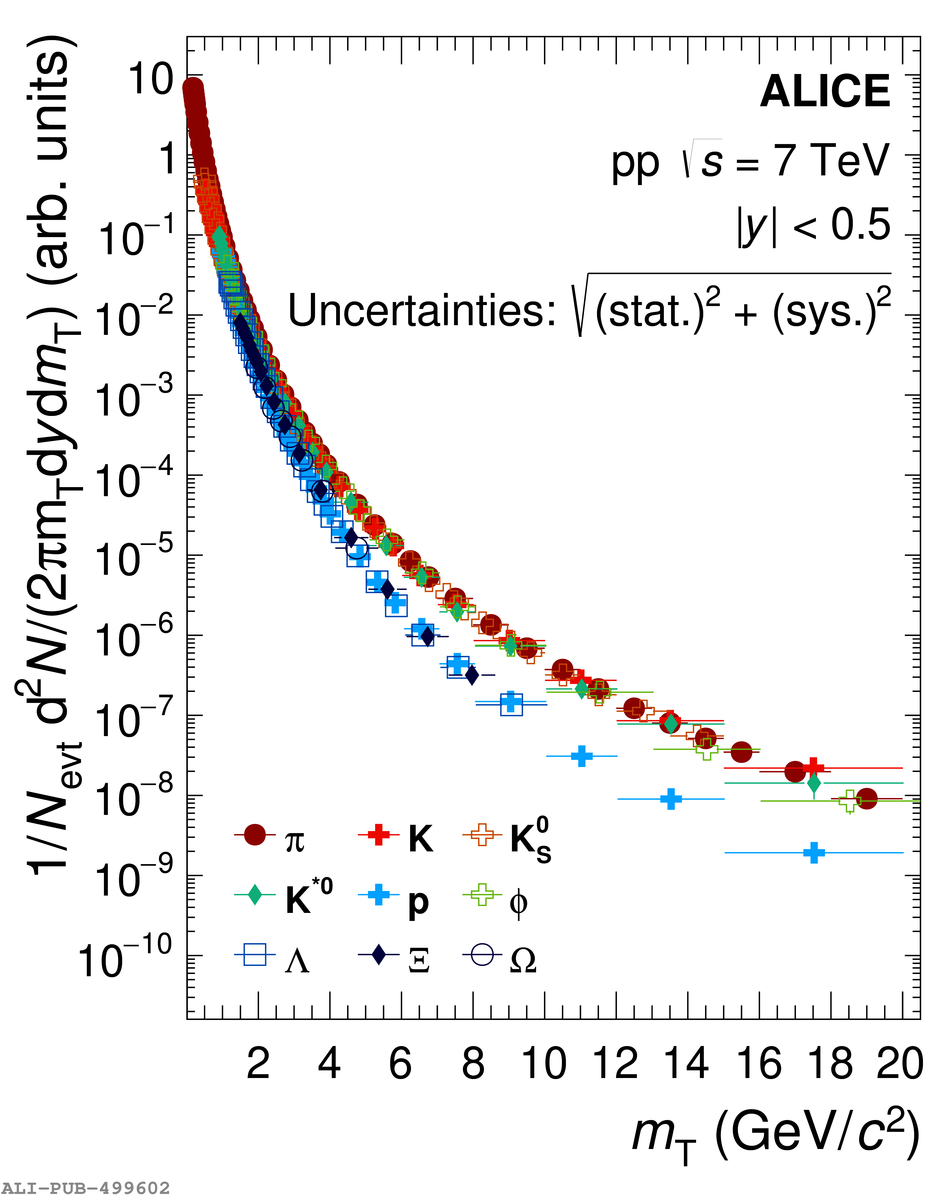 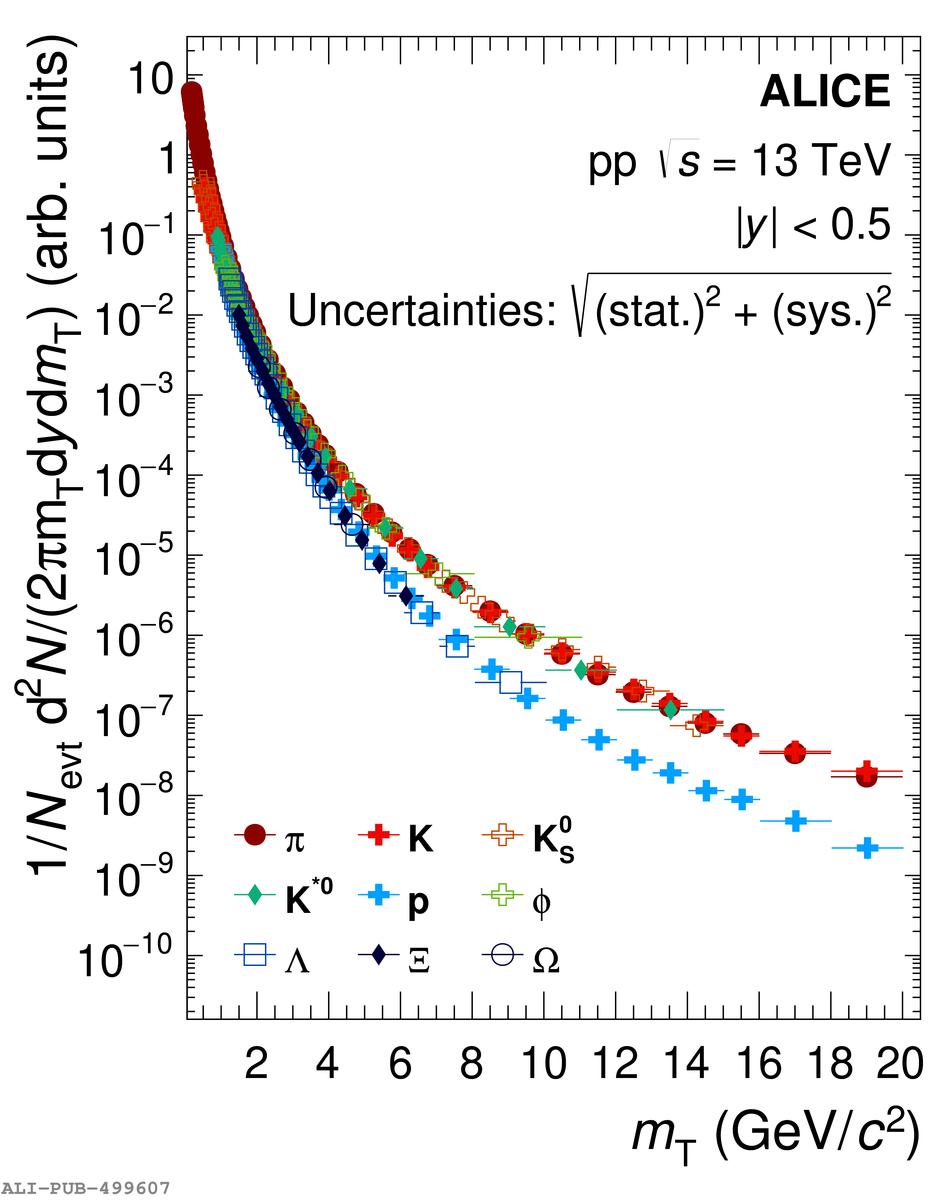 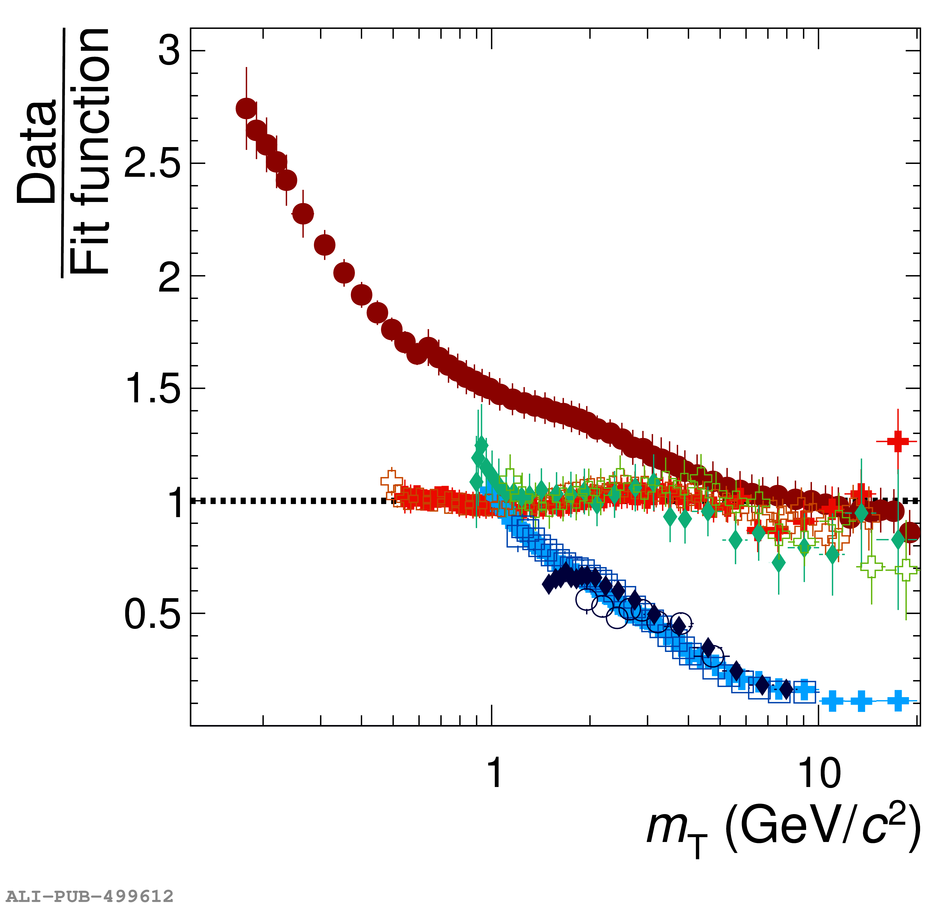 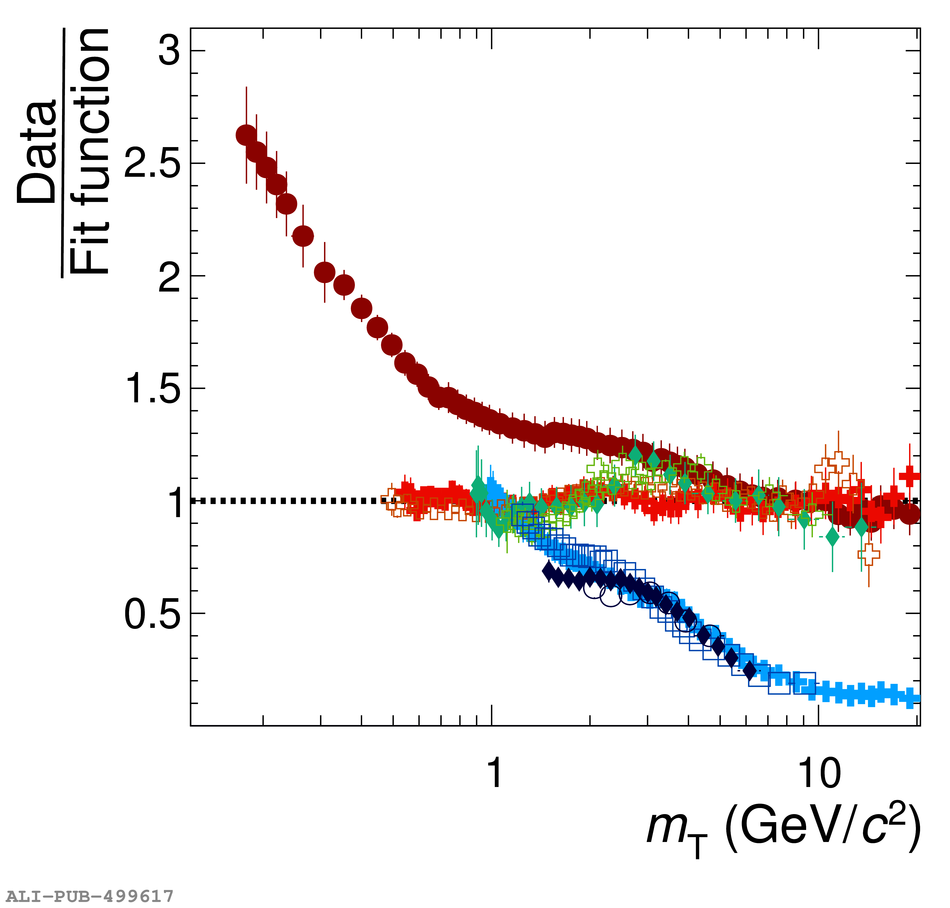 |
Figure 8
Particle ratios \kx/\pix, \kzs/\pix (top) and \ks/\pix, $\phi$/\pix (bottom) as a function of \pt measured in \pp collisions at \sppt{13}. The measured ratio is reported together with that obtained from transverse mass (\mT) scaling of charged pions shown as a solid line. The shaded red band indicates the constant fit, in the \pt region where it was performed, which is used to determine the constant offset parameter $c$. See the text for details. The \ph spectrum in \pp at \sppt{7} is from Ref. | 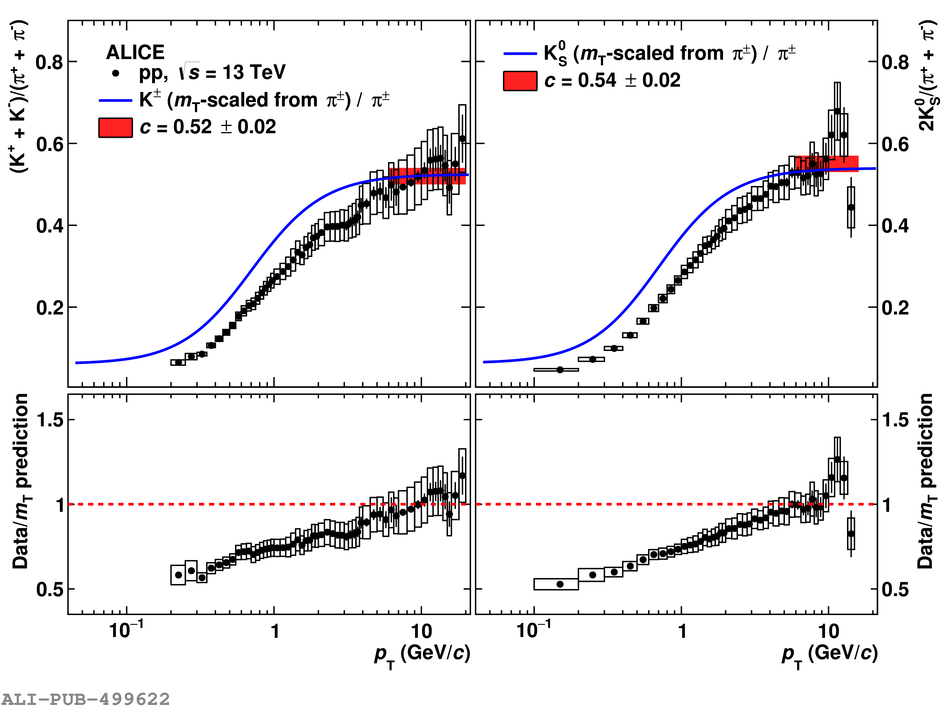 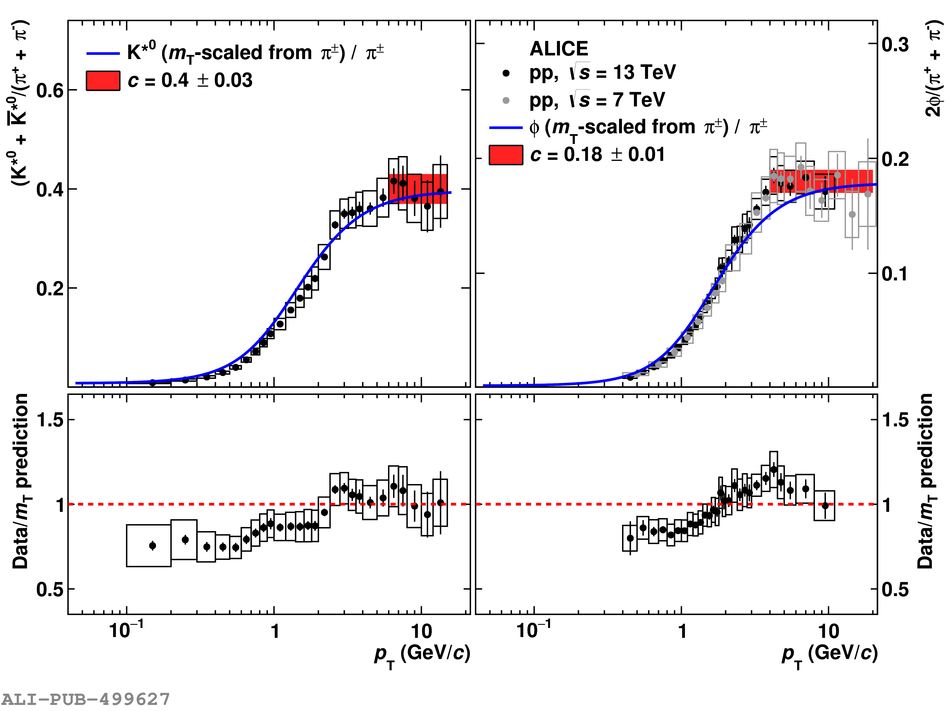 |
Figure 9
Scaled invariant yields of \pix, \kx, \px, and \ks as a function of $\xt=2\pt/\sqrt{s}$ at different collision energies of \sppt{2.76} , \sppt{7} , and \sppt{13} The solid line represents a combined power-law fit in the high-\xt region where the distributions show a scaling behavior | 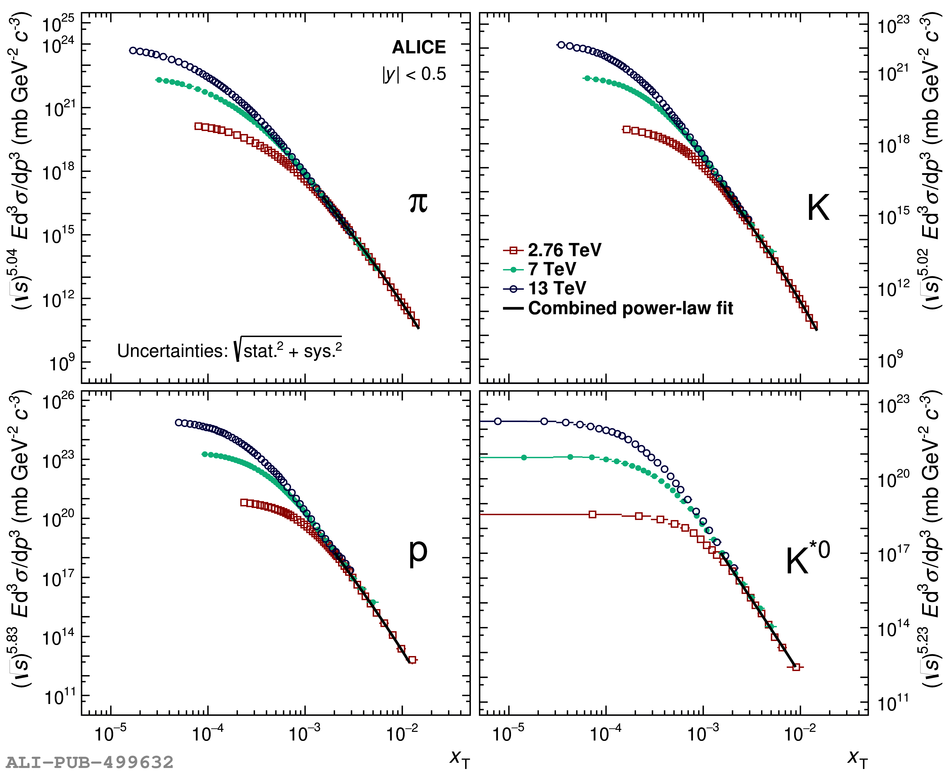 |
Figure 10
Average transverse momentum \mpt as a function of the center-of-mass energy. Open boxes indicate the statistical and systematic uncertainties (when available) summed in quadrature. Results from ALICE are compared with those from STAR measured at \sppg{200} . Some data points are slightly offset from their true energy for better visibility. Dashed curves show linear fits in $\ln{s}$. Note that the data points of \kzs are not fitted due to their very similar values of \mpt to those of charged kaons. Red data points are for \sppt{13} | 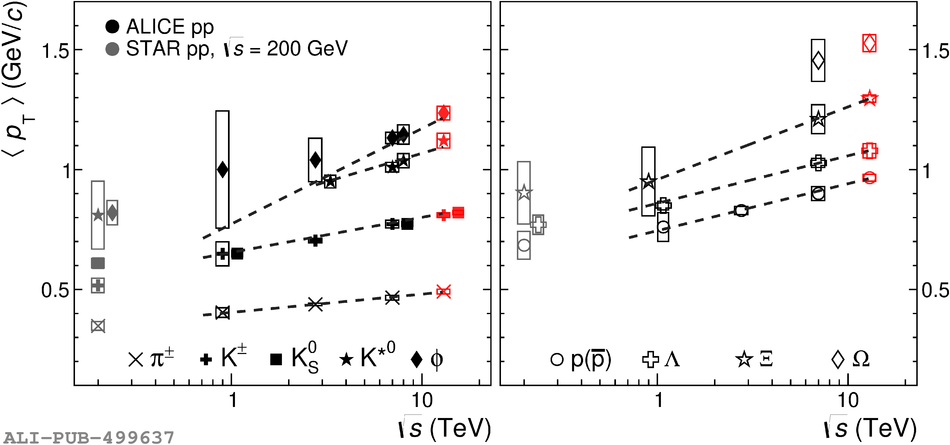 |
Figure 11
Ratio of particle yields to \pix and \kx as a function of the collision energy \cme (GeV). Results from ALICE are compared with those from CMS at the same energies, and with those from STAR at \sppg{200} and PHENIX at \sppg{62.4} obtained at BNL RHIC. The CMS data points are slightly shifted horizontally for clarity. Open boxes represent statistical and systematic uncertainties summed in quadrature. Red data points are ALICE measurements for \sppt{13} | 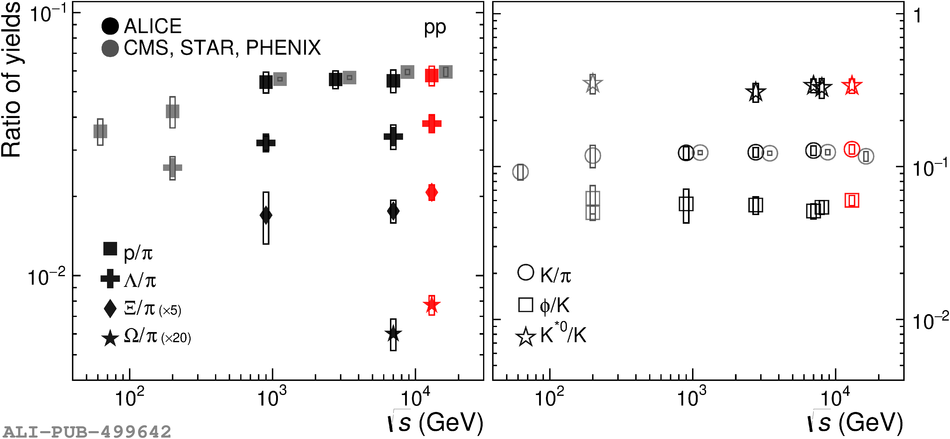 |
Figure 12
Average transverse momenta of light-flavor hadrons as a function of hadron mass (left) and as a function of hadron mass normalized to the number of constituent quarks (right) for different collision energies (\cme). Results reported from ALICE are compared with those measured by STAR at RHIC at \sppg{200} . Uncertainties that are not visible are smaller than the size of the symbol. Solid and dashed lines are drawn as visual aids and represent separate linear fits to meson and baryon data at \sppt{13}. The data points for \kzs are slightly shifted horizontally for clarity. Red data points are for \sppt{13} | 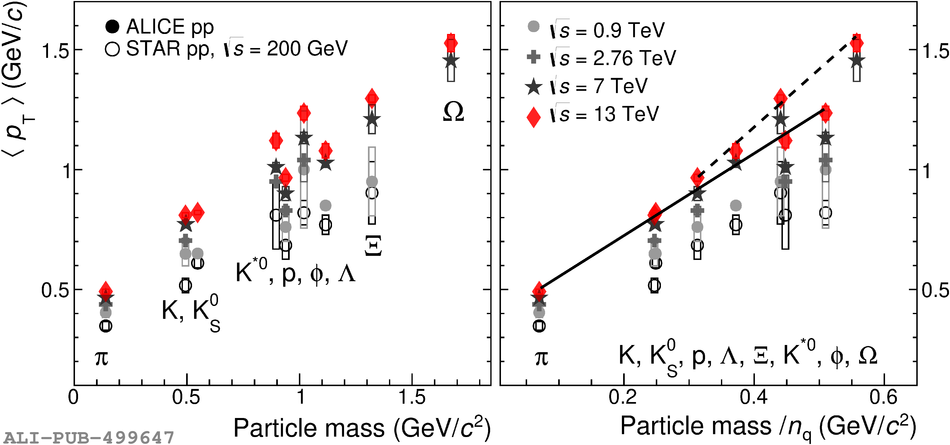 |
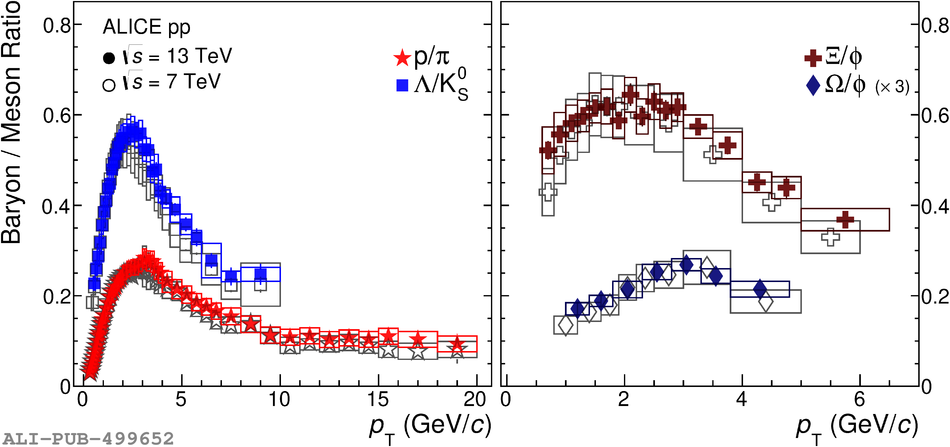
Figure 14
Ratios of \pt spectra from model calculations to the \pt spectra measured by ALICE in \pp collisions at \rs[13] and 7 TeV. The total fractional uncertainties of the ALICE data are shown as shaded boxes. The measured \pt spectra of \ks and \ph in \pp collisions at \rs[7 TeV] are from Ref. | 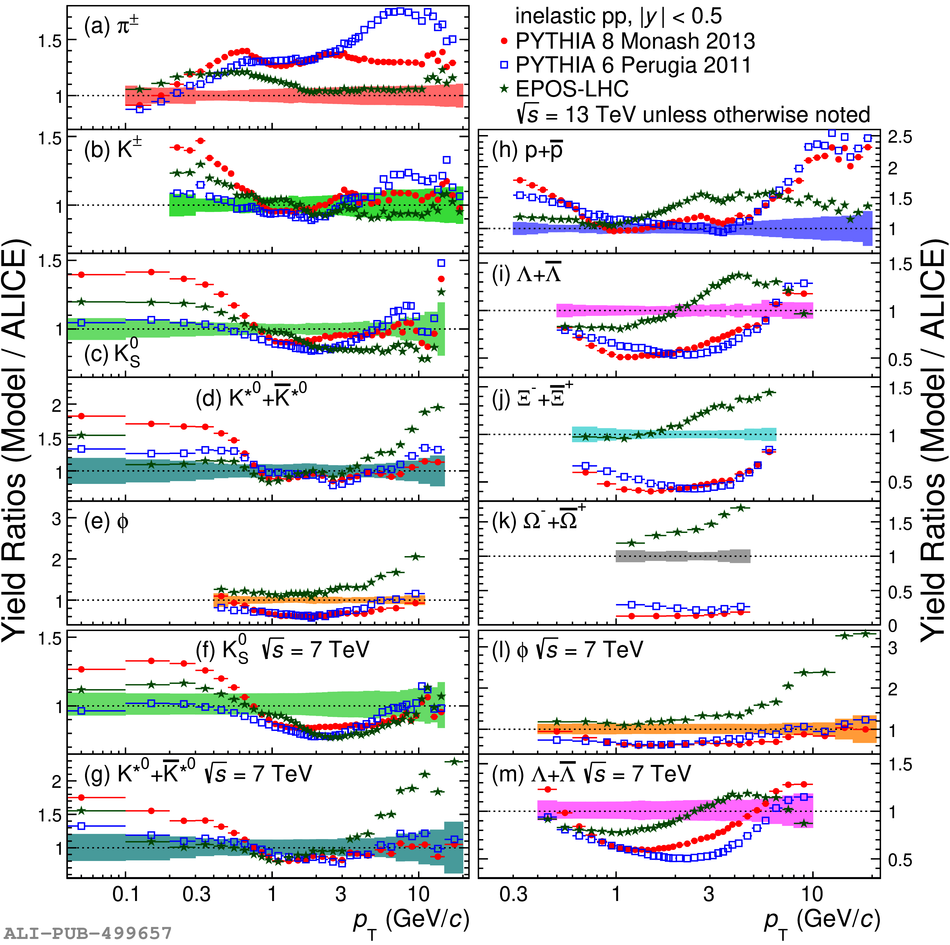 |
Figure 15
The measured 13-to-7 TeV ratios of hadron \pt spectra are compared with model calculations: where $Y$ is the particle yield, the plotted double ratio is $(Y^{13\;\mathrm{TeV}}_{\mathrm{model}}/Y^{7\;\mathrm{TeV}}_{\mathrm{model}})/(Y^{13\;\mathrm{TeV}}_{\mathrm{measured}}/Y^{7\;\mathrm{TeV}}_{\mathrm{measured}})$. The measured \pt spectra at \sppt{7} are from Refs. . The total fractional uncertainties of the measured yield ratios are shown as shaded boxes | 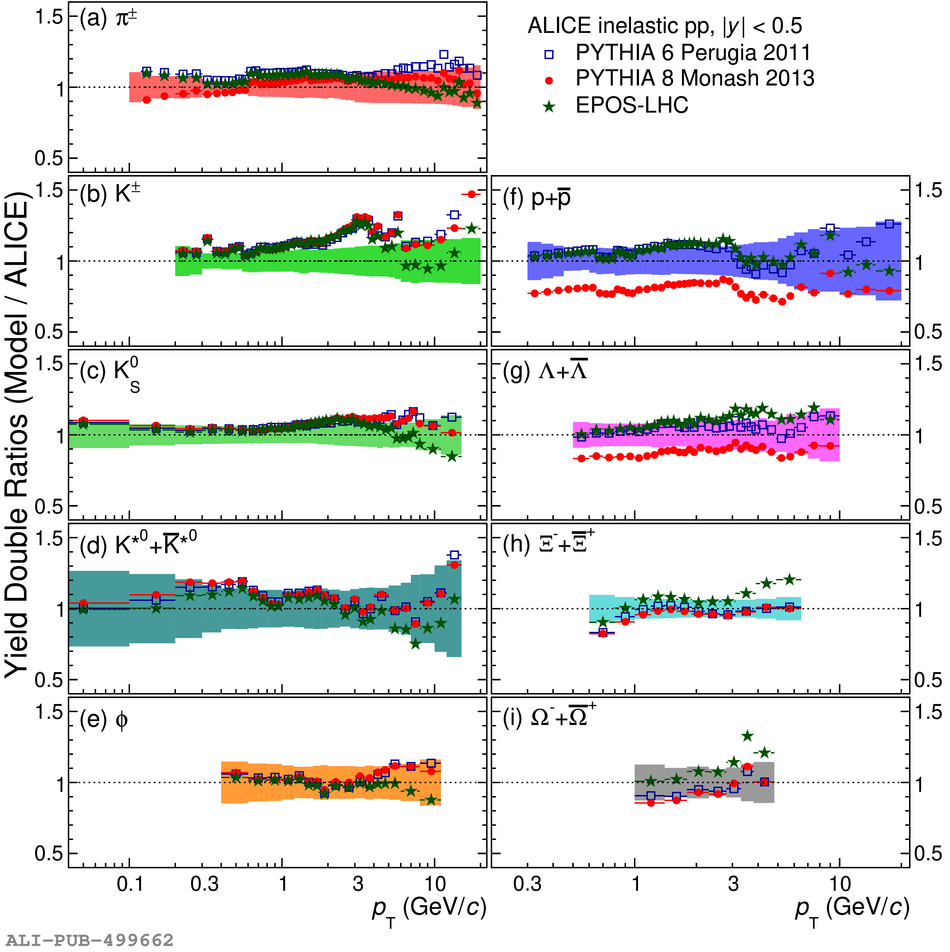 |
Figure 16
Baryon-to-meson particle ratios as a function of transverse momentum measured in \pp collisions at \sppt{13}. The data are compared with several general-purpose Monte Carlo models. Statistical and systematic uncertainties are summed in quadrature, and are shown as vertical error bars | 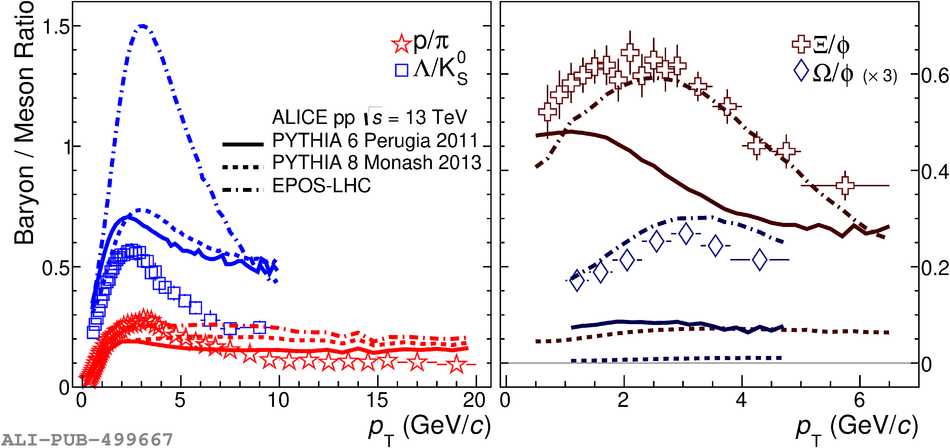 |
Figure 17
(Left) Invariant differential cross sections for \pix, \kx, and \px production, compared with NLO pQCD calculations using CT10NLO PDFs with DSS14 FFs for \pix and DSS FFs for \kx and \px. The shaded bands around the NLO calculations correspond to the scale uncertainty. (Right) Ratio of measured data (points) or NLO calculations (lines) to a L\'evy--Tsallis function that is fitted to the data. The NLO-to-fit ratio is shown for the scale $\mu=\pt$ and the variations $\mu=\pt/2$ and $\mu=2\,\pt$. The fully correlated normalization uncertainty is indicated in the legend | 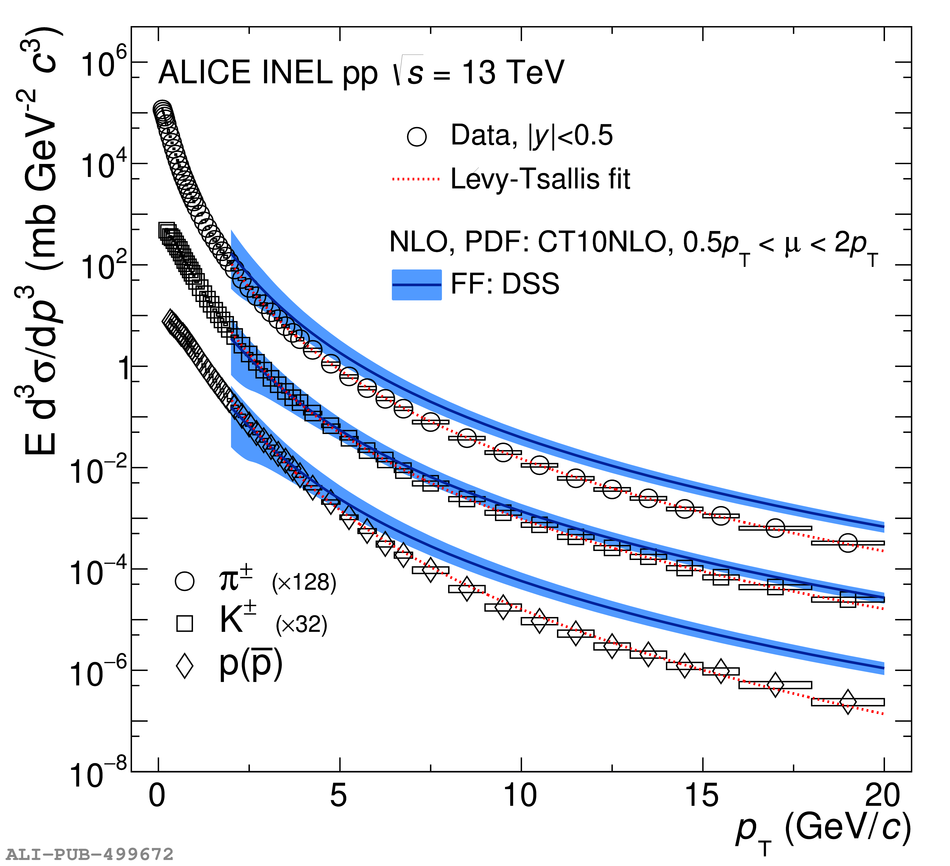 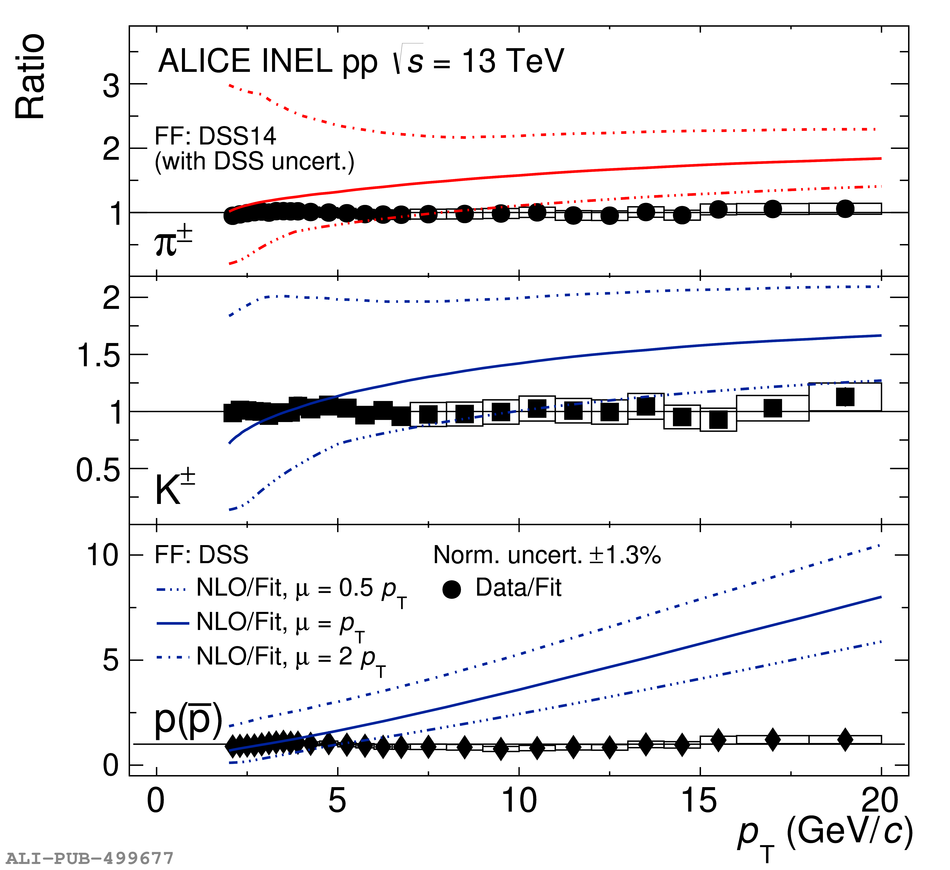 |
Figure 18
Ratios of transverse-momentum spectra of \pix, \kx, and \px in minimum bias inelastic \pp collisions at \sppt{13} to those at \sppt{7} . Solid lines show predictions from a next-to-leading order (NLO) pQCD calculation using DSS fragmentation functions . Statistical and systematic uncertainties are shown as vertical error bars and boxes, respectively | 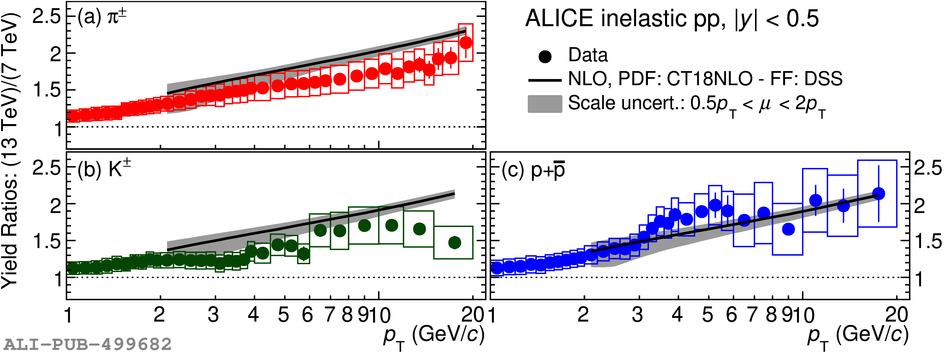 |