Average transverse momenta of light-flavor hadrons as a function of hadron mass (left) and as a function of hadron mass normalized to the number of constituent quarks (right) for different collision energies (\cme). Results reported from ALICE are compared with those measured by STAR at RHIC at \sppg{200} . Uncertainties that are not visible are smaller than the size of the symbol. Solid and dashed lines are drawn as visual aids and represent separate linear fits to meson and baryon data at \sppt{13}. The data points for \kzs are slightly shifted horizontally for clarity. Red data points are for \sppt{13} | 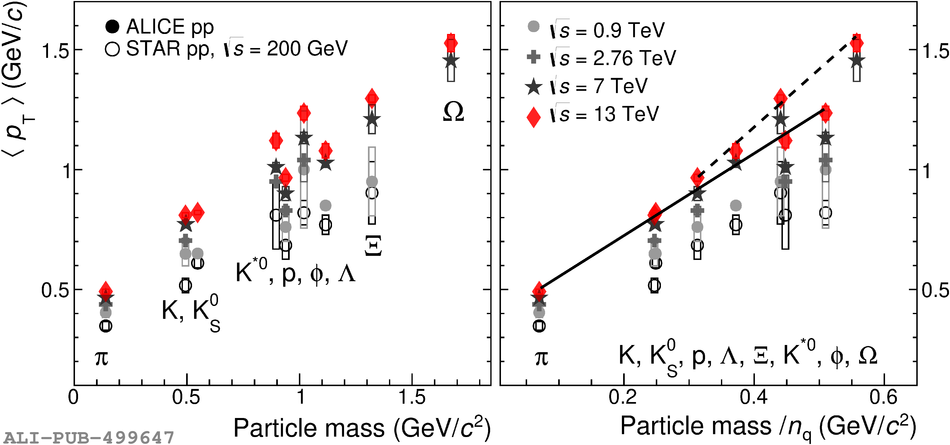 |