Average transverse momentum \mpt as a function of the center-of-mass energy. Open boxes indicate the statistical and systematic uncertainties (when available) summed in quadrature. Results from ALICE are compared with those from STAR measured at \sppg{200} . Some data points are slightly offset from their true energy for better visibility. Dashed curves show linear fits in $\ln{s}$. Note that the data points of \kzs are not fitted due to their very similar values of \mpt to those of charged kaons. Red data points are for \sppt{13} | 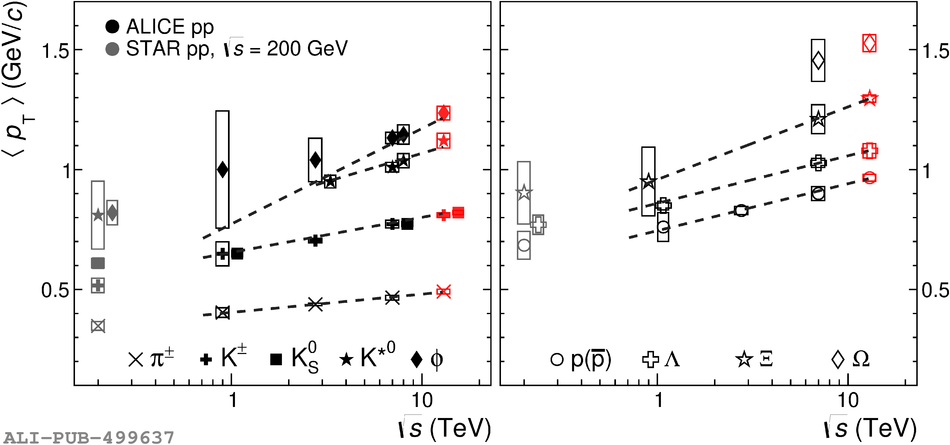 |