We present the first wide-range measurement of the charged-particle pseudorapidity density distribution, for different centralities (the 0-5%, 5-10%, 10-20%, and 20-30% most central events) in Pb-Pb collisions at $\sqrt{s_{\rm NN}} = 2.76$ TeV at the LHC. The measurement is performed using the full coverage of the ALICE detectors, $-5.0 < \eta < 5.5$, and employing a special analysis technique based on collisions arising from LHC "satellite" bunches. We present the pseudorapidity density as a function of the number of participating nucleons as well as an extrapolation to the total number of produced charged particles $N_{\rm ch} = 17165 \pm 772$ for the 0-5% most central collisions). From the measured ${\rm d}N_{\rm ch}/{\rm d}\eta$ distribution we derive the rapidity density distribution, ${\rm d}N_{\rm ch}/{\rm d}y$, under simple assumptions. The rapidity density distribution is found to be significantly wider than the predictions of the Landau model. We assess the validity of longitudinal scaling by comparing to lower energy results from RHIC. Finally the mechanisms of the underlying particle production are discussed based on a comparison with various theoretical models.
Phys. Lett. B 726 (2013) 610-622
HEP Data
e-Print: arXiv:1304.0347 | PDF | inSPIRE
CERN-PH-EP-2013-045
Figure 1
Schematic drawing (not to scale) of the cross-section of the sub-detectors used in this analysis and the midpoints of the locations of the nominal and `satellite' interaction points. The long-dashed line designates a region of dense material designed to absorb all particles except muons. The short-dashed line indicates the region of the ALICE inner tracking system, which has dense material for its services on the surfaces near FMD2 and FMD3. The area between FMD2, FMD1 and VZERO-A contains only the beryllium beam pipe. The dark gray shaded areas denote the paths particles would follow from $z = 0$cm and $z = 225$cm to FMD2 and VZERO-A such that it is evident which material they would traverse. | 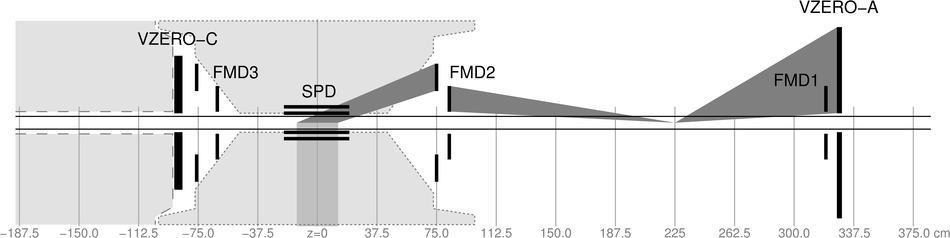 |
Figure 3
Combined $\dNchdeta$ result per centrality bin. The error bars (gray boxes) show the total statistical and systematic error of the combined result. The open squares indicate the previously published ALICE result near mid-rapidity. Published results from other LHC experiments are also shown. | 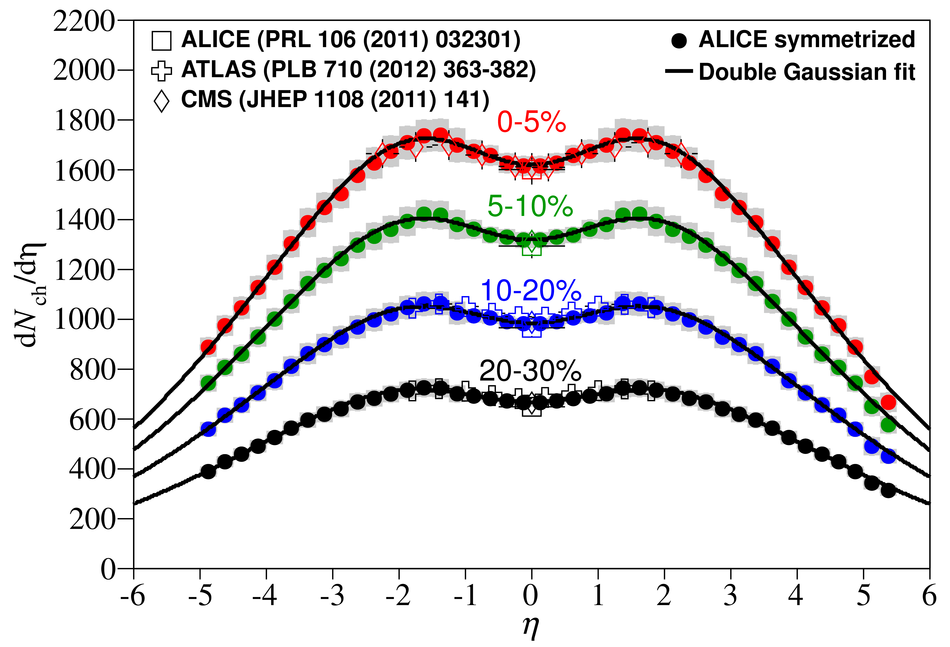 |
Figure 4
Extrapolation to the total number of produced charged particles as a function of the number of participating nucleons. The light-gray band represents the uncorrelated errors from the extrapolation fit while the dark-gray band shows the increase to the total systematic errors which includes the common error coming from the uncertainty in the centrality estimation. The lower energy data from PHOBOS was scaled by the average number of charged particles per participant with $\Npart>180$ found in the ALICE measurements divided by the same quantity found in the PHOBOS measurements. |  |
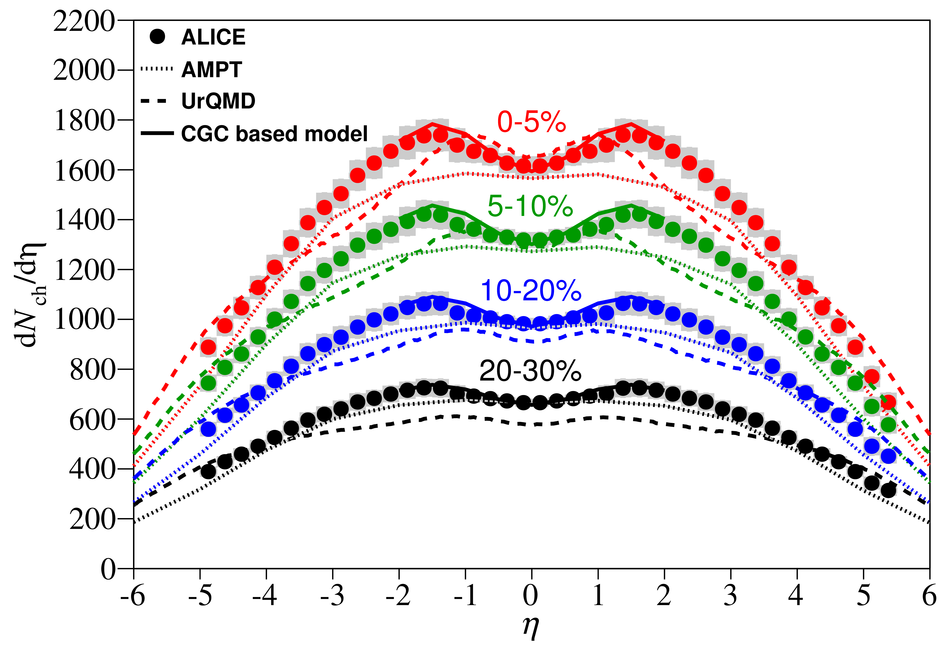
Figure 7
The charged-particle pseudorapidity density distribution per participating nucleon pair for three centrality bins shown in the rest frame of one of the projectiles by using the variable $\eta' = \eta - y_{\mathrm{beam}}$ ($y_{\mathrm{beam}} = 7.99$). The ALICE results are extrapolated to further values of $\eta'$ by fitting to the difference of two Gaussian functions (described in the text) and fitting a straight line to the last few points on the curve. These results are compared to lower energy data. |  |
Figure 8
Total $\Nch$ per participant pair versus $\ln^{2} s_{\rm NN}$. Also shown (dotted line) is the fit to the AGS{}, SPS and RHIC data fromusing the trapezoidal approximation for $\dNchdeta$ and assuming that the mid-rapidity $\dNchdeta$ scales as $\ln s_{\rm NN}$. The dashed line is a fit to the RHIC and ALICE data derived using the trapezoidal approximation, but assuming the mid-rapidity $\dNchdeta$ scales as $s_{\rm NN}^{0.15}$. The full drawn line is a fit to the RHIC and ALICE data derived assuming that $\dNchdeta$ is dominated by a flat mid-rapidity region with a width that grows as $\ln s_{\rm NN}$. | 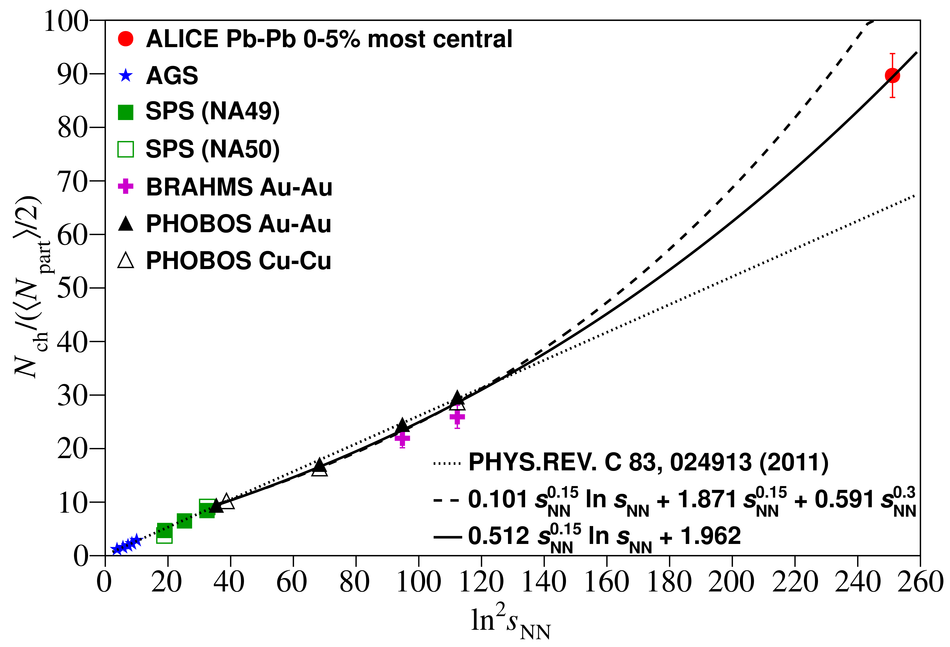 |
Figure 9
$\dNchdy$ distribution for the 5% most central Pb-Pb collisions. A Gaussian distribution has been fit to the data ($\sigma = 3.86$). A Landau-Carruthers Gaussian and a Landau-Wong function are also shown. The full drawn line shows a fit to the sum of two Gaussian distributions of equal widths with the means at $\eta = \pm 2.17$ and $\sigma = 2.6$ as its area reproduces the estimated total number of charged particles.
The inset shows the energy dependence of the ratio of $\sigma$ from a Gaussian fit to the expected Landau-Carruthers $\sigma$ extended to $\snn=2.76$ TeV along with including RHIC points derived from the $\dNchdeta$ distributions measured by BRAHMS and PHOBOS converted to $\dNchdy$ (the higher point and the lower point, respectively) using the same method employed at $\snn=2.76$ TeV. | 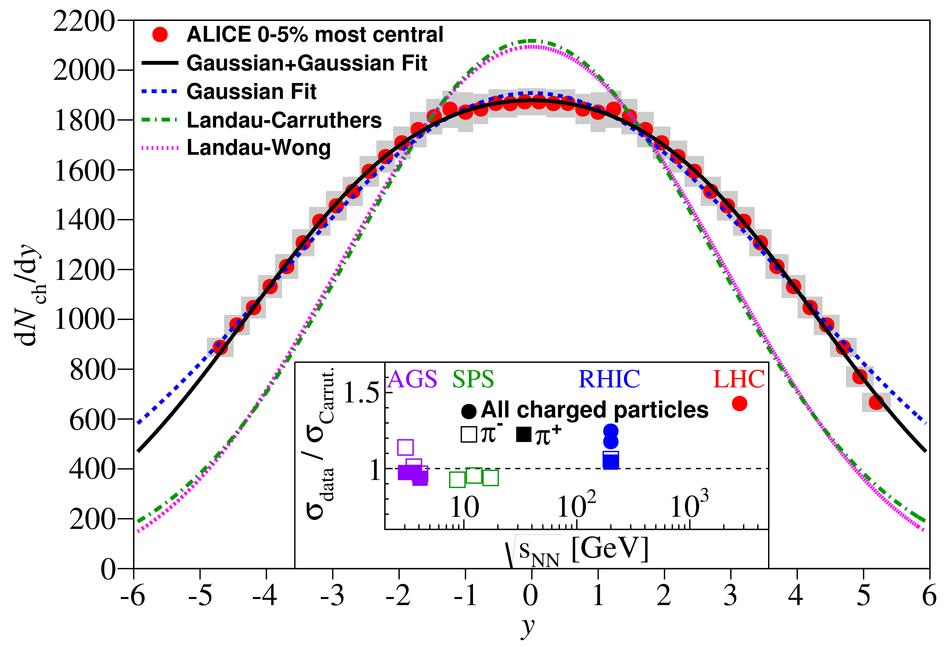 |