Total $\Nch$ per participant pair versus $\ln^{2} s_{\rm NN}$. Also shown (dotted line) is the fit to the AGS{}, SPS and RHIC data fromusing the trapezoidal approximation for $\dNchdeta$ and assuming that the mid-rapidity $\dNchdeta$ scales as $\ln s_{\rm NN}$. The dashed line is a fit to the RHIC and ALICE data derived using the trapezoidal approximation, but assuming the mid-rapidity $\dNchdeta$ scales as $s_{\rm NN}^{0.15}$. The full drawn line is a fit to the RHIC and ALICE data derived assuming that $\dNchdeta$ is dominated by a flat mid-rapidity region with a width that grows as $\ln s_{\rm NN}$. | 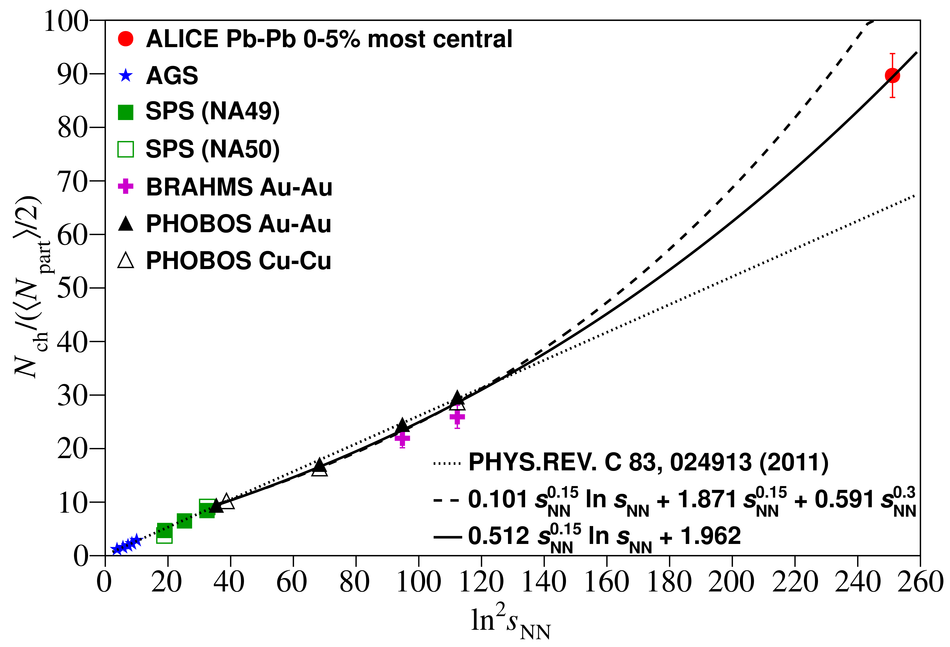 |