Correlations induced by quantum statistics are sensitive to the spatio-temporal extent as well as dynamics of particle emitting sources in heavy-ion collisions. In addition, such correlations can be used to search for the presence of a coherent component of pion production. Two and three-pion correlations of same and mixed-charge are measured at low relative momentum to estimate the coherent fraction of charged pions in Pb-Pb collisions at $\sqrt{s_{\rm NN}}=2.76$ TeV at the LHC with ALICE. The genuine three-pion quantum statistics correlation is found to be suppressed relative to the two-pion correlation based on the assumption of fully chaotic pion emission. The suppression is observed to decrease with triplet momentum. The observed suppression at low triplet momentum may correspond to a coherent fraction in charged pion emission of 23% $\pm$ 8%.
Phys. Rev. C 89 (2014) 024911
HEP Data
e-Print: arXiv:1310.7808 | PDF | inSPIRE
CERN-PH-EP-2013-201
Figure 1
Comparison of same and mixed-charge three-pion FSI correlations. $\Omega_0$ wave-function and generalized Riverside (GRS) method are shown. The calculation was performed in Therminator (0-5%). The bottom panel shows the difference between the two methods, $\Delta K_{3}=K_{3}(\Omega_{0})-K_{3}(\rm GRS)$, divided by $K_{3}(\Omega_{0})-1$. | 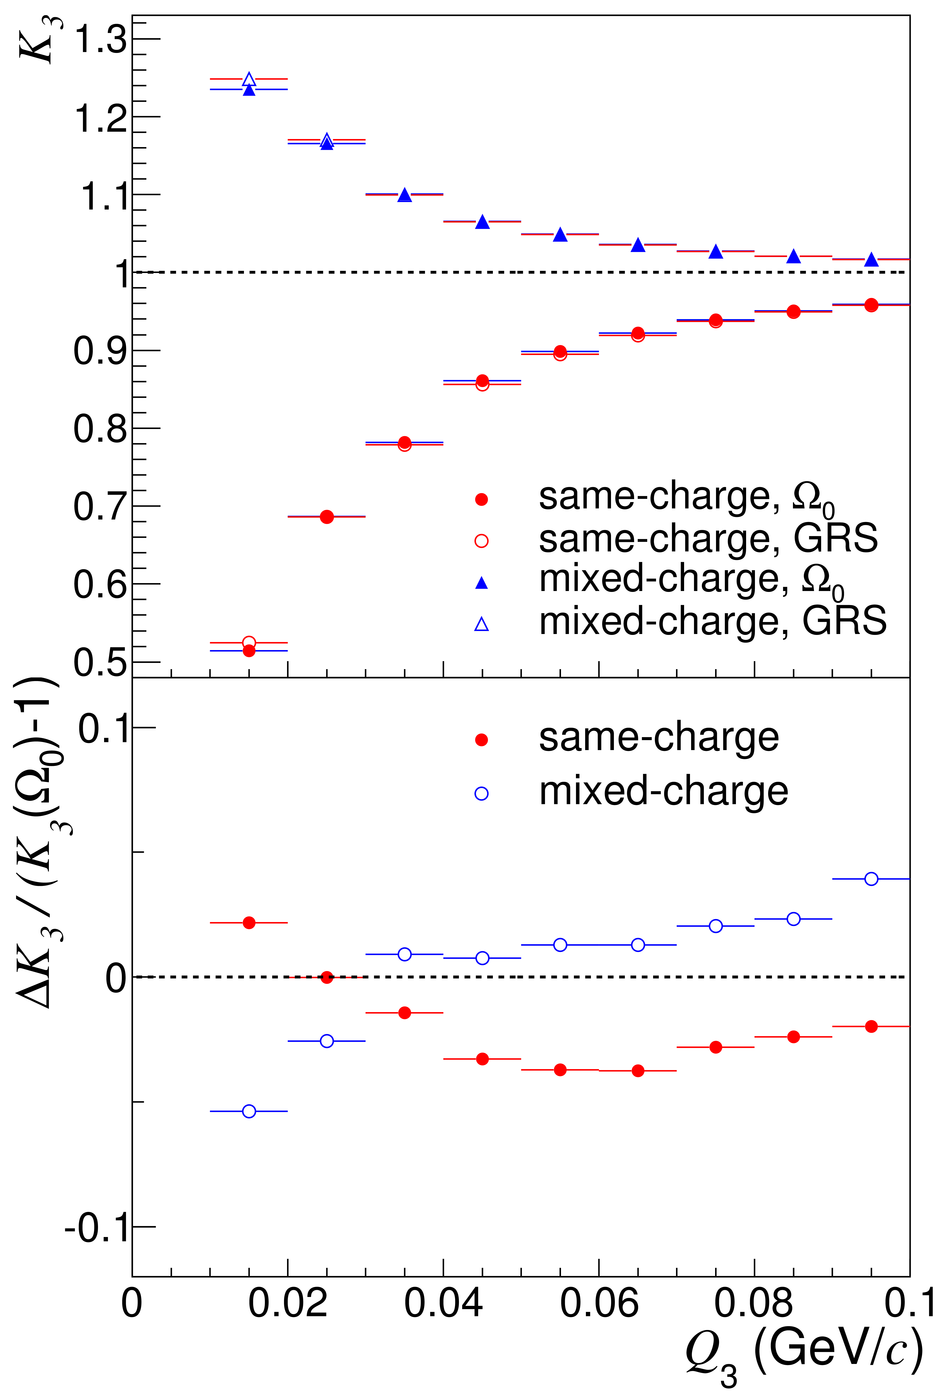 |
Figure 2
$C_2$ for same-charge (solid red circles) and mixed-charge pions (open blue squares) for 0-5% centrality (a) and 45-50% centrality (b). The global fits with dotted lines correspond to Gaussian same-charge fits ($E_{\rm w}=1$). The global fits with solid lines correspond to non-Gaussian fits with Edgeworth coefficients ($E_{\rm w}\neq1$). Shaded boxes represent the momentum resolution correction uncertainty. FSI uncertainties are smaller than the symbol sizes. | 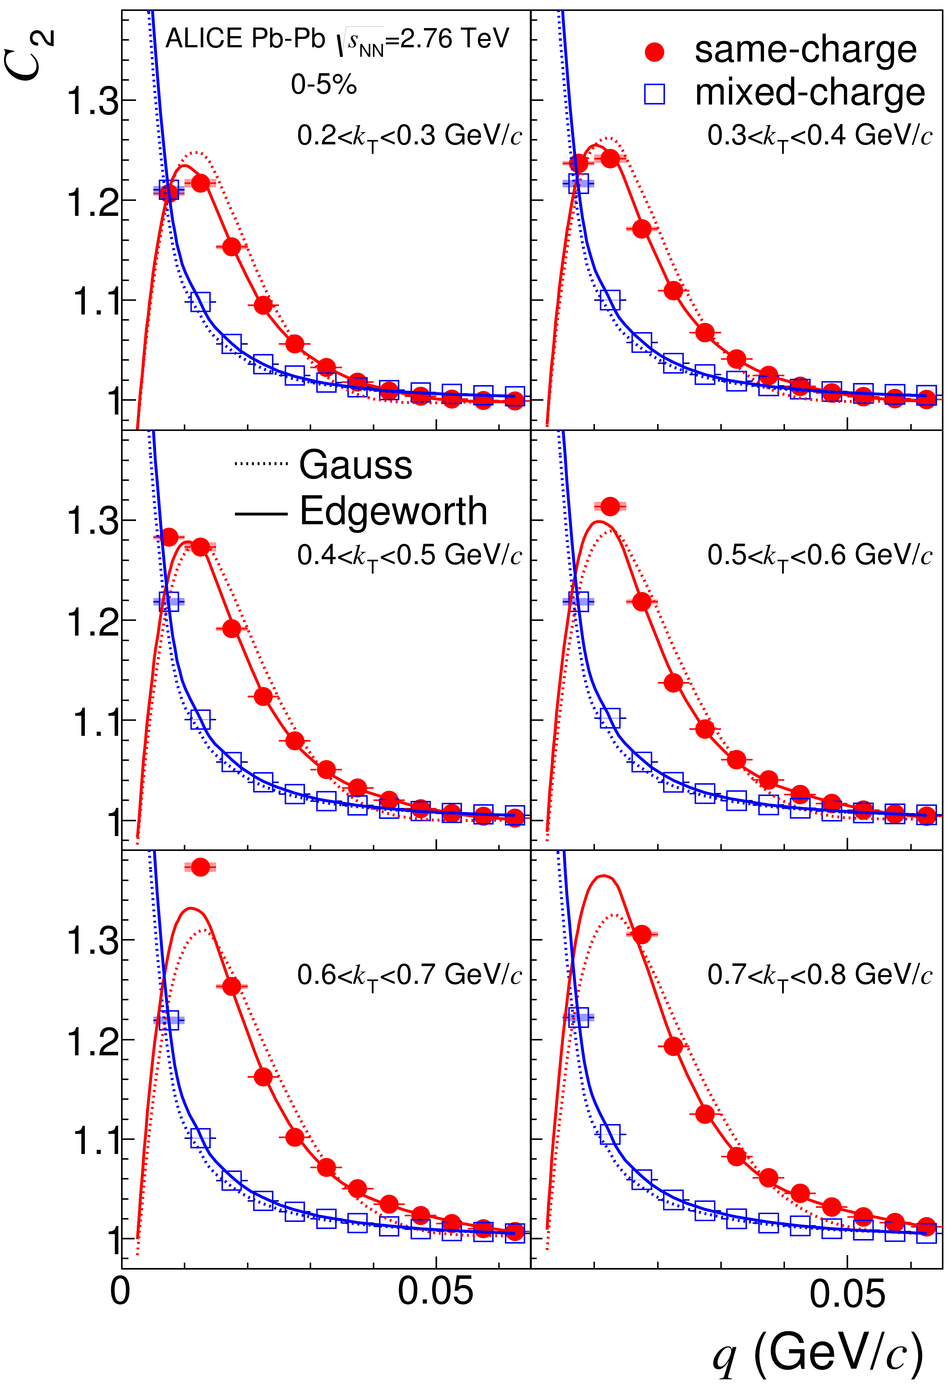 |

Figure 4
Ratio $C_2^{+-}(\kt_6) / C_2^{+-}(\kt_1)$, comparing mixed-charge correlations between the highest (sixth) and lowest (first) $\kt$ bins. Open circles represent the Therminator comparison using all pion pairs (diluted). Open squares represent the Therminator calculation only using pion pairs with $r^*< 80$ fm (undiluted). Error bars include statistical and systematic uncertainties. |  |
Figure 5
Same-charge $C_3$ (solid red circles) for each centrality bin for $0.16< K_{\rm T,3}< 0.3$ GeV/$c$ (a) and $0.3< K_{\rm T,3}< 1.0$ GeV/$c$ (b). Open points represent the corresponding cumulant correlation functions, ${\rm {\bf c}_3}$. Shaded bands represent systematic uncertainties. | 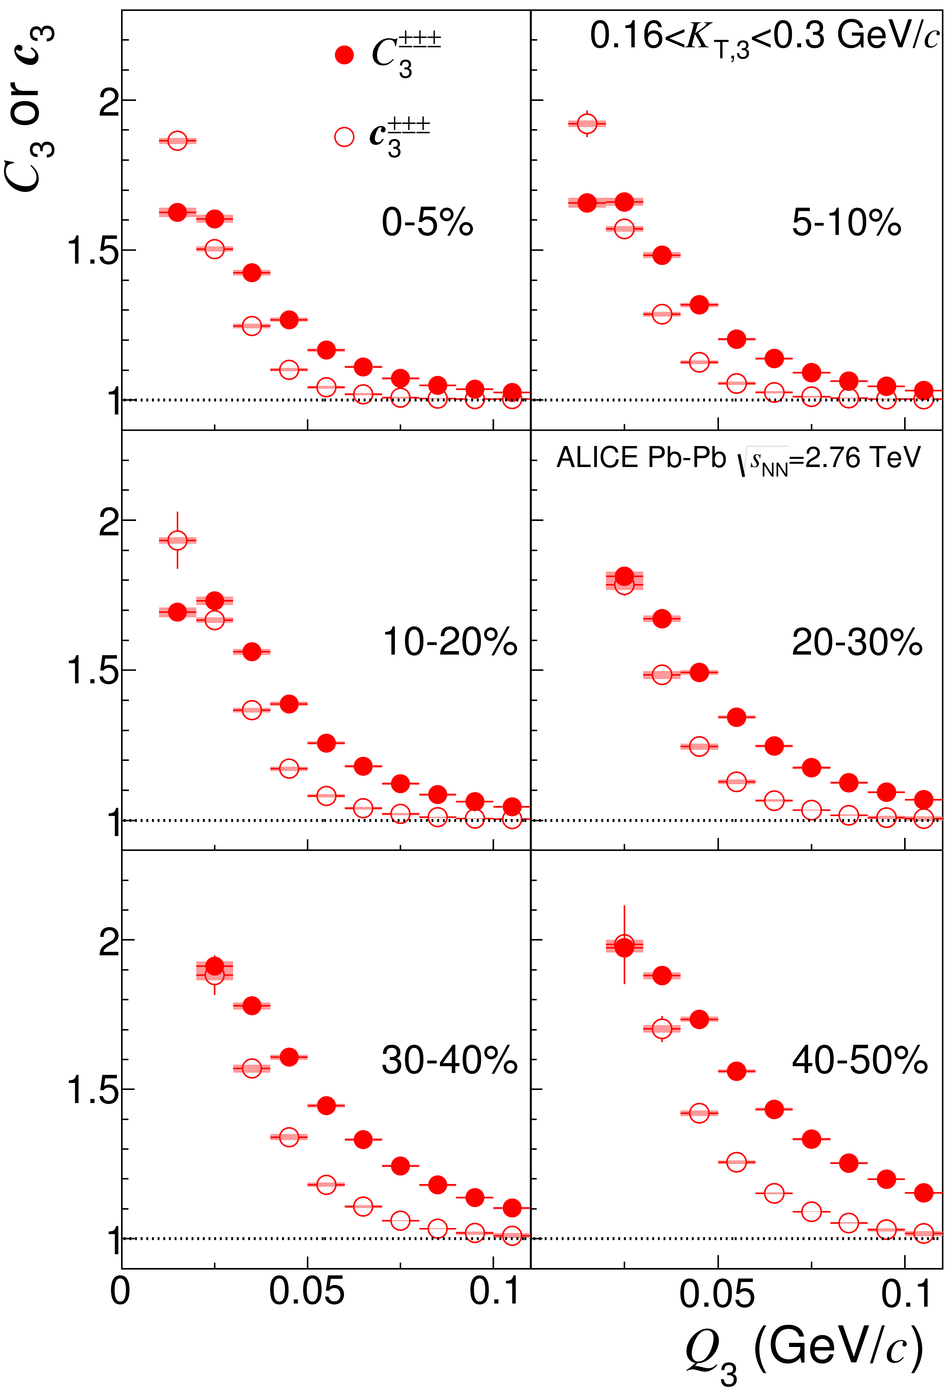 |
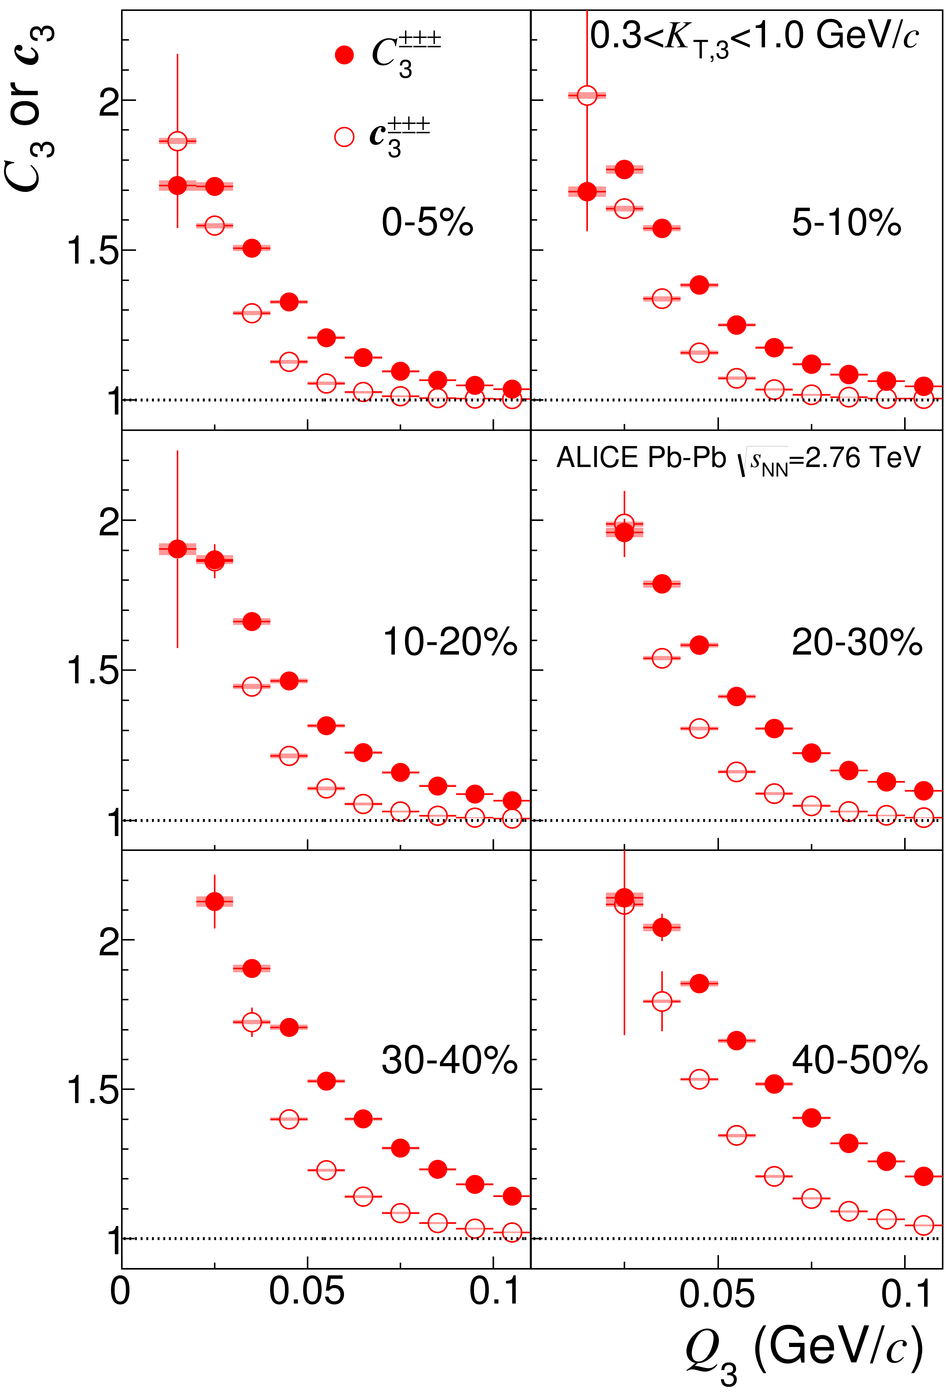
Figure 6
Mixed-charge $C_3$ (solid blue squares) for each centrality bin for $0.16< K_{\rm T,3}< 0.3$ GeV/$c$ (a) and $0.3< K_{\rm T,3}< 1.0$ GeV/$c$ (b). Open squares represent the corresponding cumulant correlation functions, ${\rm {\bf c}_3}$. Shaded bands represent systematic uncertainties. | 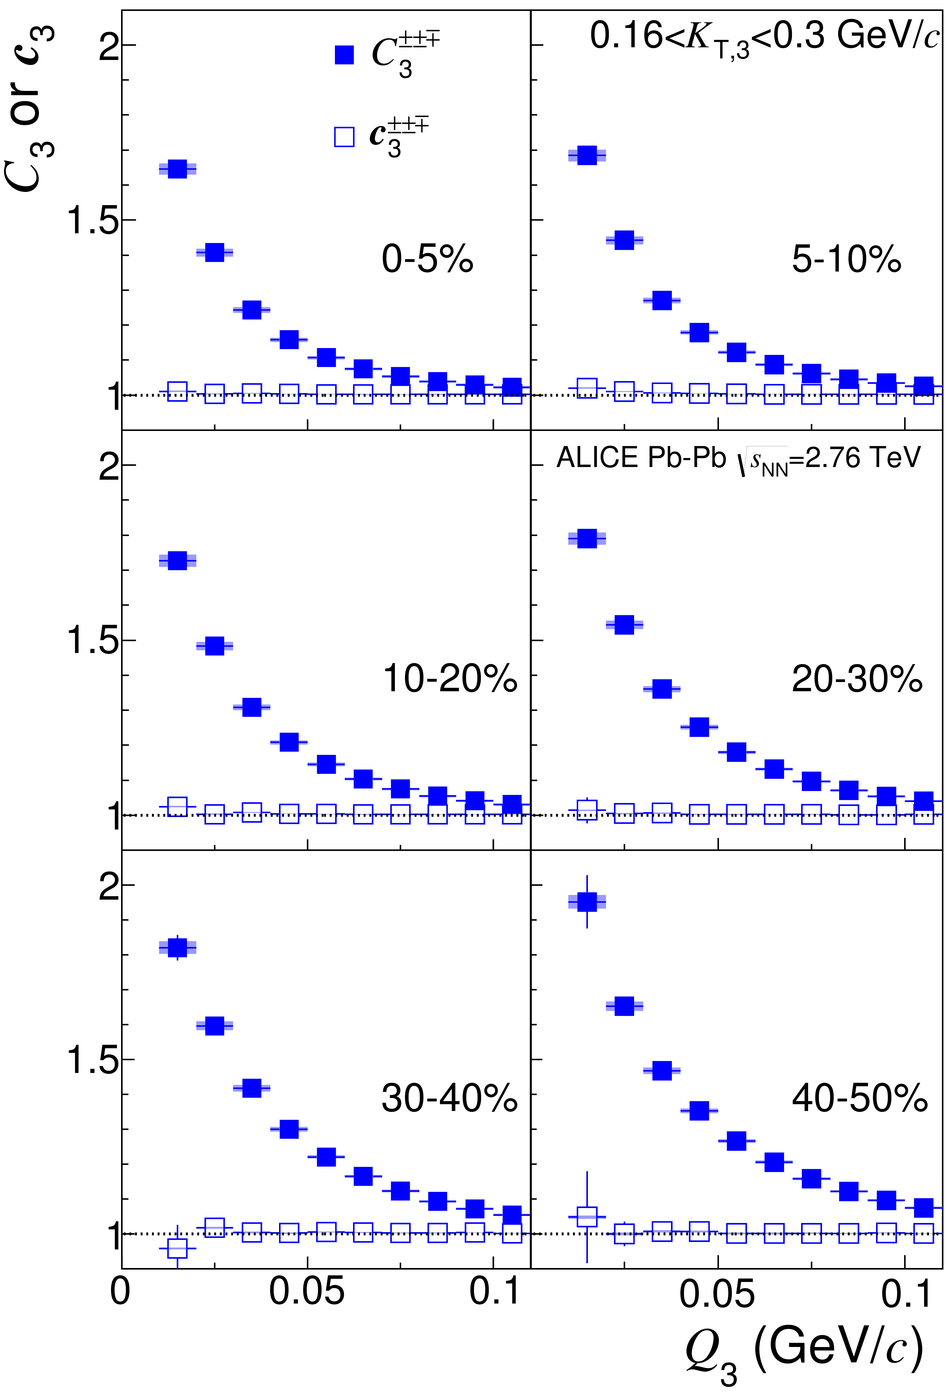 |
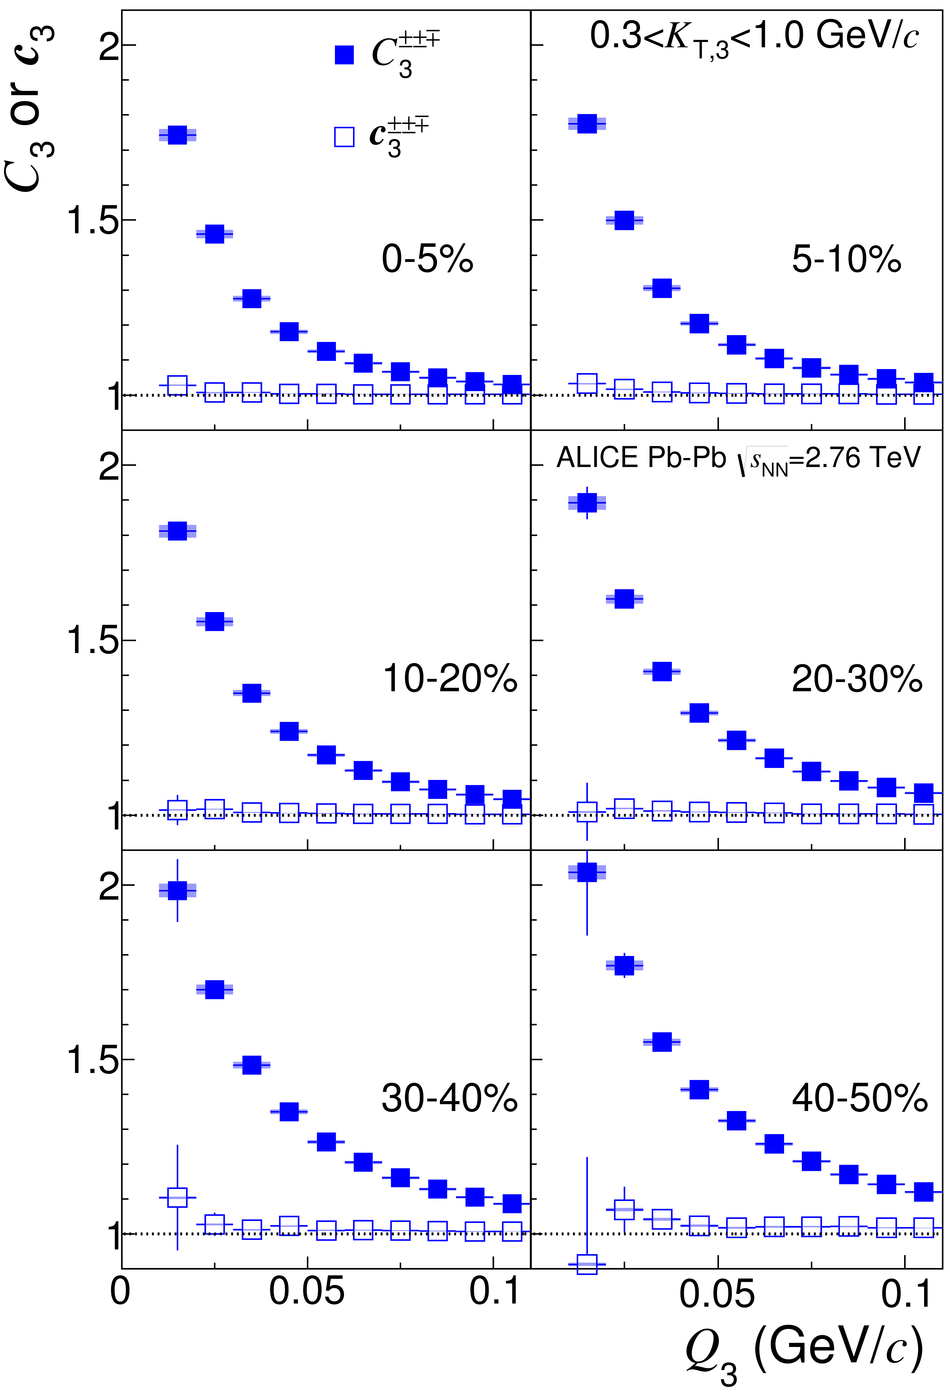
Figure 7
$r_3$ versus $Q_3$ in six centrality bins for $0.16< K_{\rm T,3}< 0.3$ GeV/$c$ (a) and $0.3< K_{\rm T,3}< 1.0$ GeV/$c$ (b). $r_3$ was measured in 5% centrality widths and averaged over the total bin width. The blue solid line is a quartic fit [Eq.(11)] and the dashed black line is a quadratic fit [Eq.(12)]. The chaotic upper limit [$r_3(Q_3)=2$] is shown with the dashed red line. The shaded gray band represents the systematics owing to PID and momentum resolution. The shaded red band represents the uncertainties owing to the choice of $\lambda$ and the residue of the mixed-charge cumulant correlations. The dashed line represents uncertainties on the FSI corrections. |  |
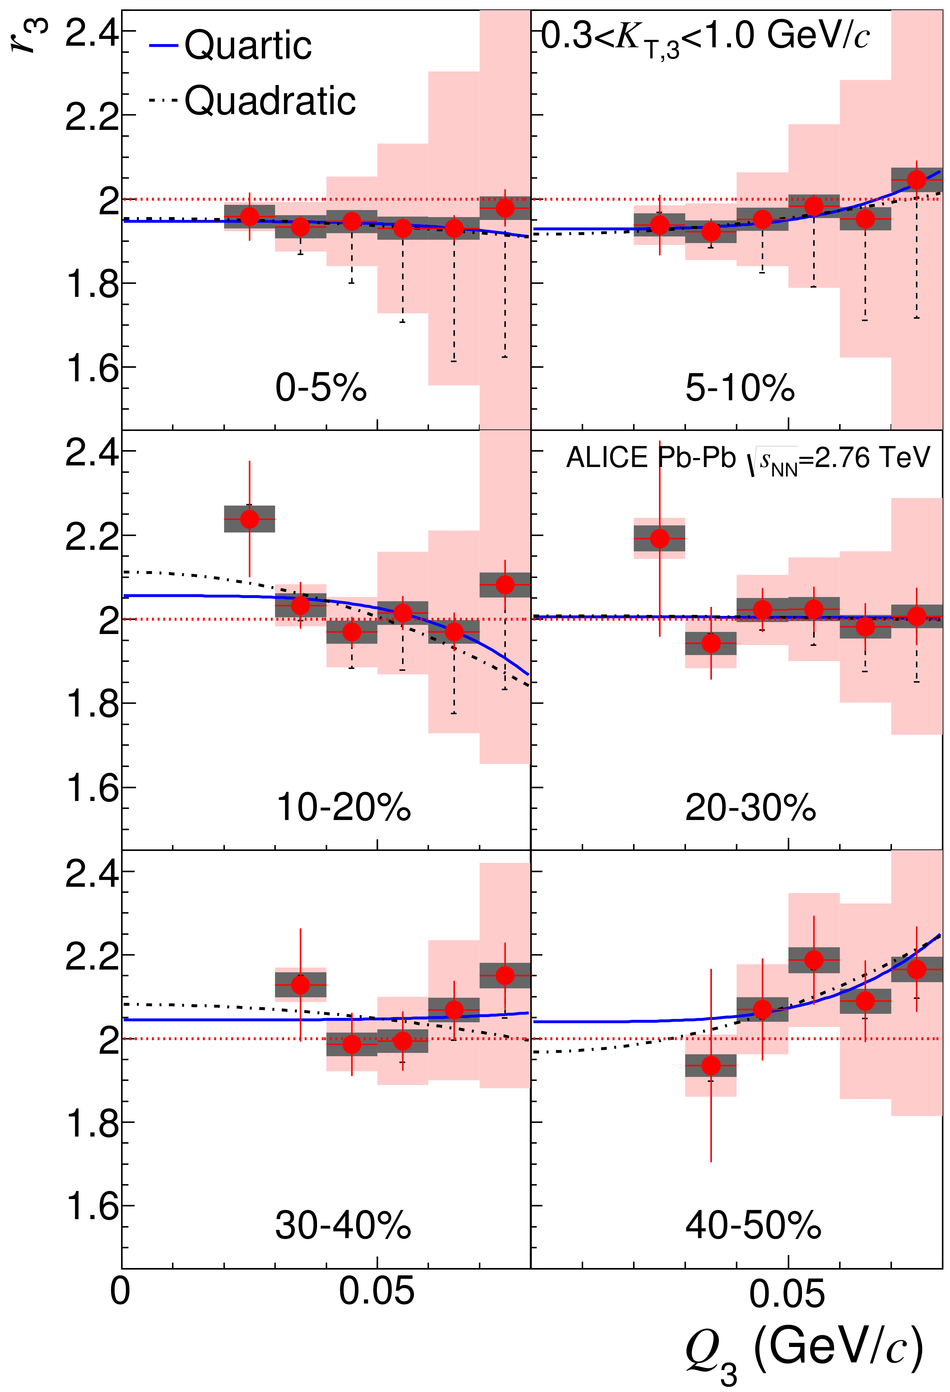
Figure 8
In the top panel, $r_3$ versus $Q_3$ is shown with GRS and $\Omega_0$ FSI corrections. In the bottom panel, ${\rm {\bf c}_3}^{\pm\pm\mp}$ versus $Q_3$ is shown with both FSI corrections. The centrality and $K_{\rm T,3}$ interval is $5-10\%$ centrality and $0.16< K_{\rm T,3}< 0.3$ GeV/$c$, respectively. Only statistical errors are shown for clarity. | 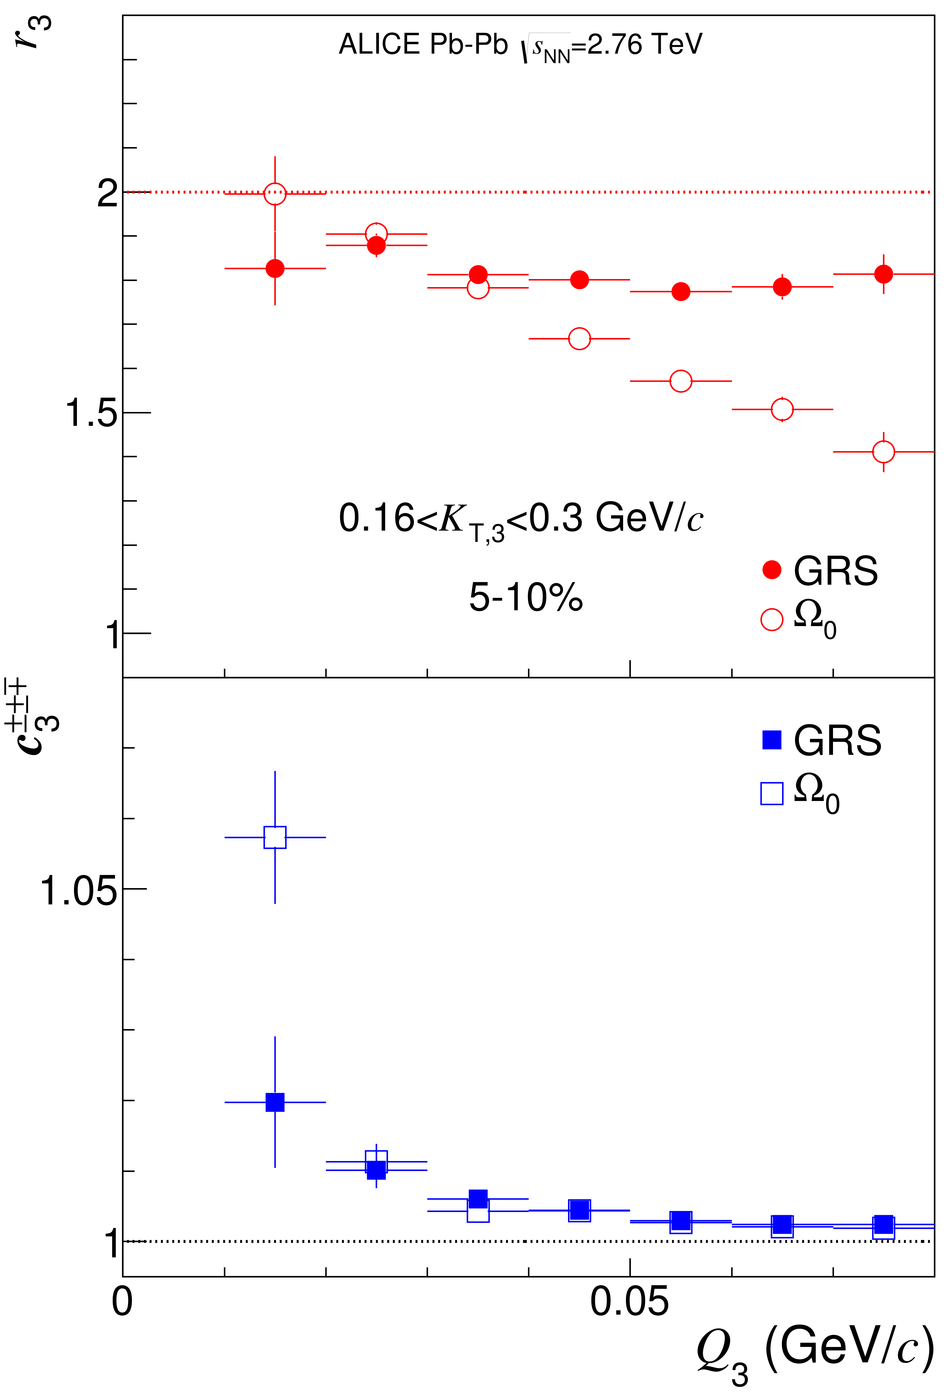 |
