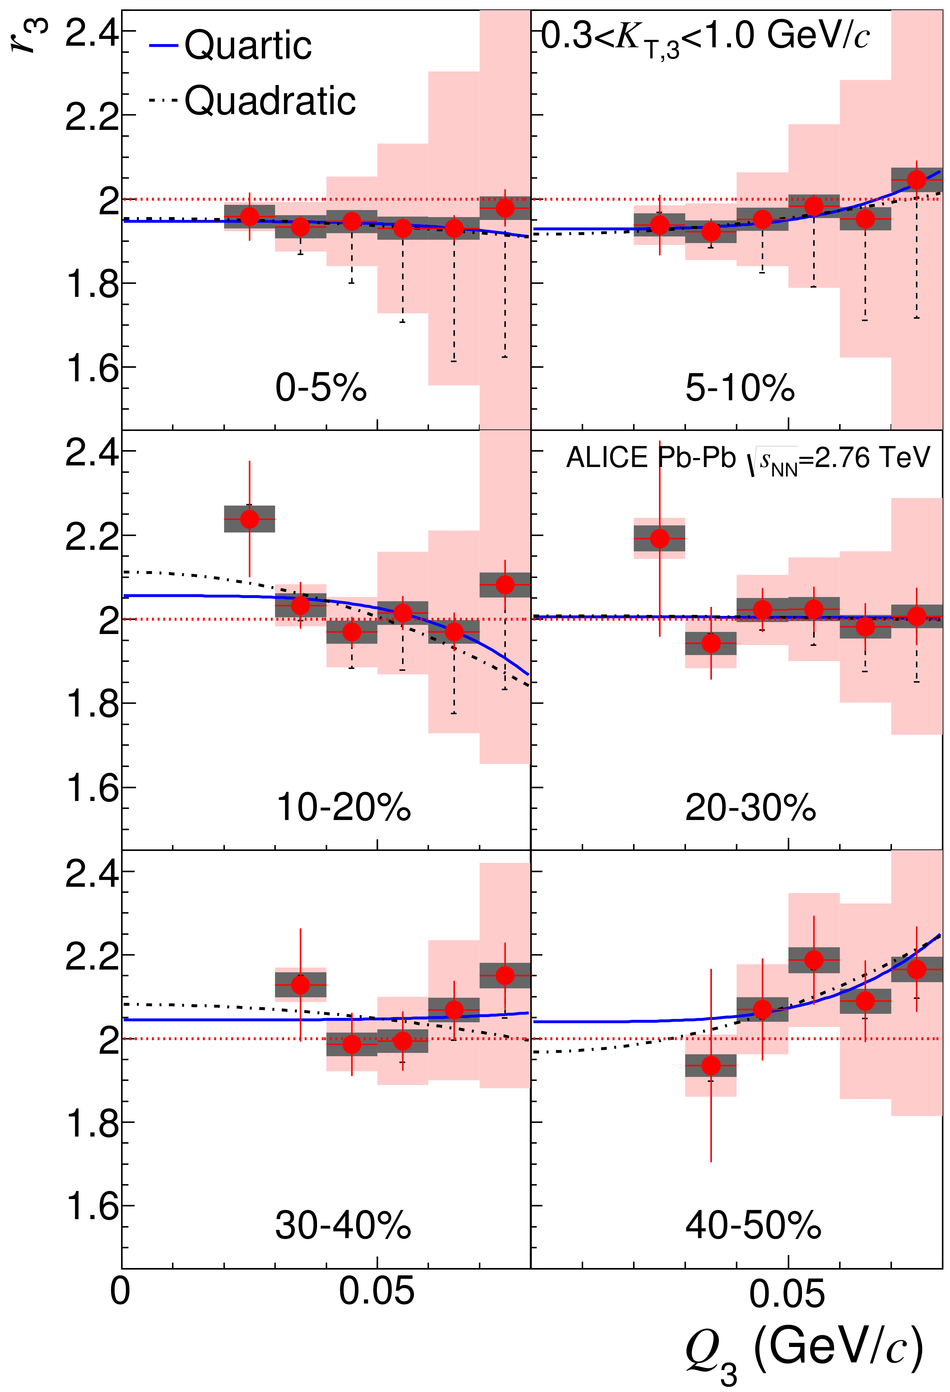
$r_3$ versus $Q_3$ in six centrality bins for $0.16< K_{\rm T,3}< 0.3$ GeV/$c$ (a) and $0.3< K_{\rm T,3}< 1.0$ GeV/$c$ (b). $r_3$ was measured in 5% centrality widths and averaged over the total bin width. The blue solid line is a quartic fit [Eq.(11)] and the dashed black line is a quadratic fit [Eq.(12)]. The chaotic upper limit [$r_3(Q_3)=2$] is shown with the dashed red line. The shaded gray band represents the systematics owing to PID and momentum resolution. The shaded red band represents the uncertainties owing to the choice of $\lambda$ and the residue of the mixed-charge cumulant correlations. The dashed line represents uncertainties on the FSI corrections. |  |