In the top panel, $r_3$ versus $Q_3$ is shown with GRS and $\Omega_0$ FSI corrections. In the bottom panel, ${\rm {\bf c}_3}^{\pm\pm\mp}$ versus $Q_3$ is shown with both FSI corrections. The centrality and $K_{\rm T,3}$ interval is $5-10\%$ centrality and $0.16< K_{\rm T,3}< 0.3$ GeV/$c$, respectively. Only statistical errors are shown for clarity. | 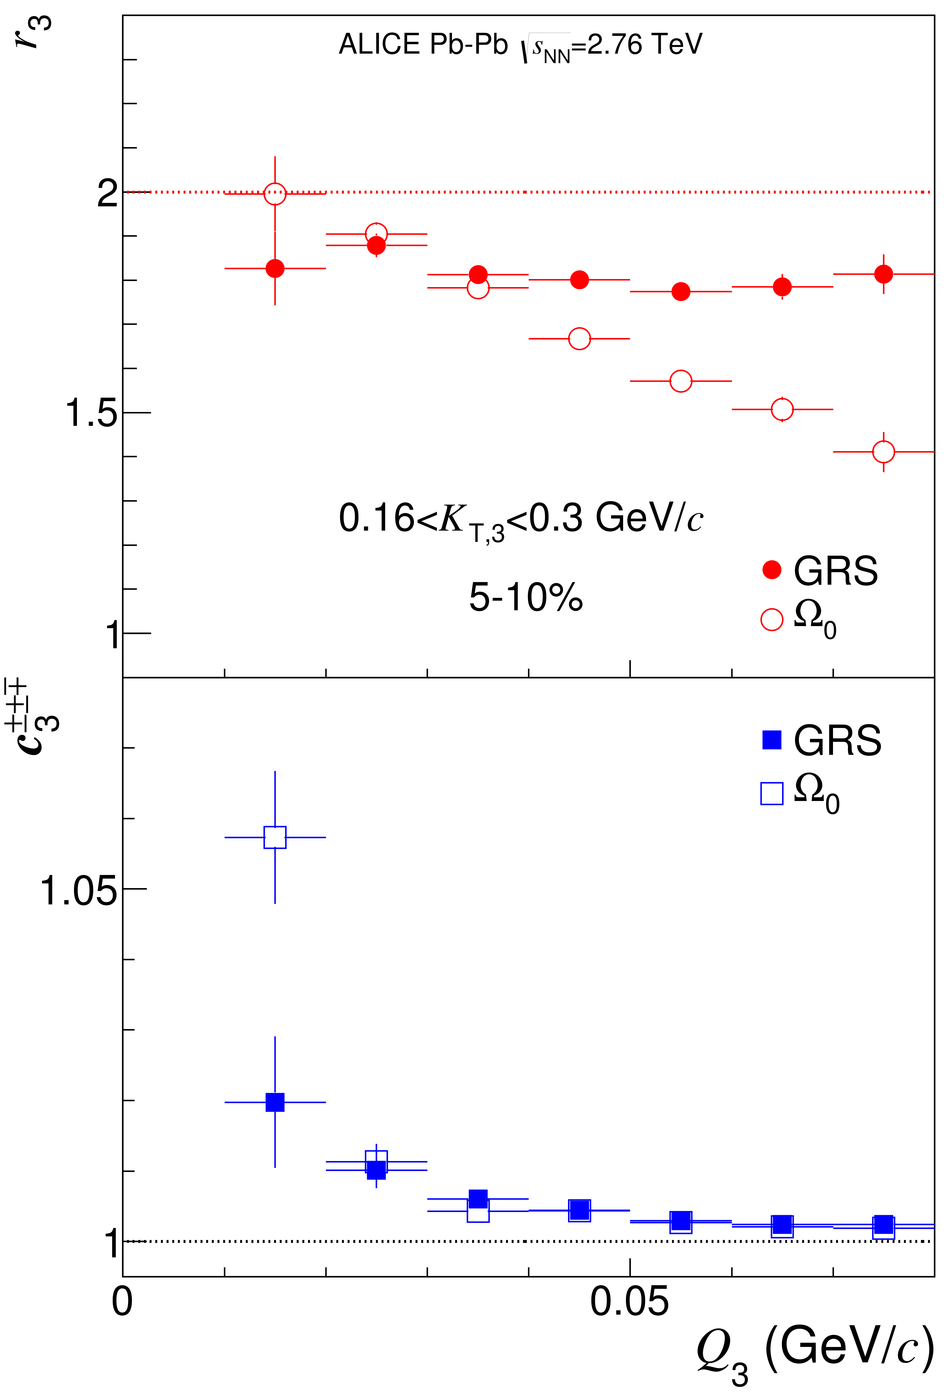 |