Details of the nuclear structure of $^{\rm 129}$Xe, such as the quadrupole deformation and the nuclear diffuseness, are studied by extensive measurements of anisotropic-flow-related observables in Xe--Xe collisions at a centre-of-mass energy per nucleon pair $\sqrt{s_{_{\mathrm{NN}}}}~=~5.44$ TeV with the ALICE detector at the LHC. The results are compared with those from Pb--Pb collisions at $\sqrt{s_{_{\mathrm{NN}}}}~=~5.02$ TeV for a baseline, given that the $^{\rm 208}$Pb nucleus exhibits a very weak deformation. Furthermore, comprehensive comparisons are performed with a state-of-the-art hybrid model using IP-Glasma+MUSIC+UrQMD. It is found that among various IP-Glasma+MUSIC+UrQMD calculations with different values of nuclear parameters, the one using a nuclear diffuseness parameter of $a_0=0.492$ and a nuclear quadrupole deformation parameter of $β_2=0.207$ provides a better description of the presented flow measurements. These studies represent the first systematic exploration of nuclear structure at TeV energies, utilizing a comprehensive set of anisotropic flow observables. The measurements serve as a critical experimental benchmark for rigorously testing the interplay between nuclear structure inputs and heavy-ion theoretical models.
Phys. Lett. B 869 (2025) 139855
HEP Data
e-Print: arXiv:2409.04343 | PDF | inSPIRE
CERN-EP-2024-228
Figure group
Figure 1
Panels (a) and (b): Charged particle $v_2\{2, |\Delta\eta|< 1.0\}$ (left) and $v_2\{4\}$ (right) as a function of centrality in Xe$-$Xe and Pb$-$Pb collisions at $\sqrt{s_{\rm NN}}= 5.44$ TeV and $\sqrt{s_{\rm NN}}= 5.02$ TeV, respectively. Panels (c) and (d): Ratio between Xe$-$Xe and Pb$-$Pb $v_2\{2, |\Delta\eta|< 1.0\}$ (left) and $v_2\{4\}$ (right). Statistical and systematical uncertainties are shown as vertical lines and grey boxes, respectively. The measurements are compared with IP-Glasma+MUSIC+UrQMD calculations to constrain the $\beta_2$ and $a_0$ parameters of $^{129}$Xe nuclei. The thickness of the bands represent statistical uncertainties. |  |
Figure 2
Panels (a) and (b): Charged particle $\langle v_2 \rangle$ (left) and $\sigma_{v_2}$ (right) as a function of centrality in Xe$-$Xe and Pb$-$Pb collisions at $\sqrt{s_{\rm NN}}=5.44$ TeV and $\sqrt{s_{\rm NN}}=5.02$ TeV, respectively. Panels (c) and (d): Ratio between Xe$-$Xe and Pb$-$Pb $\langle v_2 \rangle$ (left) and $\sigma_{v_2}$ (right). Statistical and systematical uncertainties are shown as vertical lines and grey boxes, respectively. The measurements are compared with IP-Glasma+MUSIC+UrQMD calculations to constrain the $\beta_2$ and $a_0$ parameters of $^{129}$Xe nuclei. The thickness of the bands represent statistical uncertainties. |  |
Figure 3
Panels (a) and (b): Charged particle $v_3\{2, |\Delta\eta|< 0.8\}$ (left) and $v_4\{2, |\Delta\eta|< 0.8\}$ (right) as a function of centrality in Xe$-$Xe and Pb$-$Pb collisions at $\sqrt{s_{\rm NN}}=5.44$ TeV and $\sqrt{s_{\rm NN}}=5.02$ TeV, respectively. Panels (c) and (d): Ratio between Xe$-$Xe and Pb$-$Pb $v_3\{2, |\Delta\eta|< 0.8\}$ (left) and $v_4\{2, |\Delta\eta|< 0.8\}$ (right). Statistical and systematical uncertainties are shown as vertical lines and grey boxes, respectively. The measurements are compared with IP-Glasma+MUSIC+UrQMD calculations to constrain the $\beta_2$ and $a_0$ parameters of $^{129}$Xe nuclei. The thickness of the bands represent statistical uncertainties. |  |
Figure 4
Panels (a) and (b): Charged particle $v_{4,22}$ (left) and $\rho_{4,22}$ (right) as a function of centrality in Xe$-$Xe and Pb$-$Pb collisions at $\sqrt{s_{\rm NN}}=5.44$ TeV and $\sqrt{s_{\rm NN}}=5.02$ TeV, respectively. Panels (c) and (d): Ratio between Xe$-$Xe and Pb$-$Pb $v_{4,22}$ (left) and $\rho_{4,22}$ (right). Statistical and systematical uncertainties are shown as vertical lines and grey boxes, respectively. The measurements are compared with IP-Glasma+MUSIC+UrQMD calculations to constrain the $\beta_2$ and $a_0$ parameters of $^{129}$Xe nuclei. The thickness of the bands represent statistical uncertainties. | 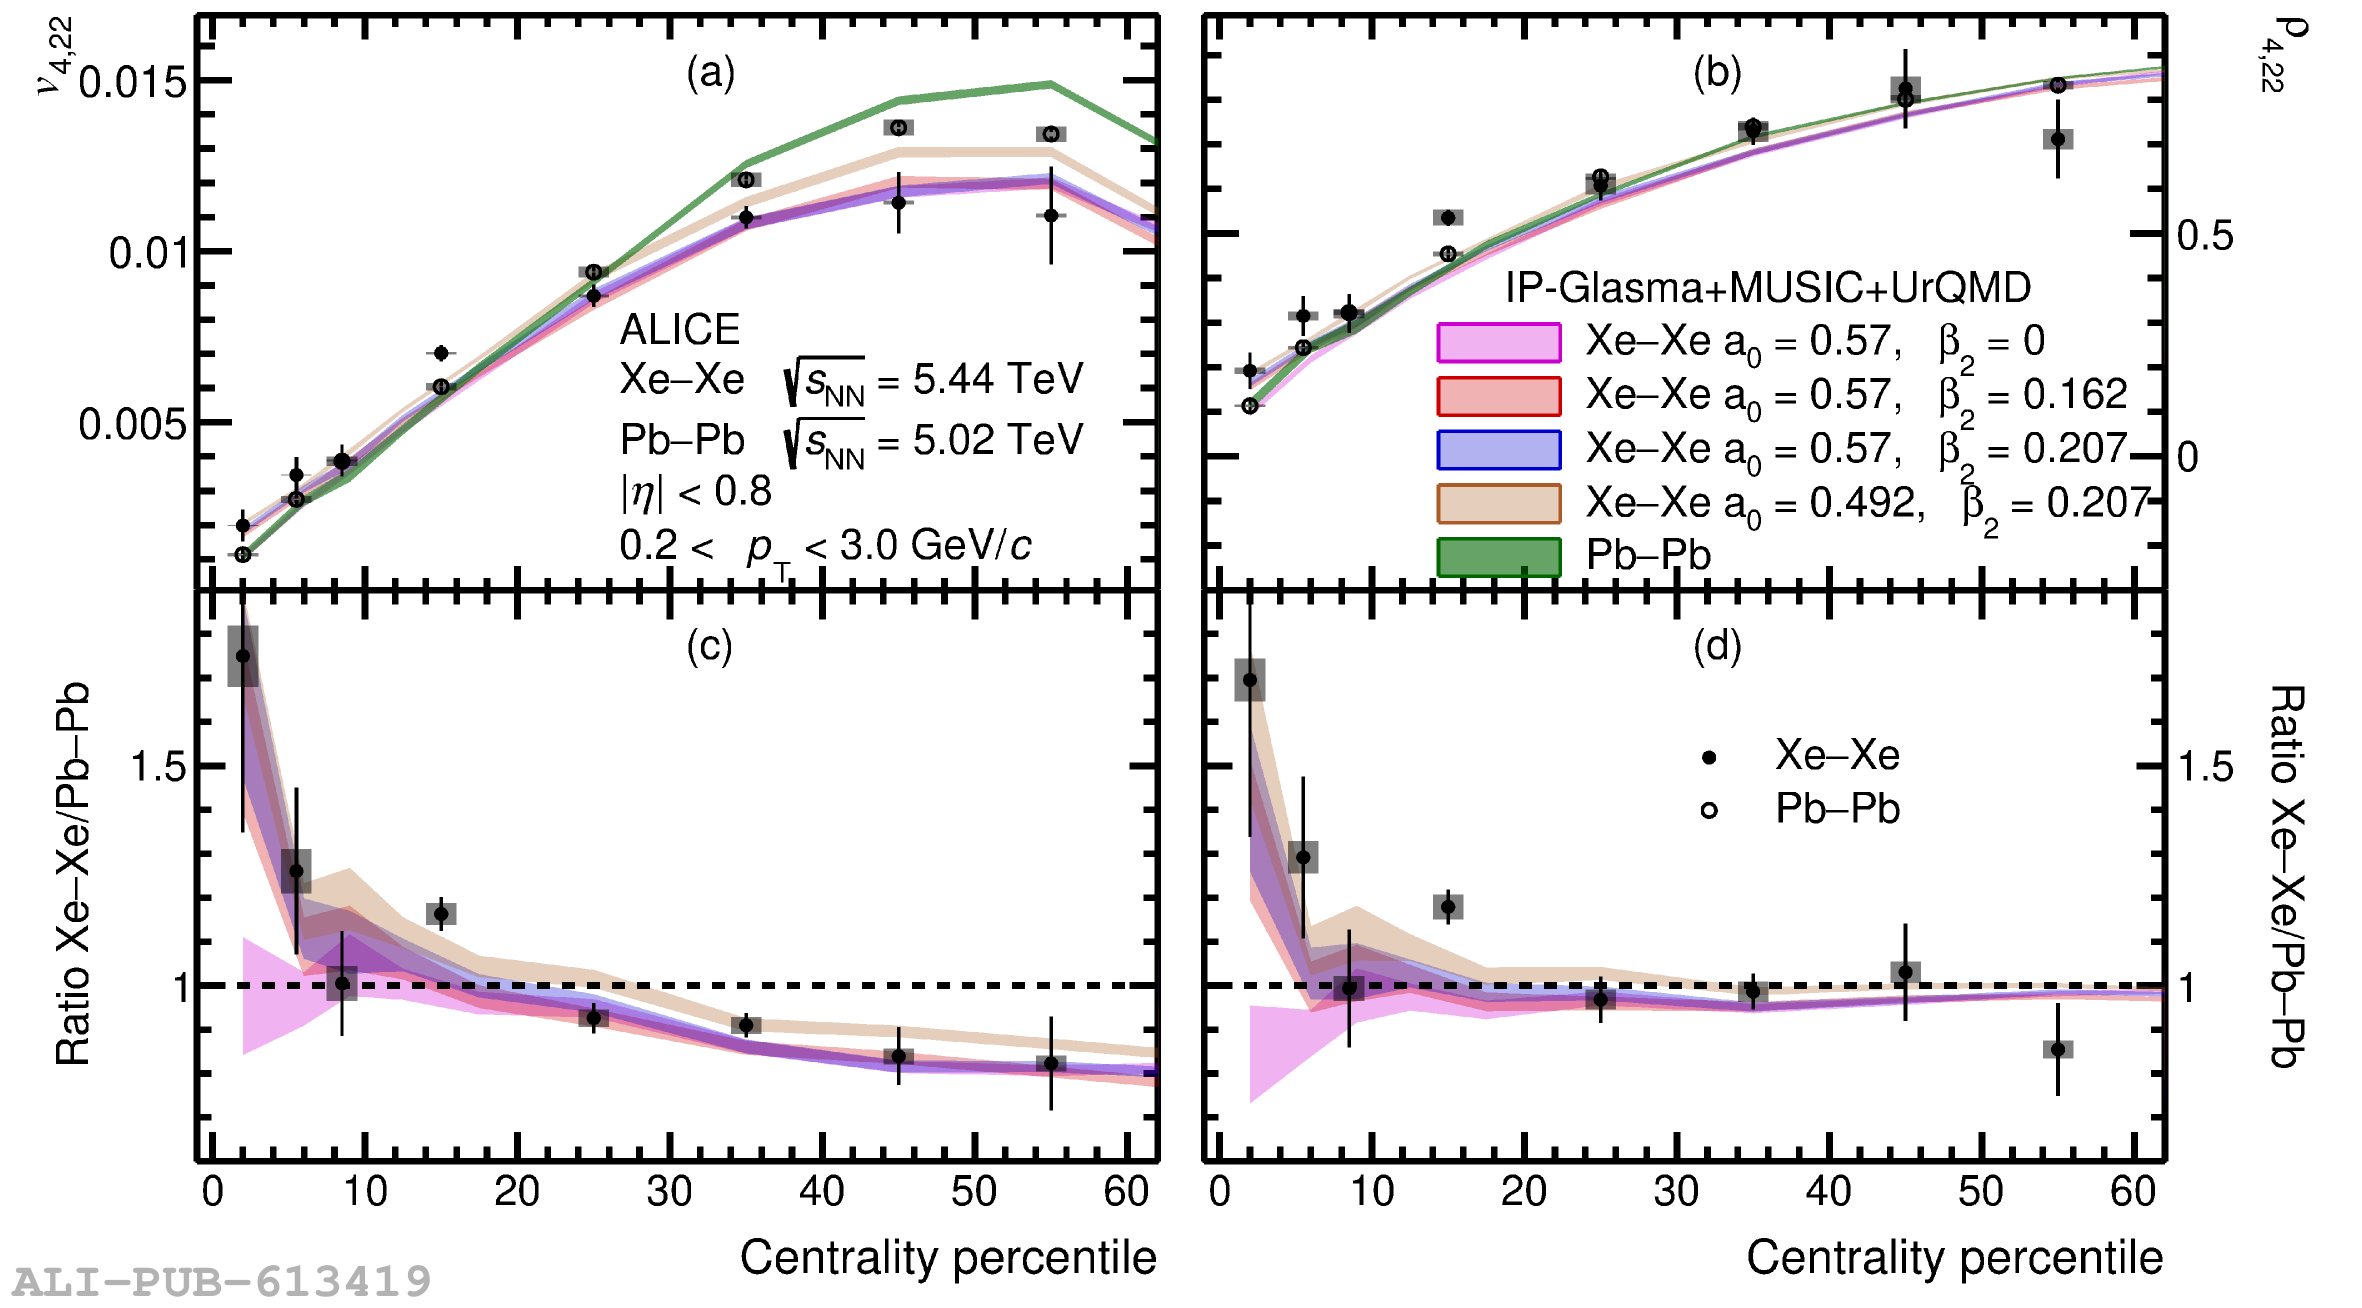 |
Figure 5
Values of $\chi^2/N_{\rm dof}$ between the measurements (Xe$-$Xe/Pb$-$Pb) and the calculations (Xe$-$Xe/Pb$-$Pb). The x-axis represents the different measured observables, and the y-axis is shown on a logarithmic scale. Panels (a) and (b) show the results for the 0-20% and 20-60% centrality ranges, respectively. | 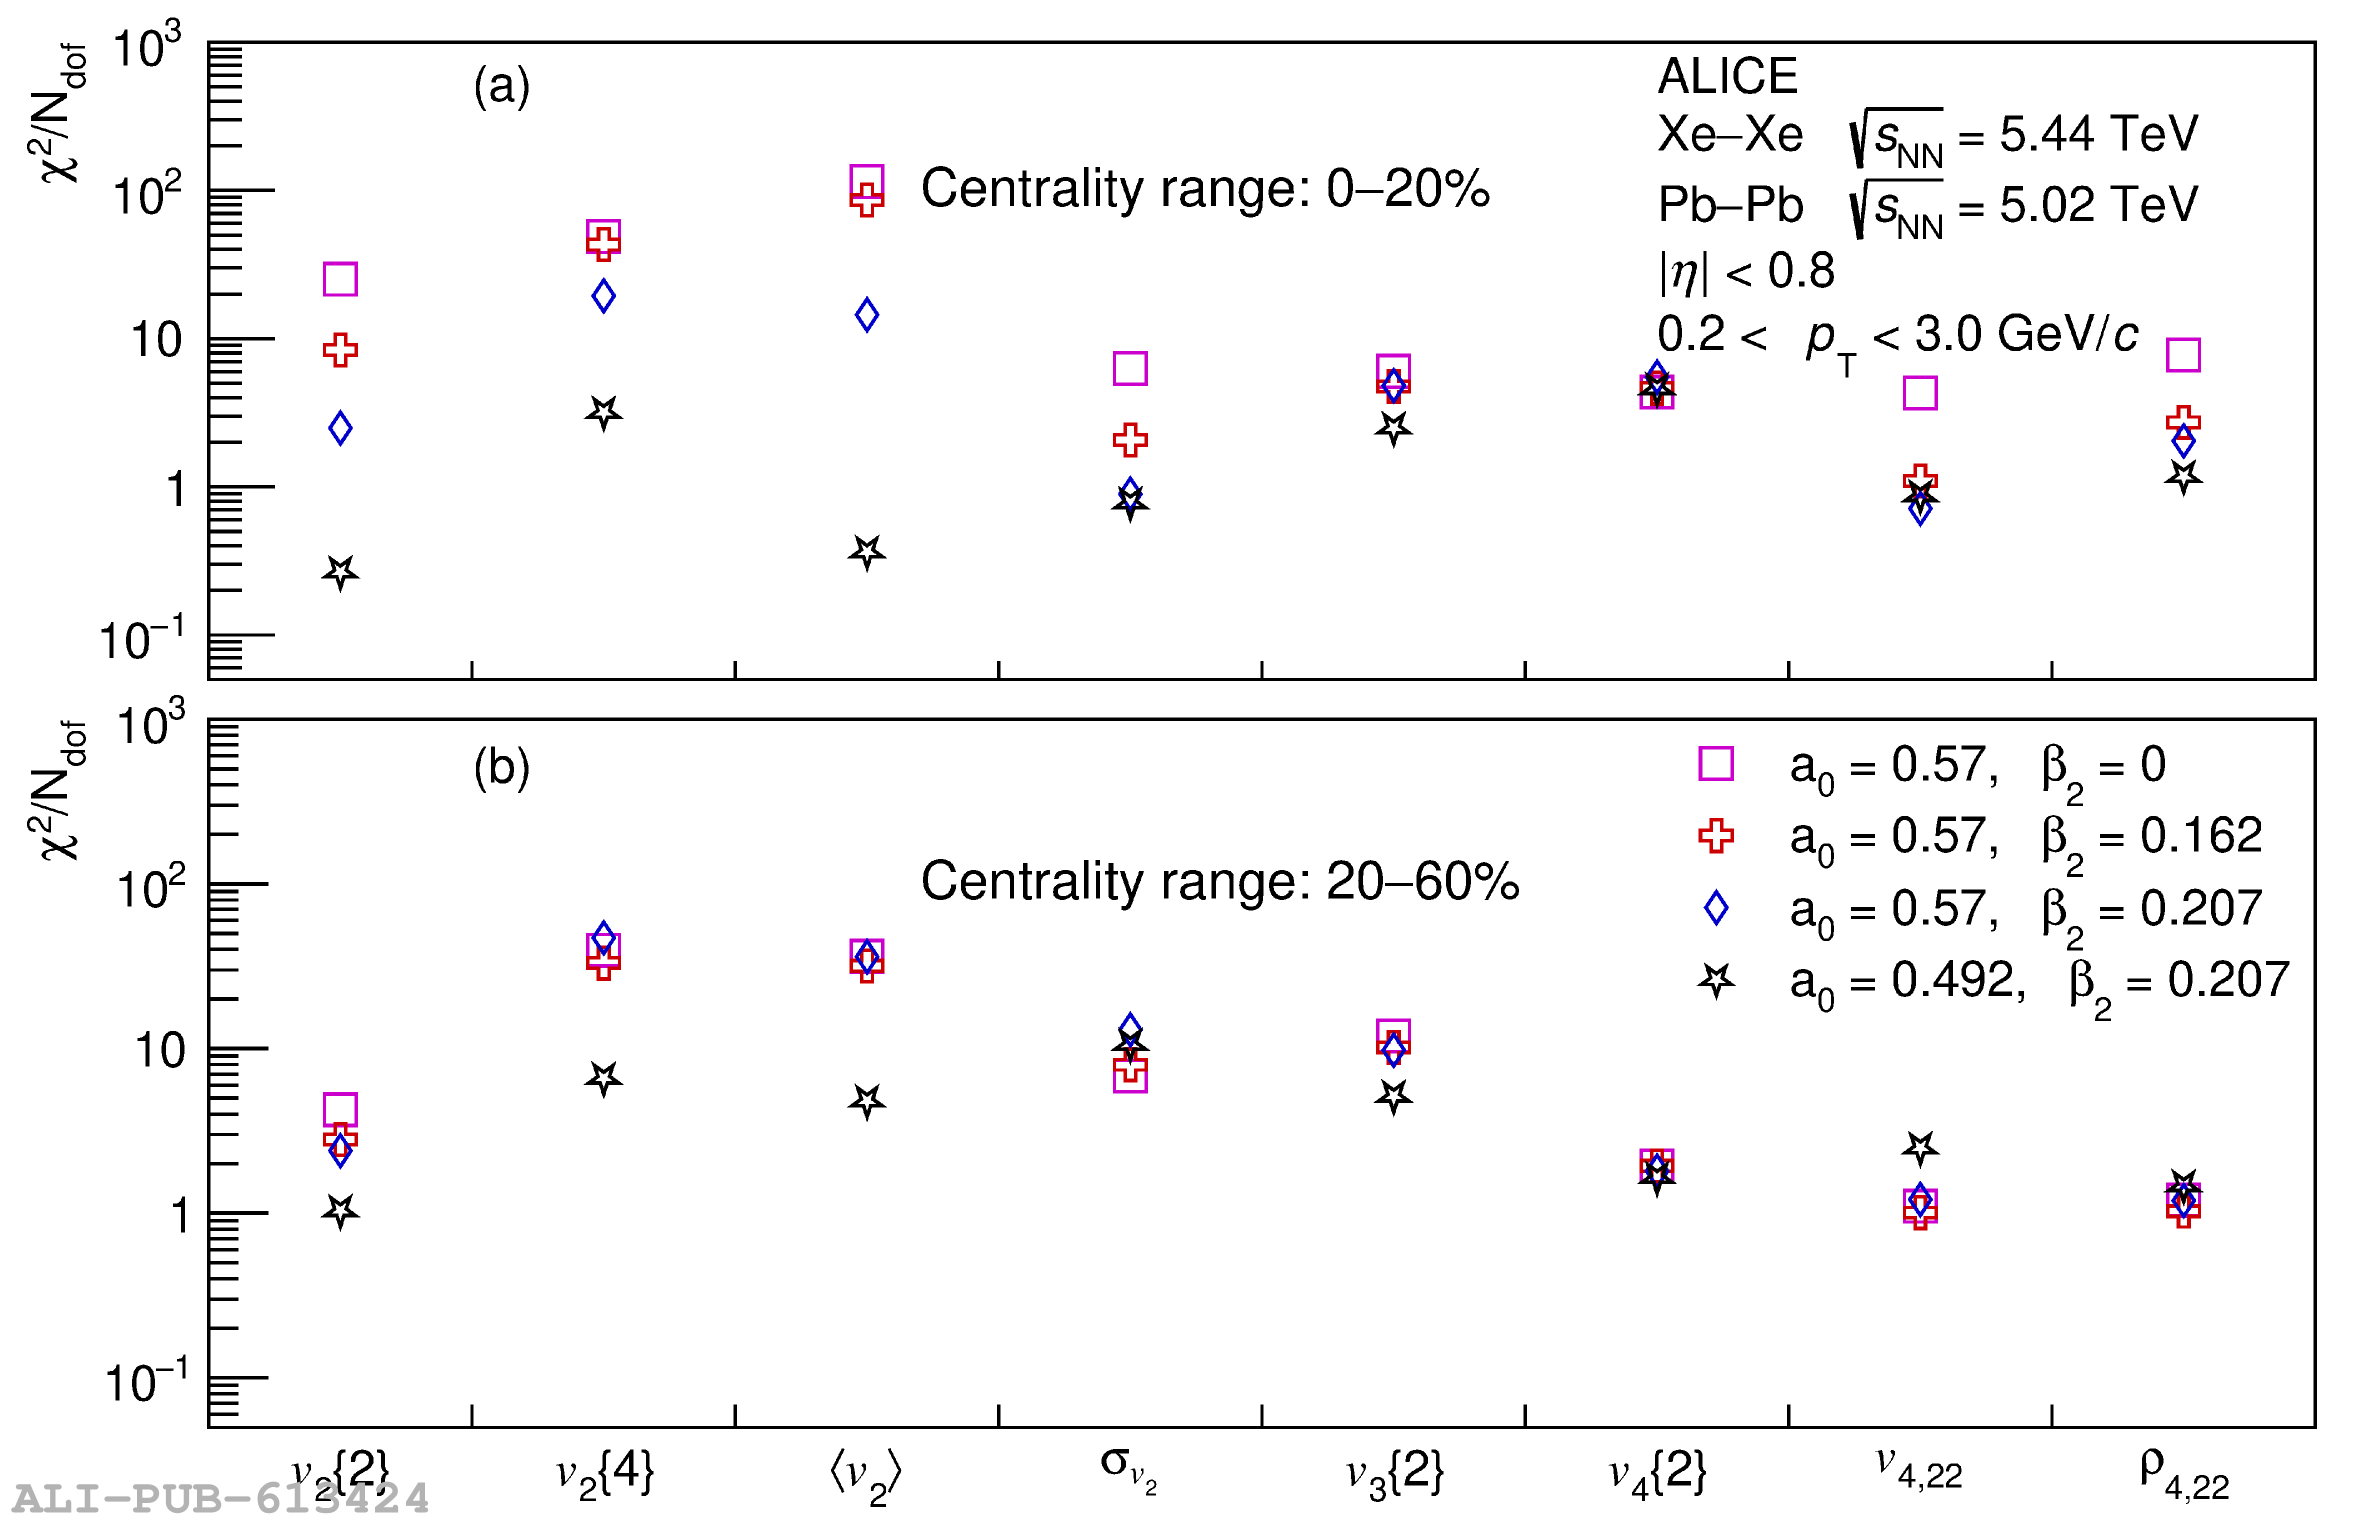 |
Figure A.1
Panels (a) and (b): Charged particle $v_{4}^{\rm L}$ (left) and $\chi_{4,22}$ (right) as a function of centrality in Xe$-$Xe and Pb$-$Pb collisions at $\sqrt{s_{\rm NN}}=5.44$ TeV and $\sqrt{s_{\rm NN}}=5.02$ TeV, respectively. Panels (c) and (d): Ratio between Xe$-$Xe and Pb$-$Pb $v_{4}^{\rm L}$ (left) and $\chi_{4,22}$ (right). Statistical and systematical uncertainties are shown as vertical lines and grey boxes, respectively. The measurements are compared with IP-Glasma+MUSIC+UrQMD calculations. The thickness of the bands represent statistical uncertainties. | 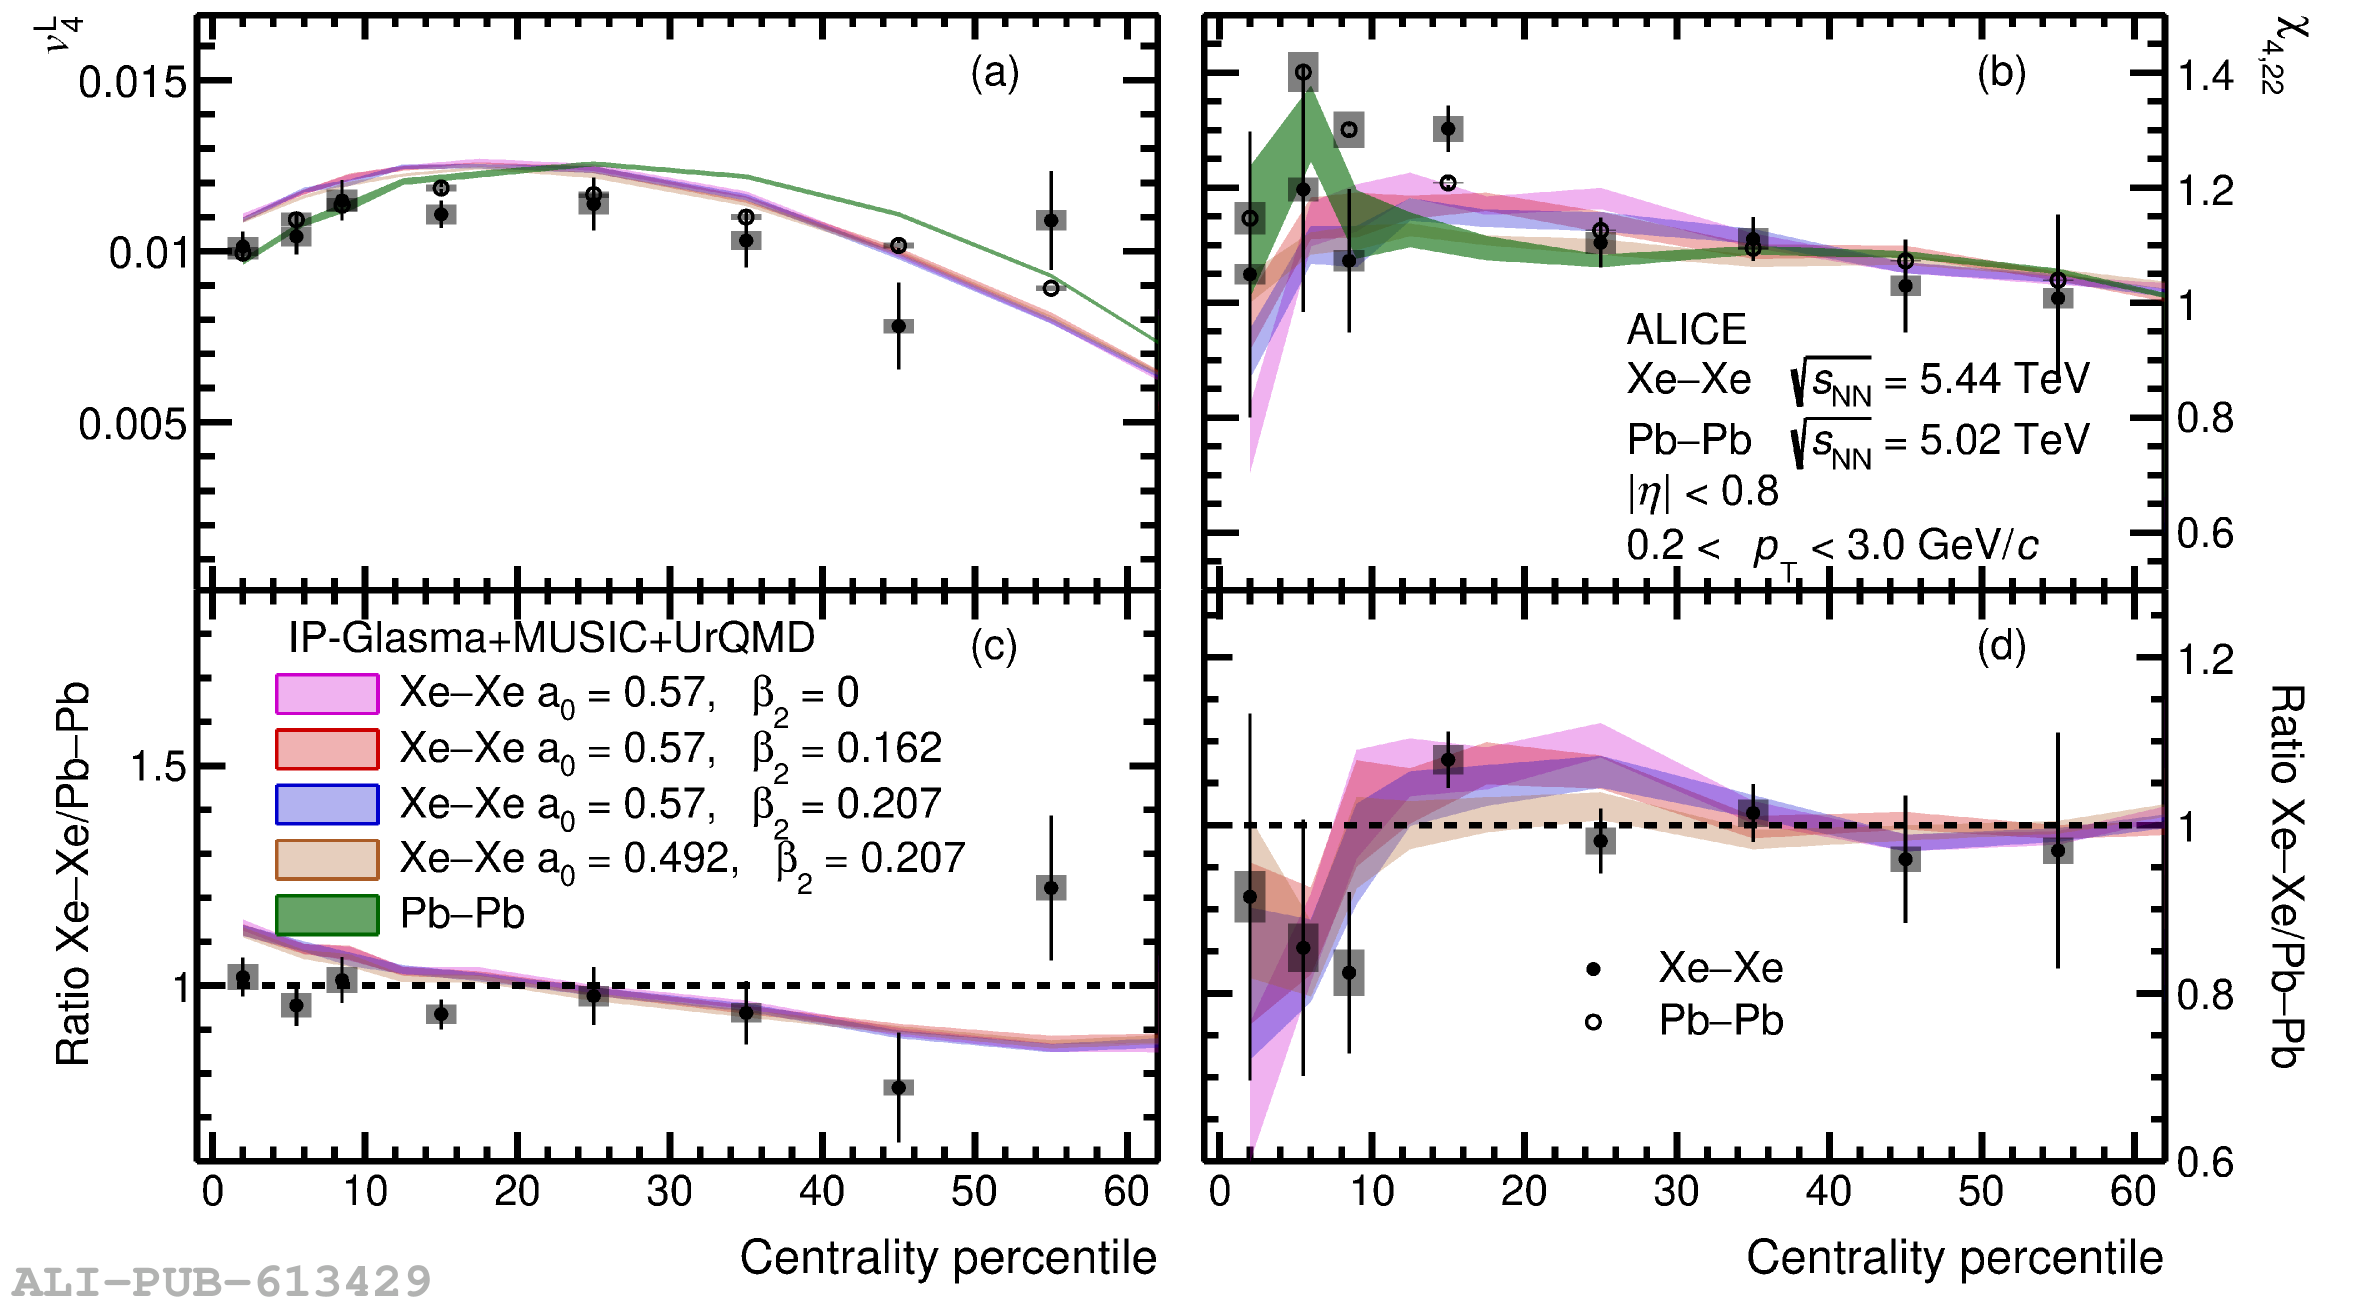 |
Figure A.2
Top Panel: Charged particle NSC$(3,2)$ as a function of centrality in Xe$-$Xe and Pb$-$Pb collisions at $\sqrt{s_{\rm NN}}=5.44$ TeV and $\sqrt{s_{\rm NN}}=5.02$ TeV, respectively. Bottom Panel: Ratio between Xe$-$Xe and Pb$-$Pb NSC$(3,2)$. Statistical and systematical uncertainties are shown as vertical lines and grey boxes, respectively. The measurements are compared with IP-Glasma+MUSIC+UrQMD calculations to constrain the $\beta_2$ and $a_0$ parameters of $^{129}$Xe nuclei. The thickness of the bands represent statistical uncertainties. |  |