Values of $\chi^2/N_{\rm dof}$ between the measurements (Xe$-$Xe/Pb$-$Pb) and the calculations (Xe$-$Xe/Pb$-$Pb). The x-axis represents the different measured observables, and the y-axis is shown on a logarithmic scale. Panels (a) and (b) show the results for the 0-20% and 20-60% centrality ranges, respectively. | 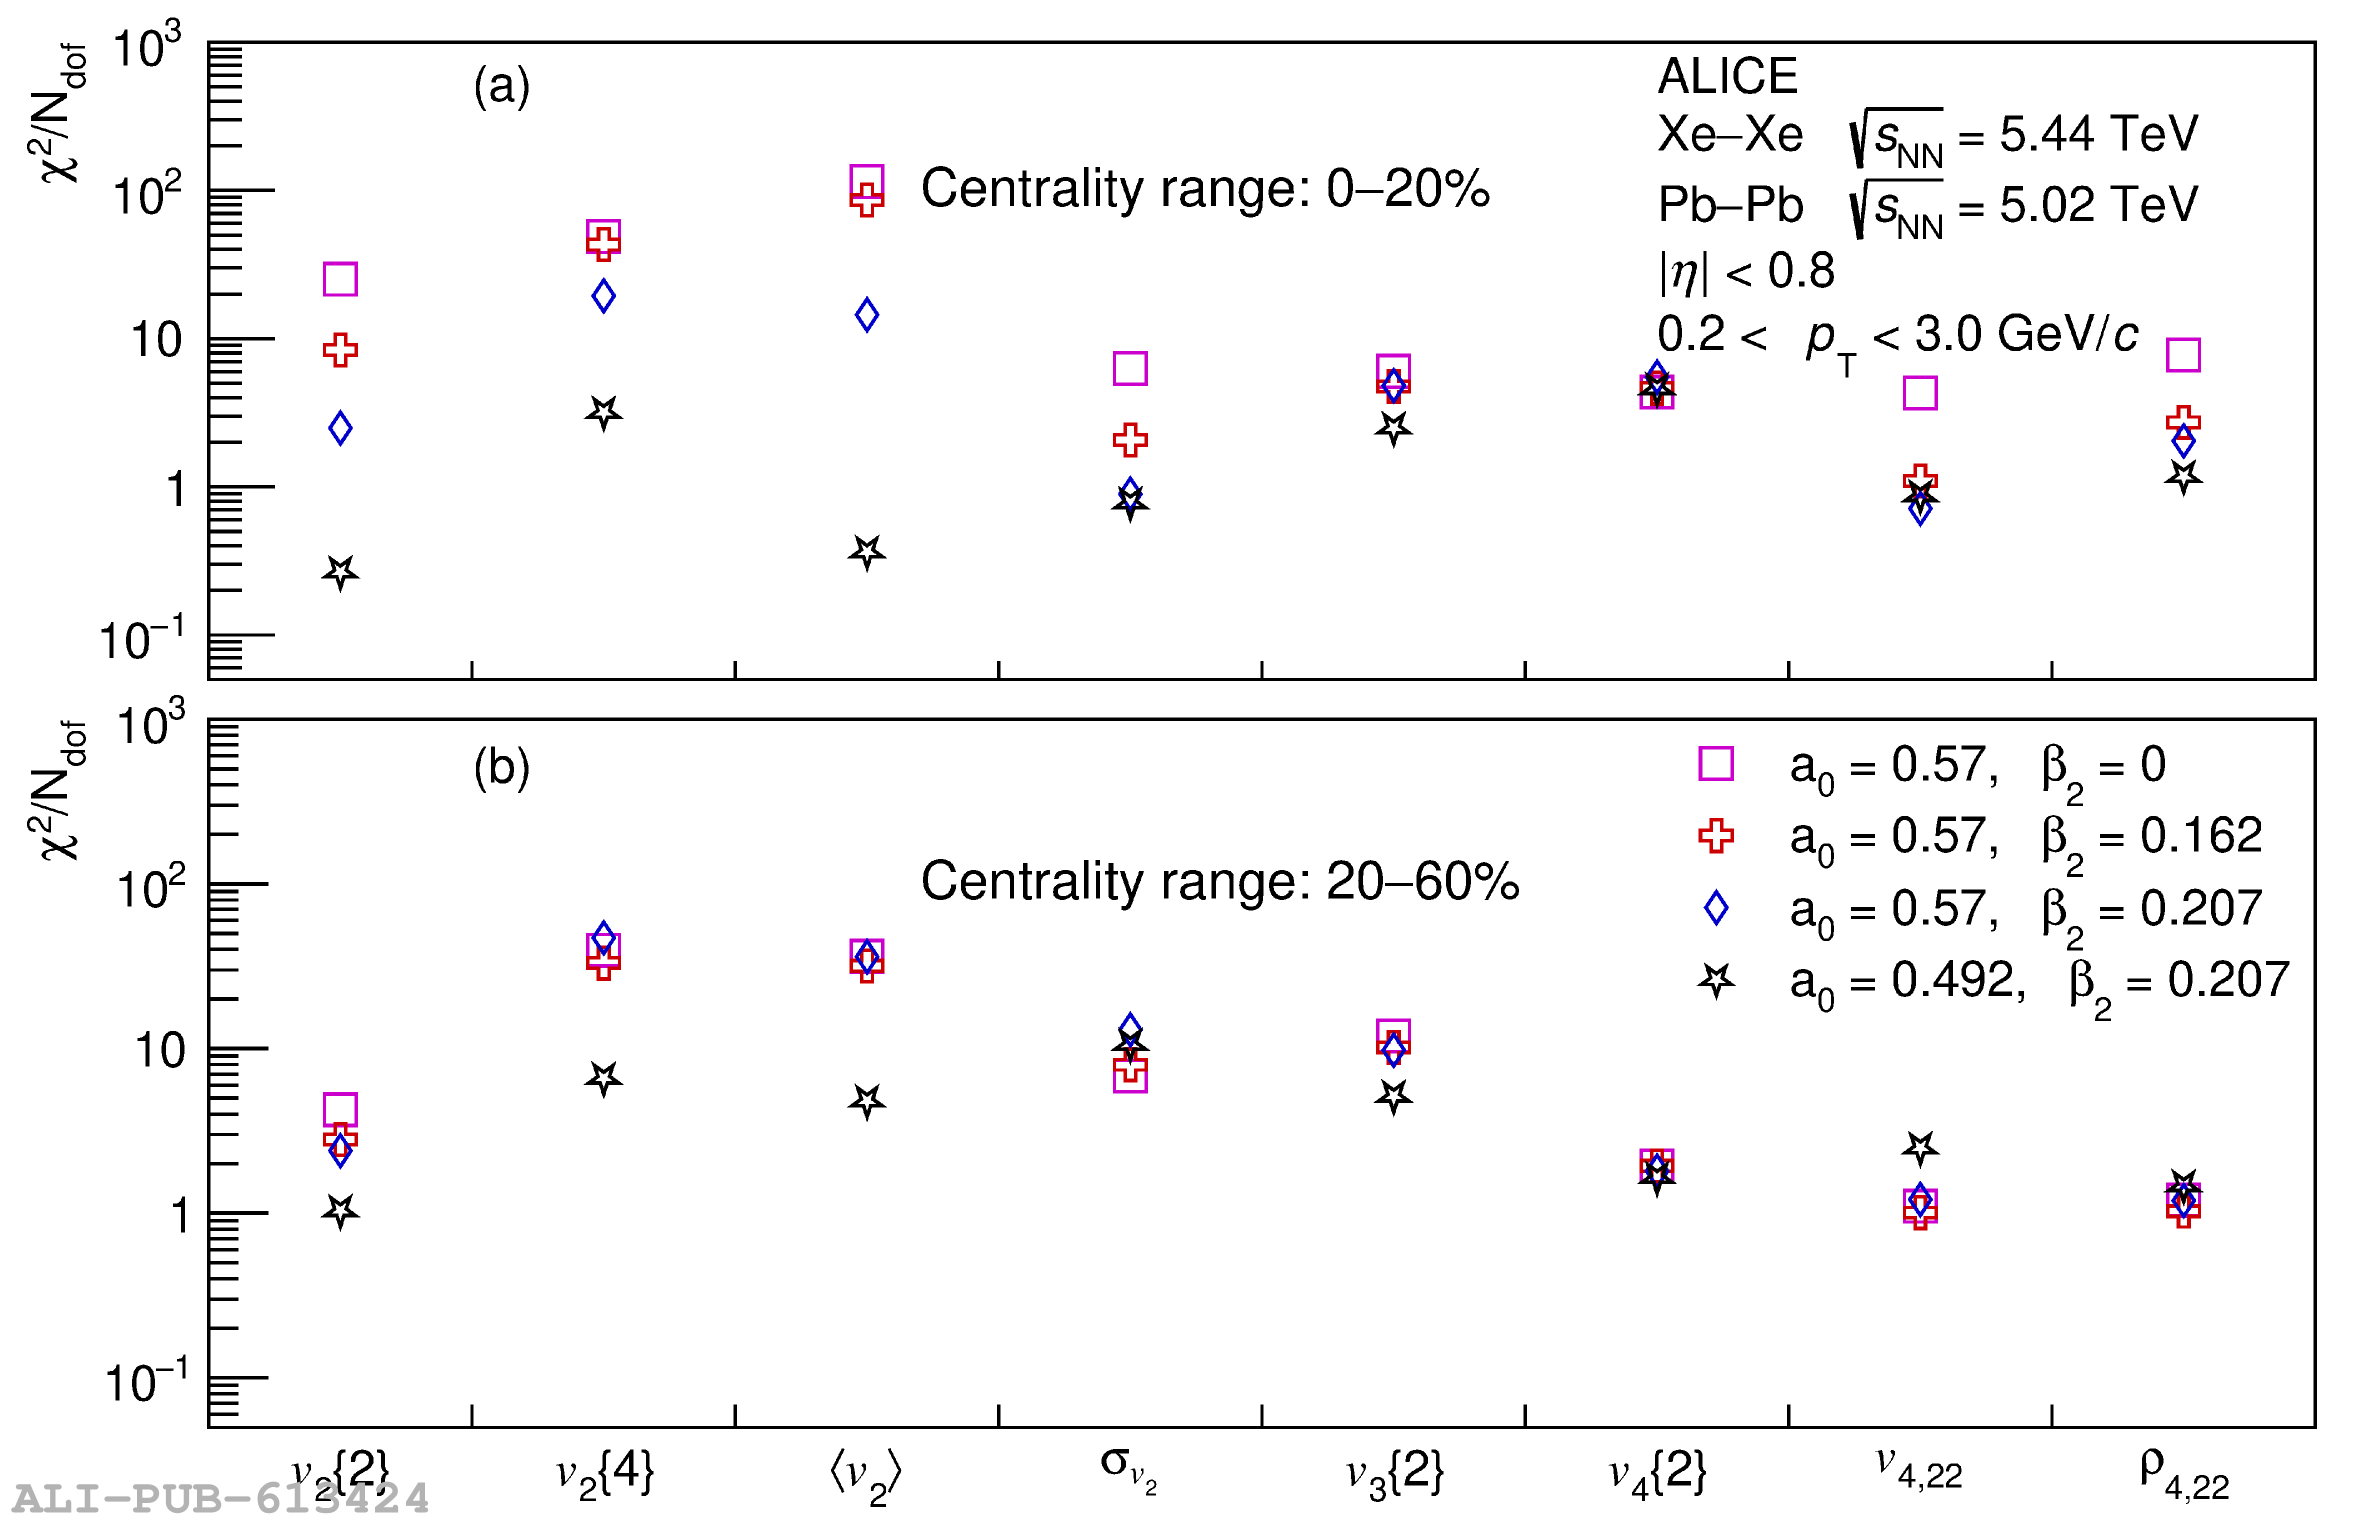 |