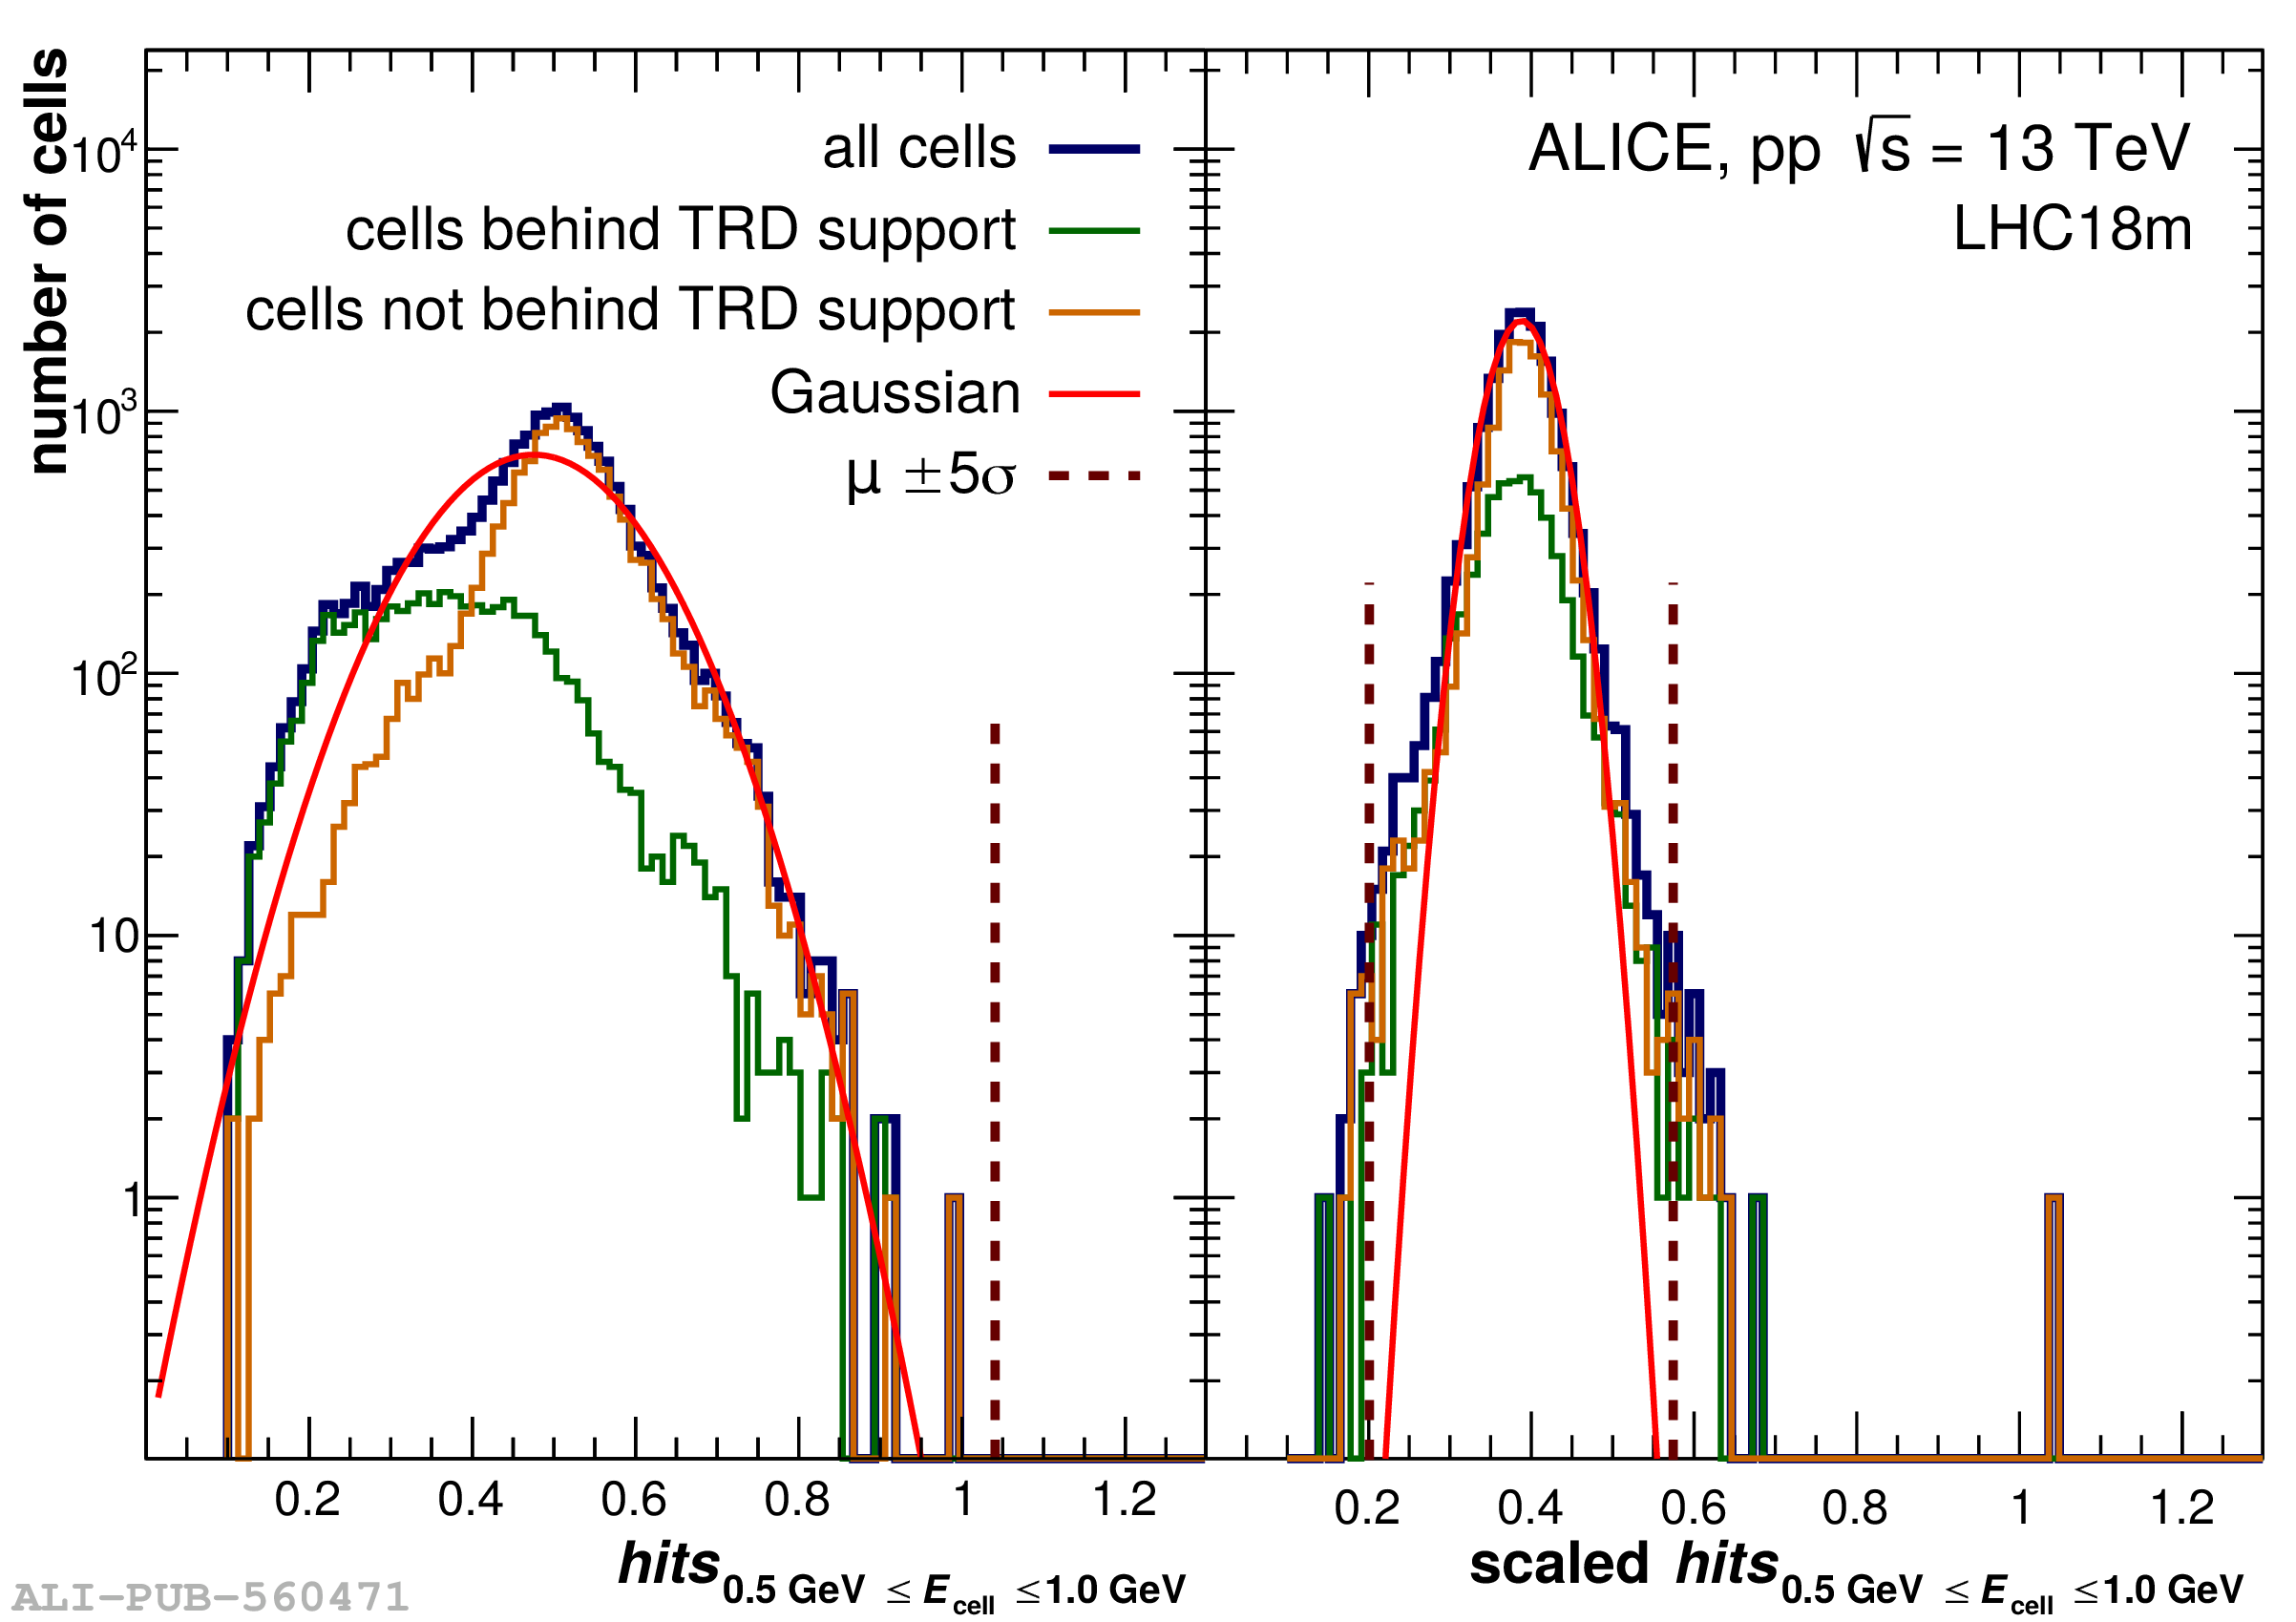
Hit distribution for 0.5 GeV $ \leq E_{\text{cell}} < $ 1.0 GeV before (left) and after (right) the scaling procedure. All cells are shown in blue, cells behind the TRD support structure in green, and cells not behind the TRD support structure in orange.