Left: Centrality percentile distribution of \gls{EMCal} \gls{L1} $\gamma$ triggered events (red) in comparison to the pure minimum bias distribution and minimum bias triggered events with a 10 GeV cluster in the event. Right: Trigger \glspl{RF} for the \gls{EMCal} or \gls{DCal} \gls{L1} $\gamma$ triggers in different centrality classes for \PbPb\ collisions at $\snn= 5.02$ TeV. Only statistical uncertainties of the trigger \gls{RF} are given in the legend. | 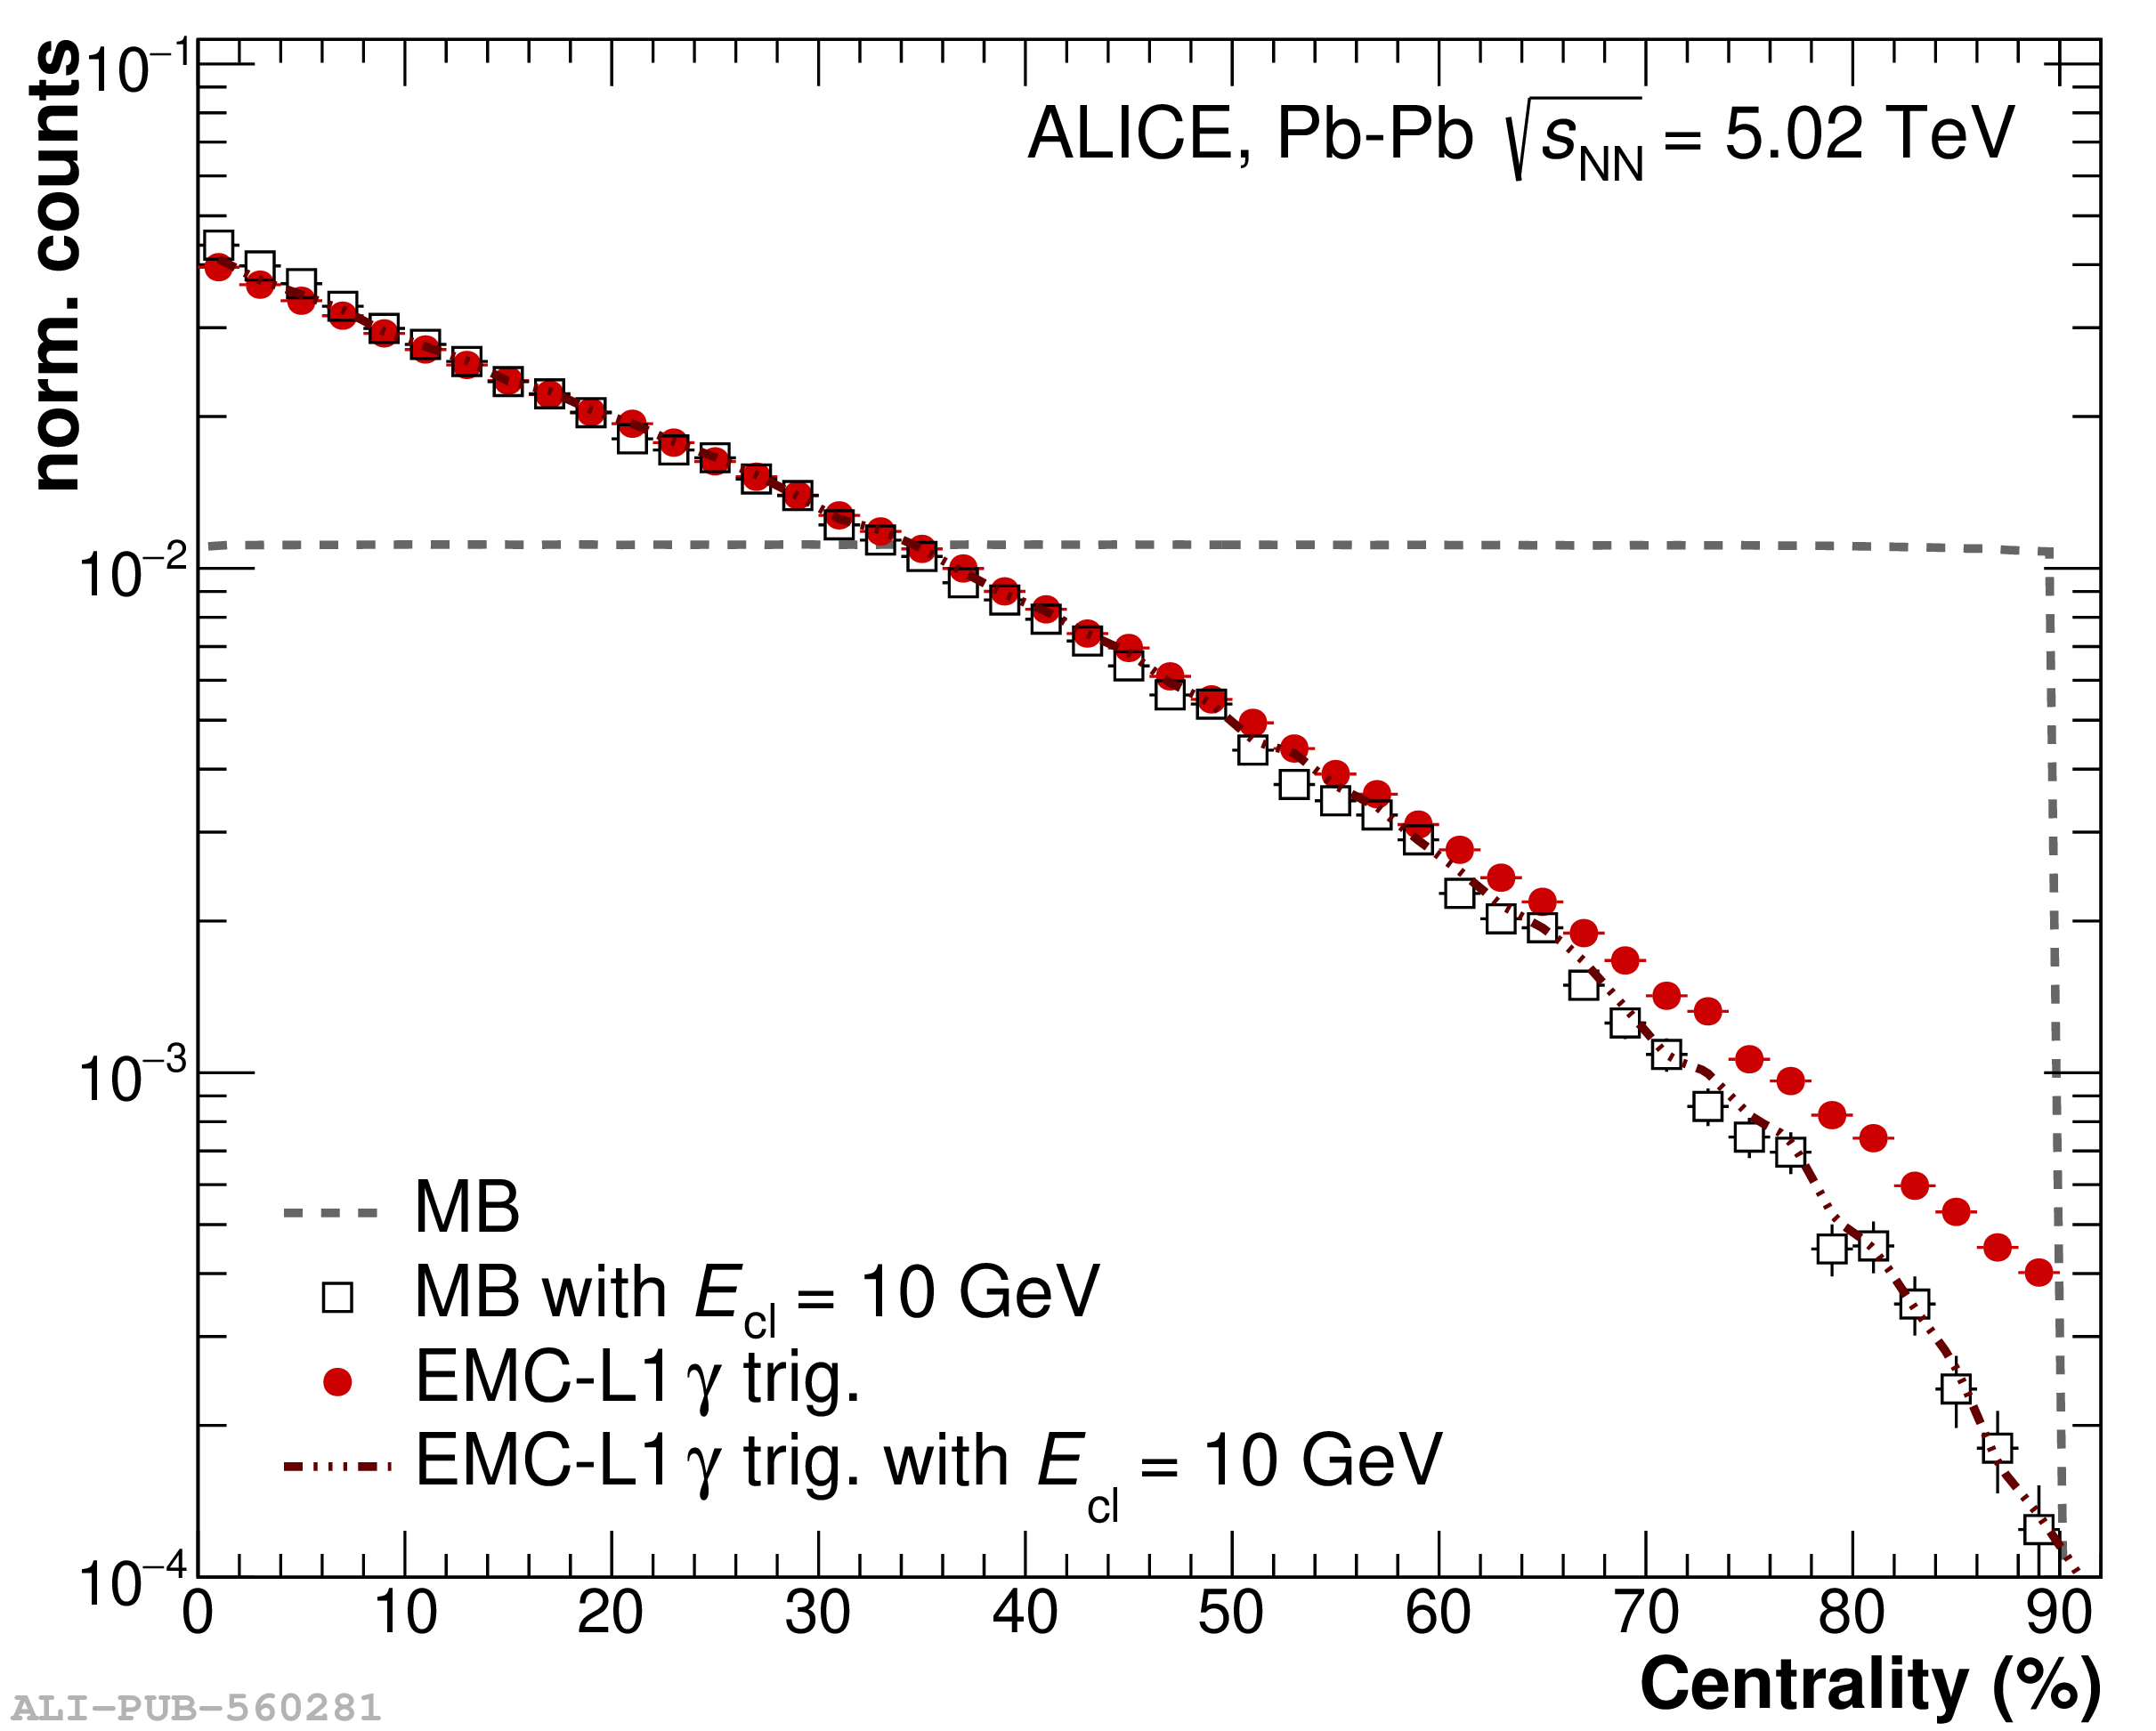  |