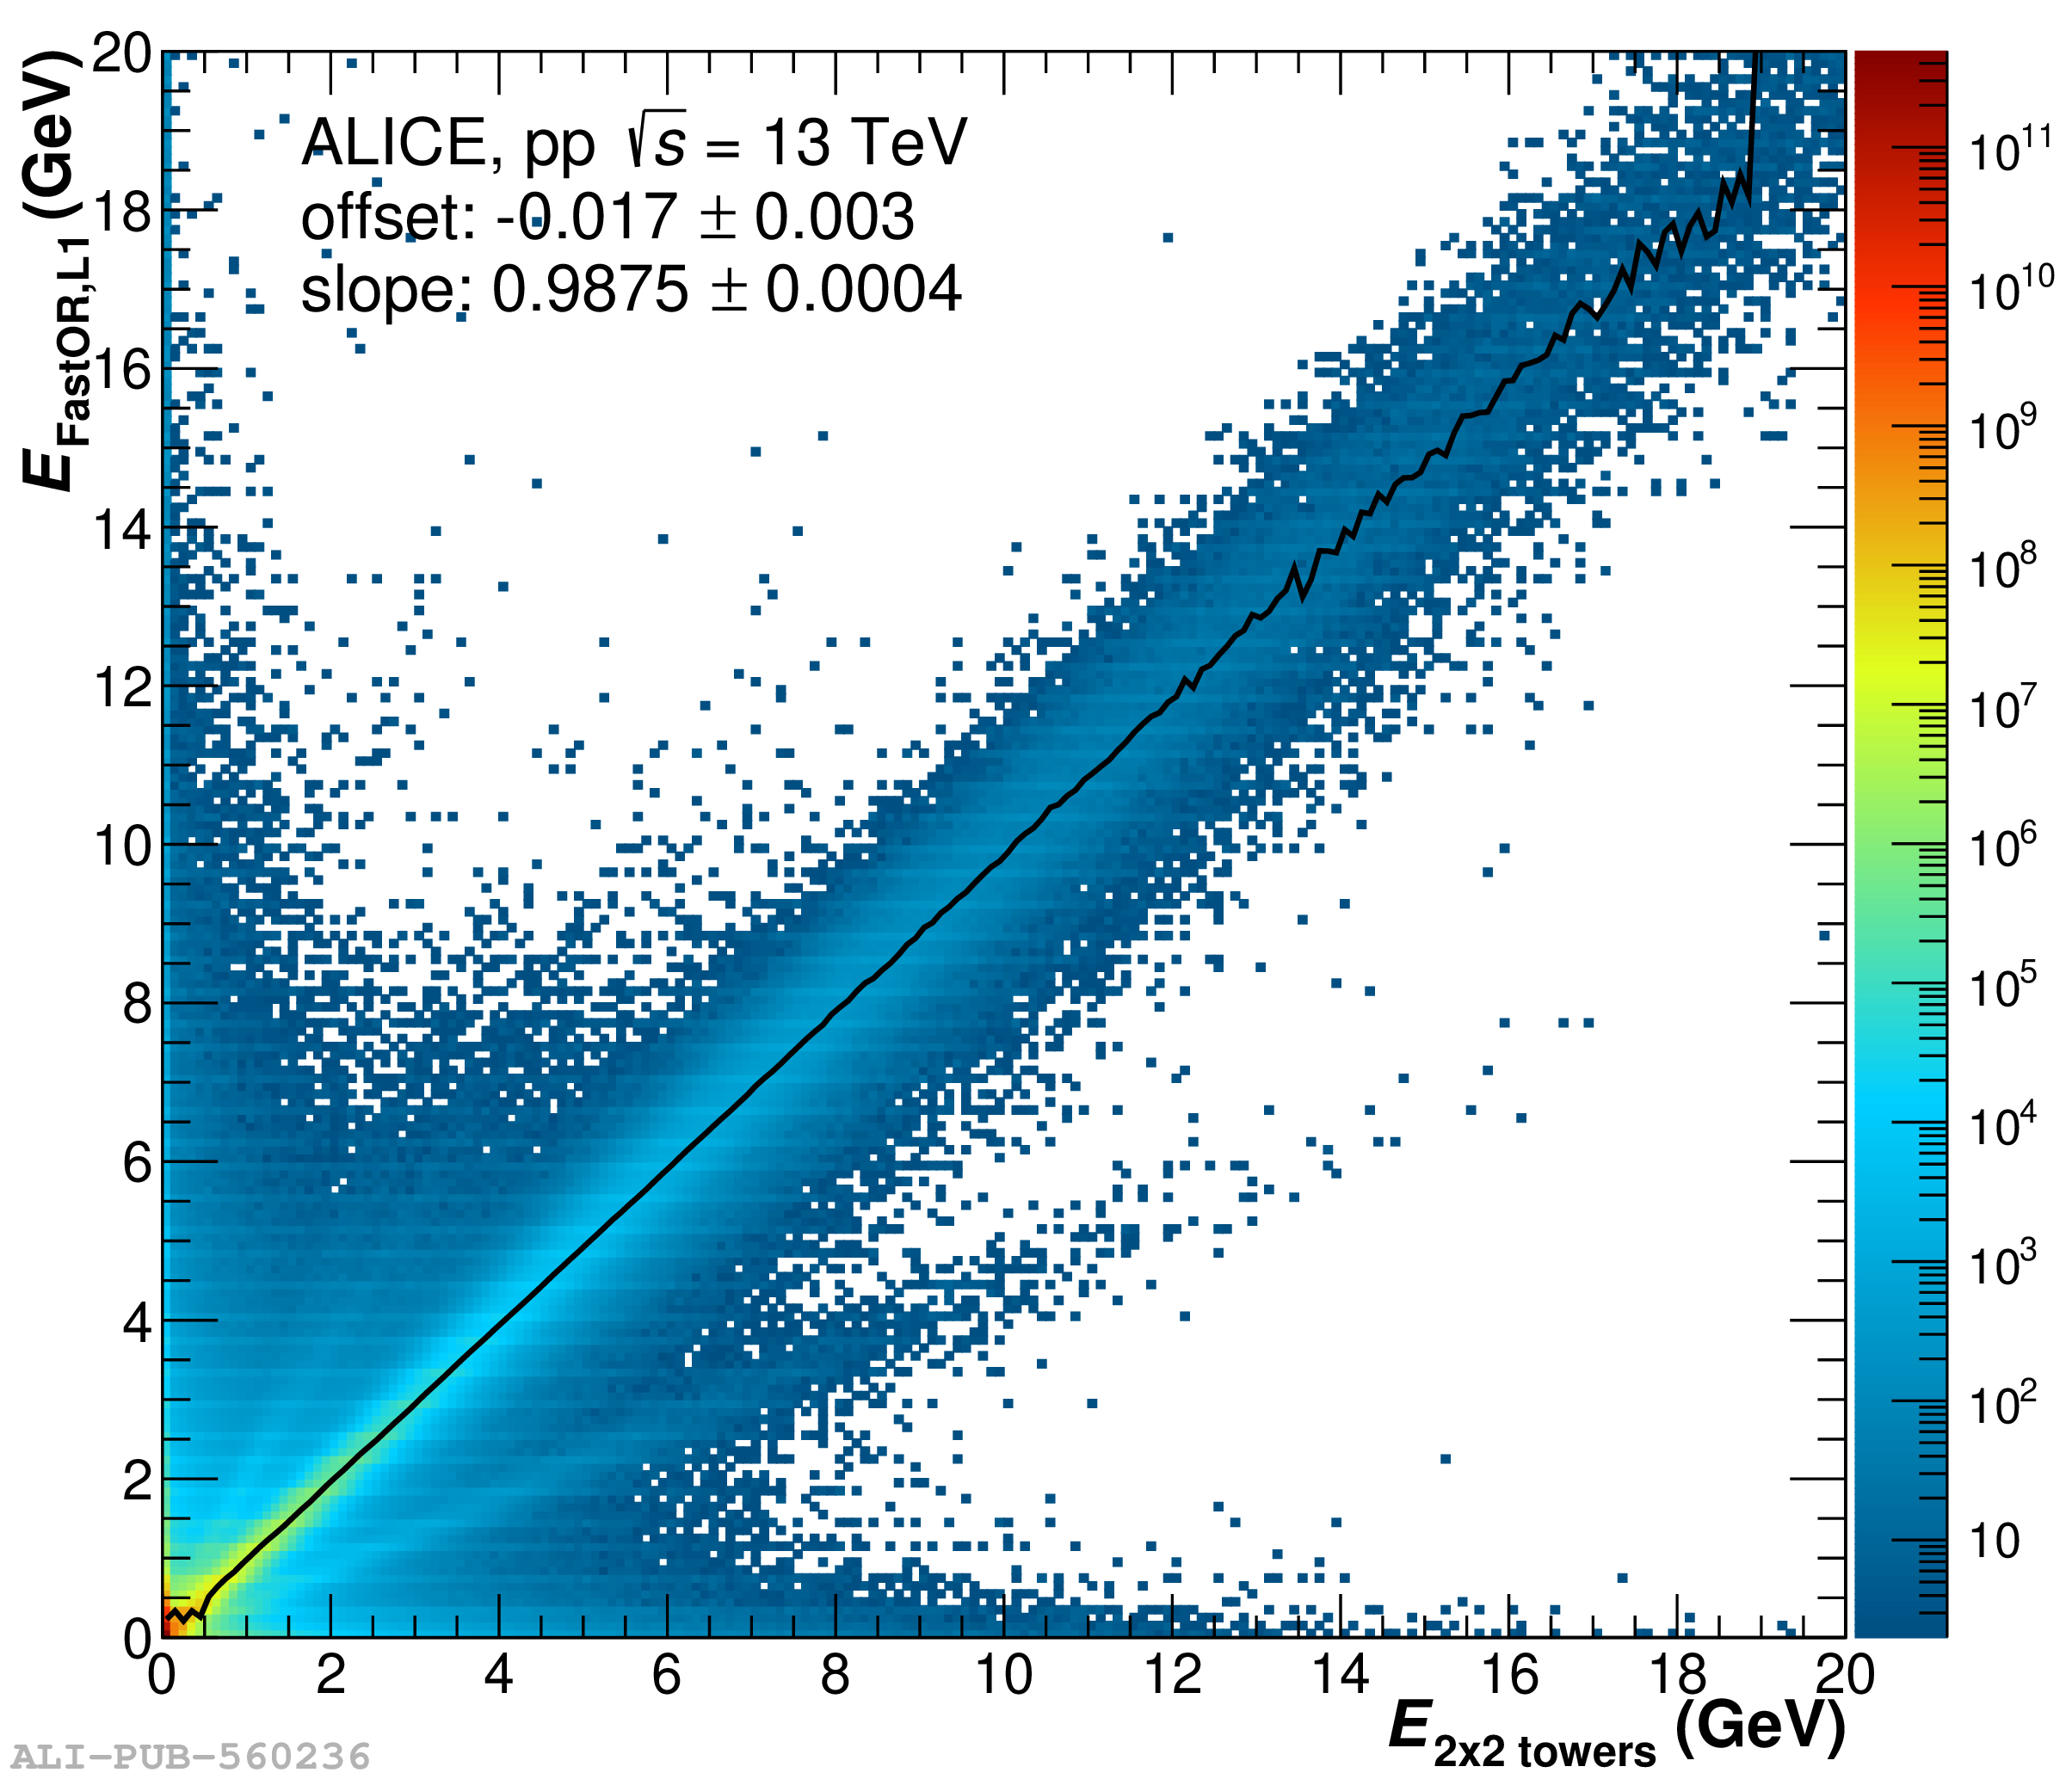
Correlation between energy from the \gls{FEE} and FastOR readout based on the \gls{L1} \glspl{ADC} for towers corresponding to the same FastOR module. The black line indicates the mean energy in the FastOR for a given energy interval at \gls{FEE} level.