Schematic comparison of different clusterization algorithms. Only one dimension is shown for simplicity Yellow boxes represent the energy in each cell. $E_\mathrm{agg}$ is the clusterization threshold as defined in the text. The different clusters are indicated by blue and red hatched areas Each panel represents a clusterization algorithm: a) V1, b) $3 \times 3$, c) V2, d) V1+unfolding. | 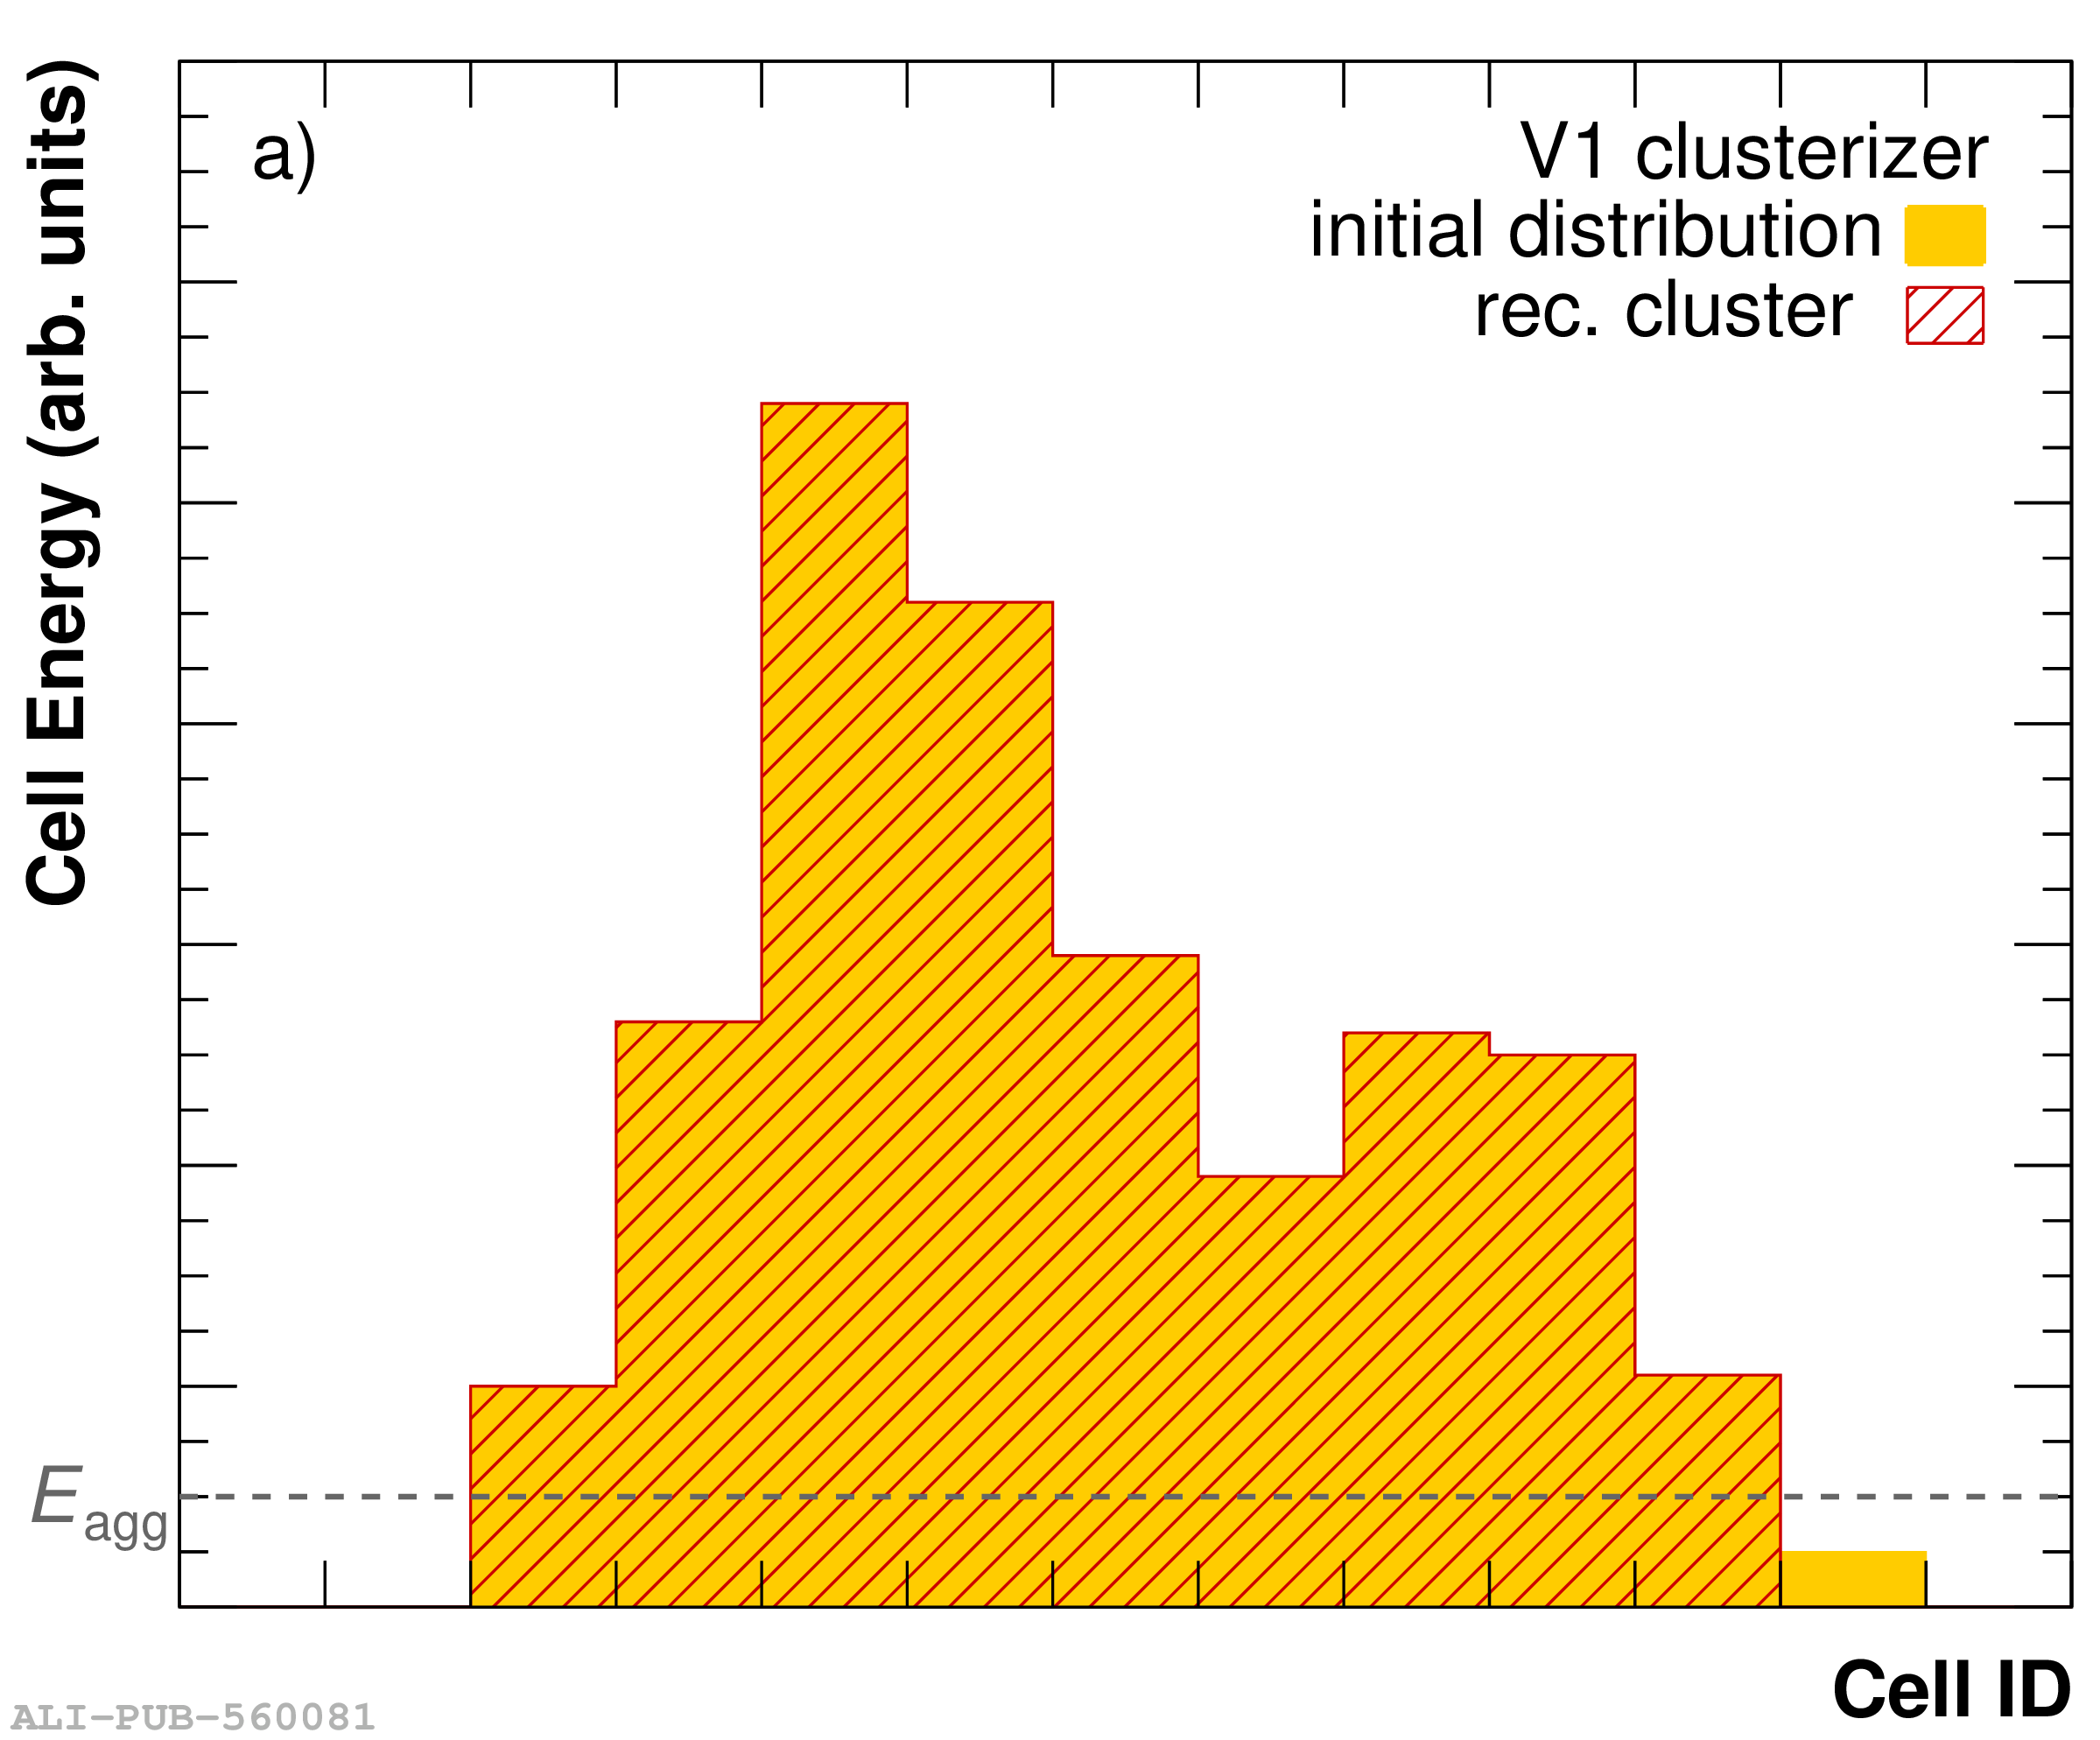 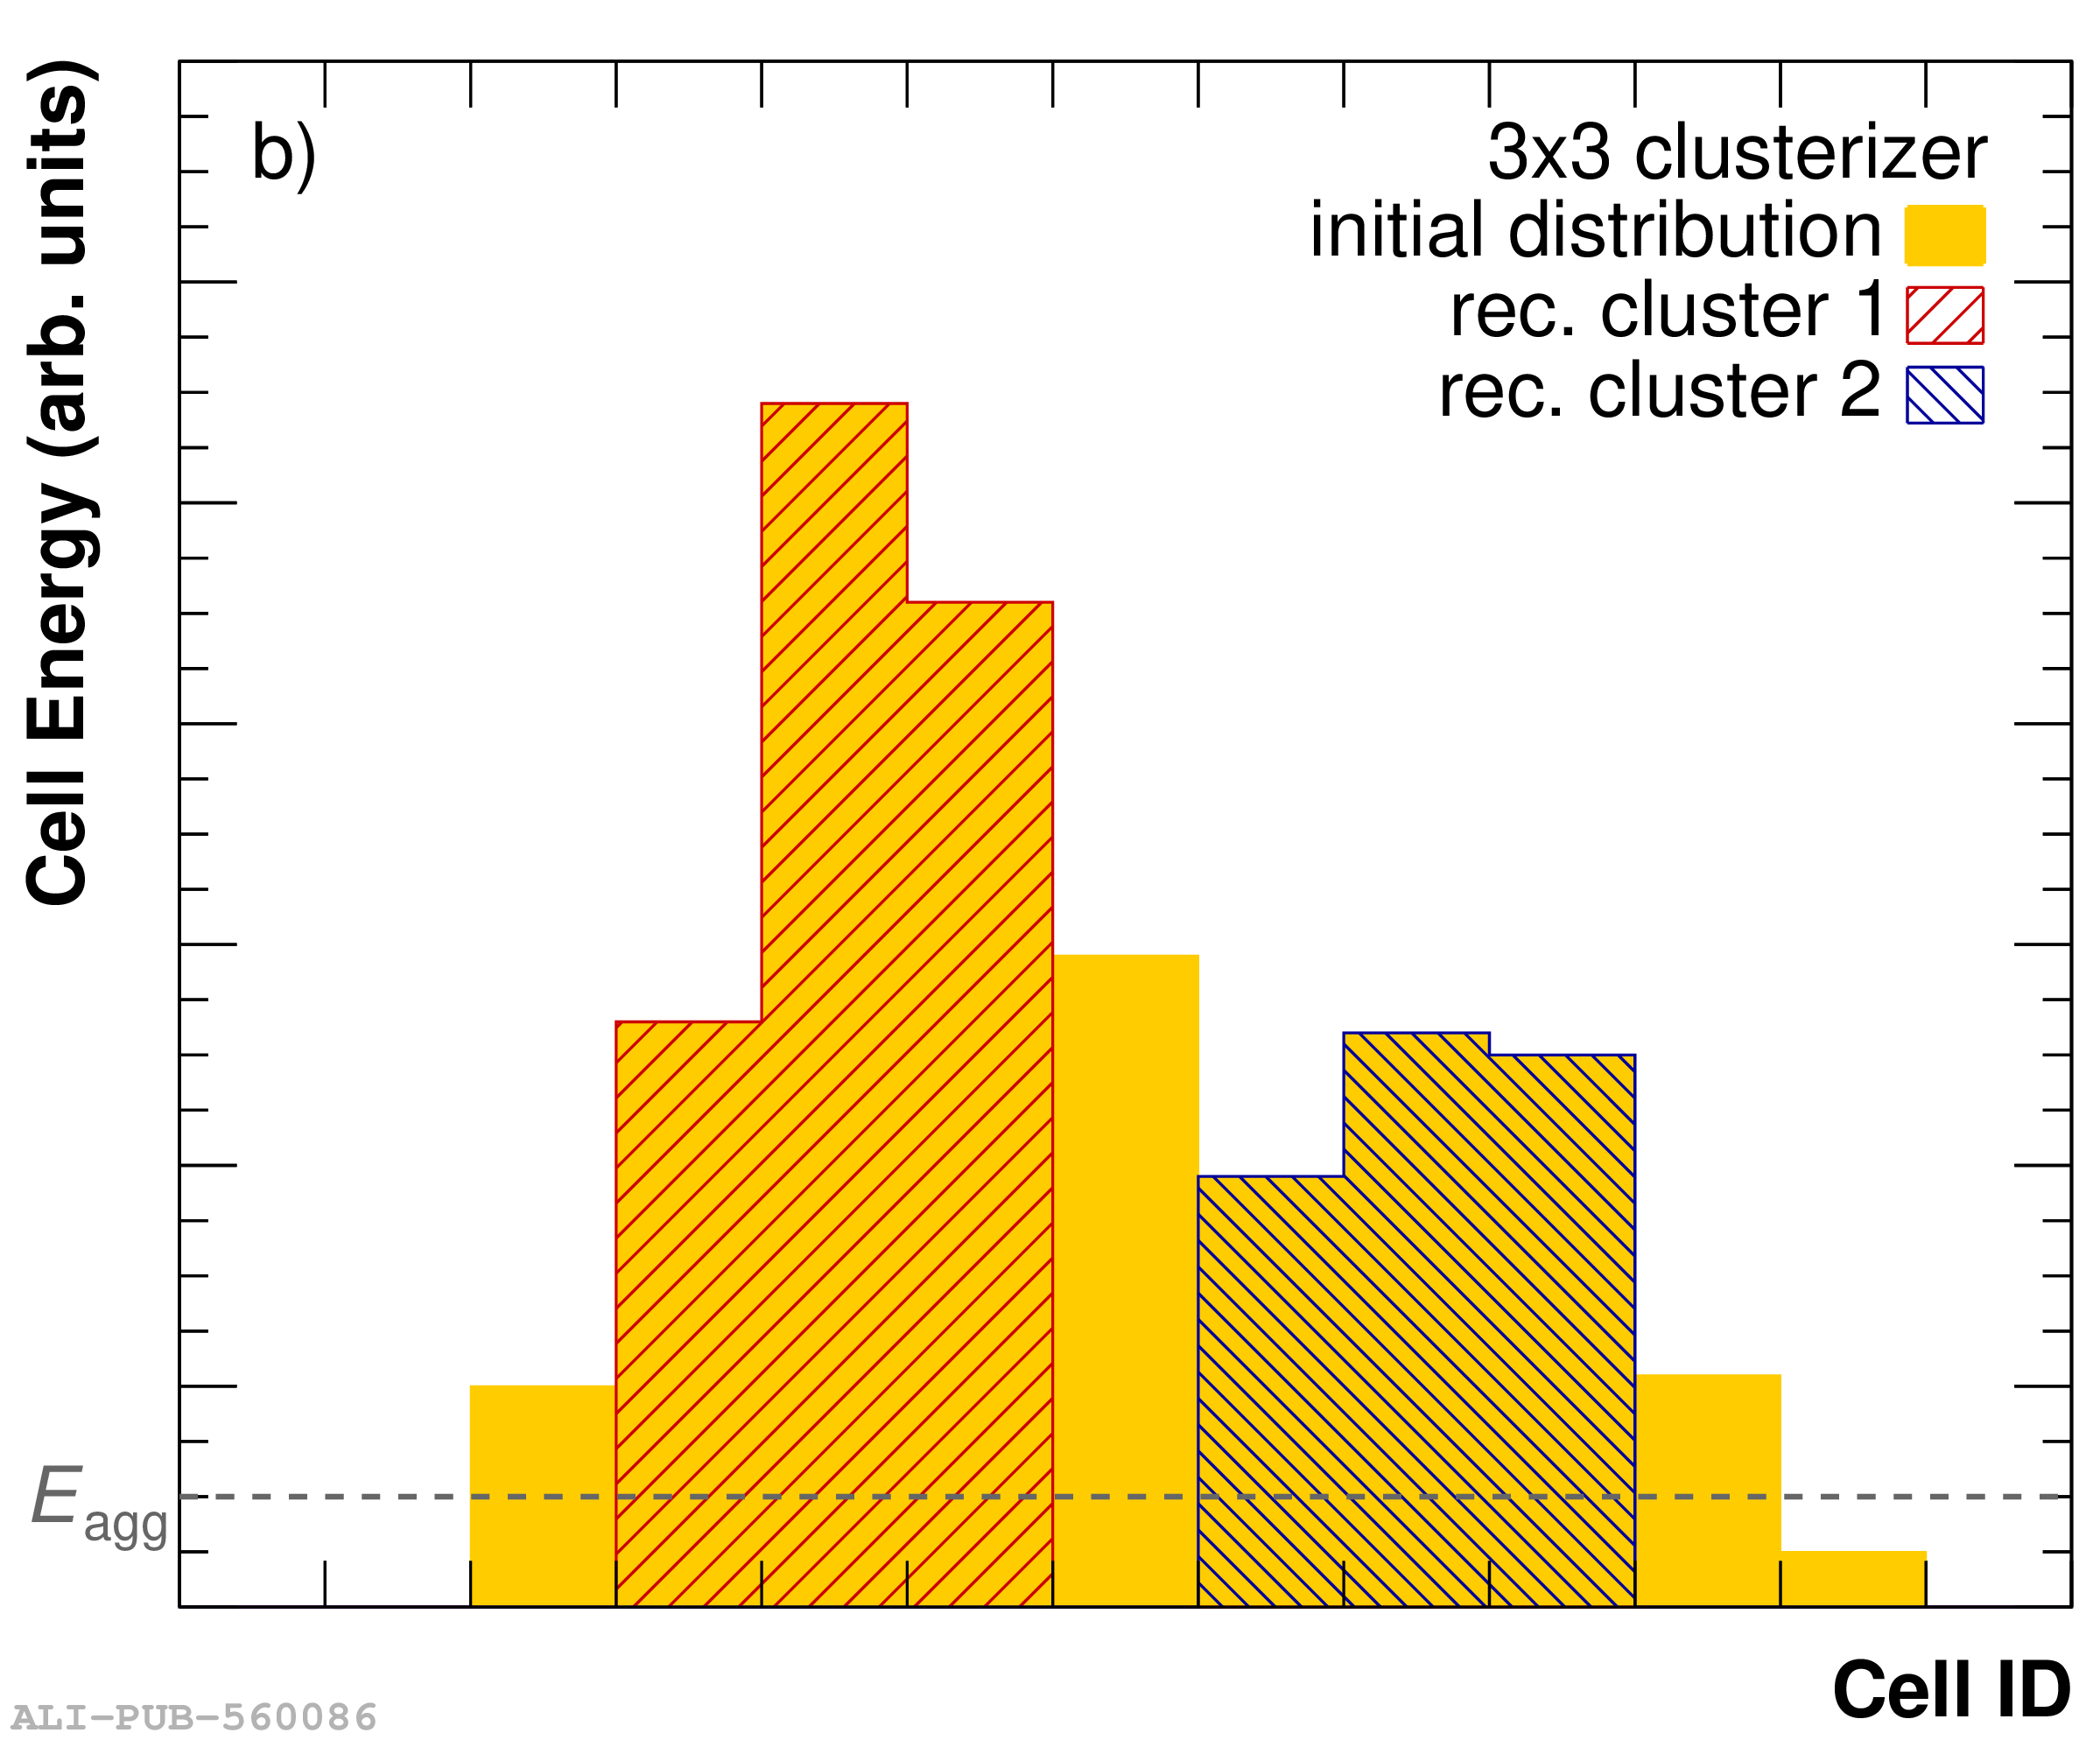 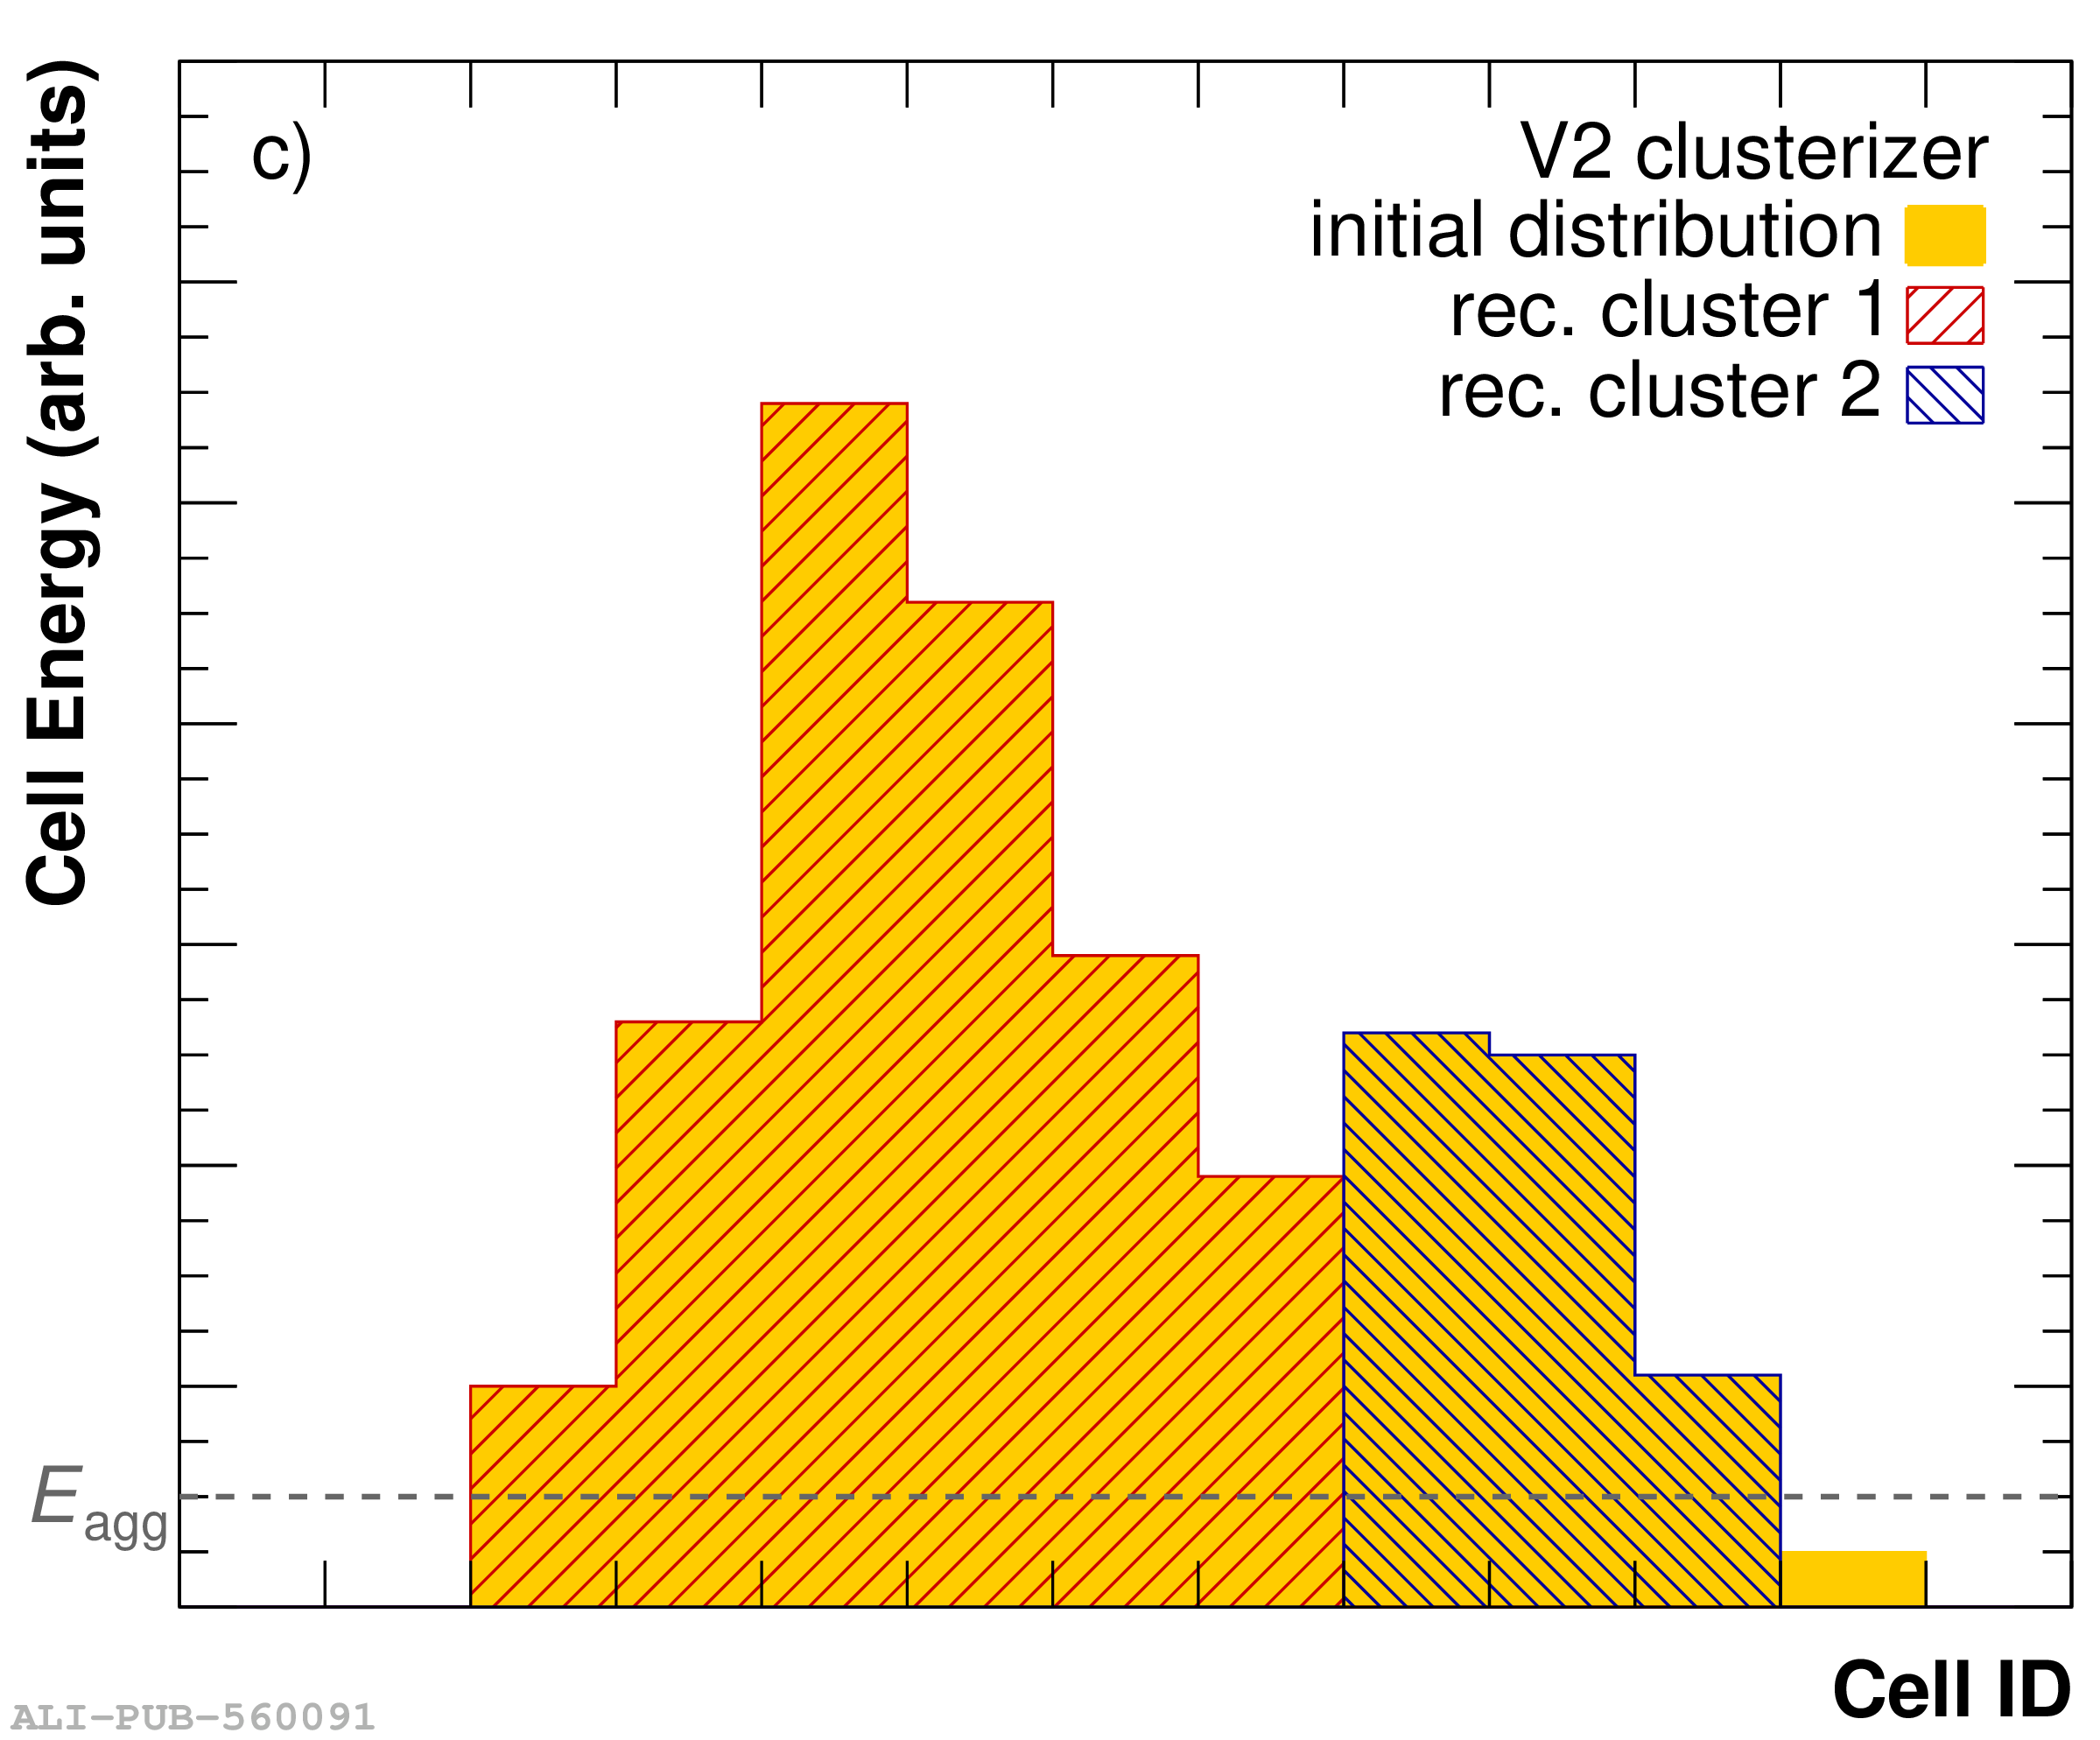 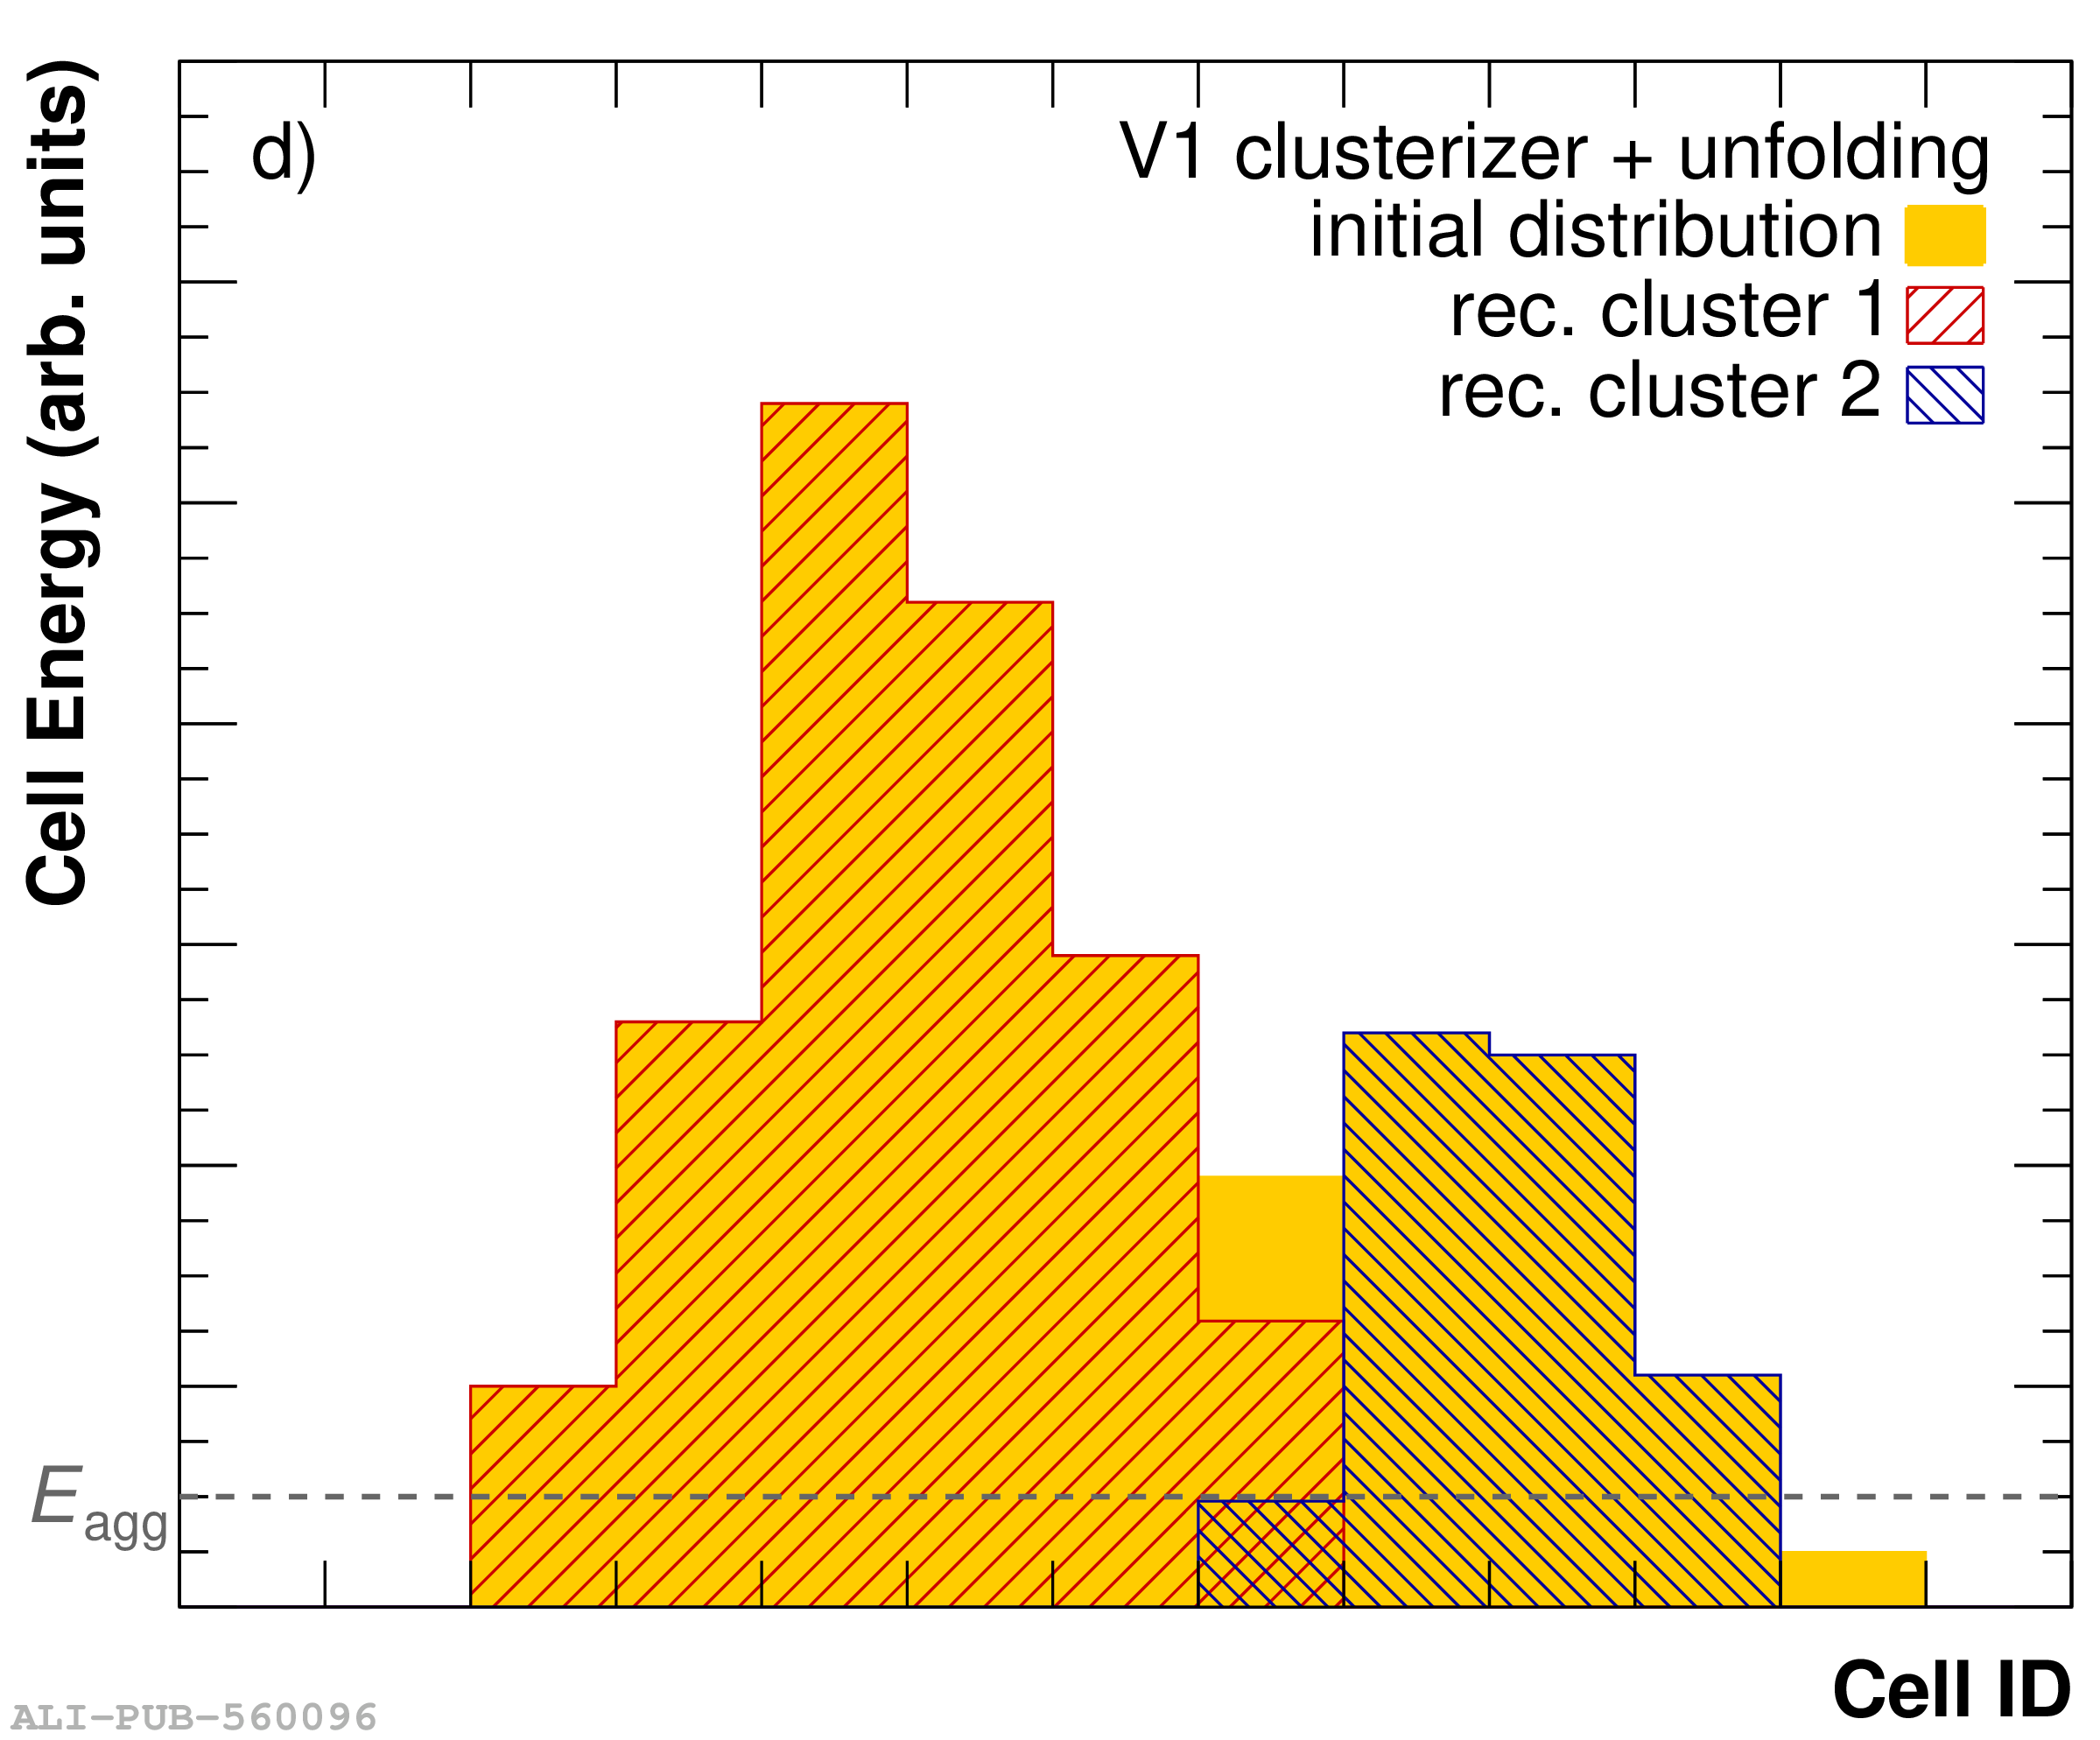 |