The integrated OS--SS near-side yields (top) and near-side RMS widths in $\Delta y$ (bottom) are shown for $\Xi\pi$ (left) and $\Xi\mathrm{K}$ (right) correlations as a function of multiplicity. Statistical and systematic uncertainties are represented by bars and boxes, respectively. The ALICE data are compared with the following models: \pythia{} 8 Monash tune (blue), \pythia{} 8 with junctions enabled (green), \pythia{} 8 with junctions and ropes (yellow), \eposlhc{} (red), and \herwig{} 7 (pink). | 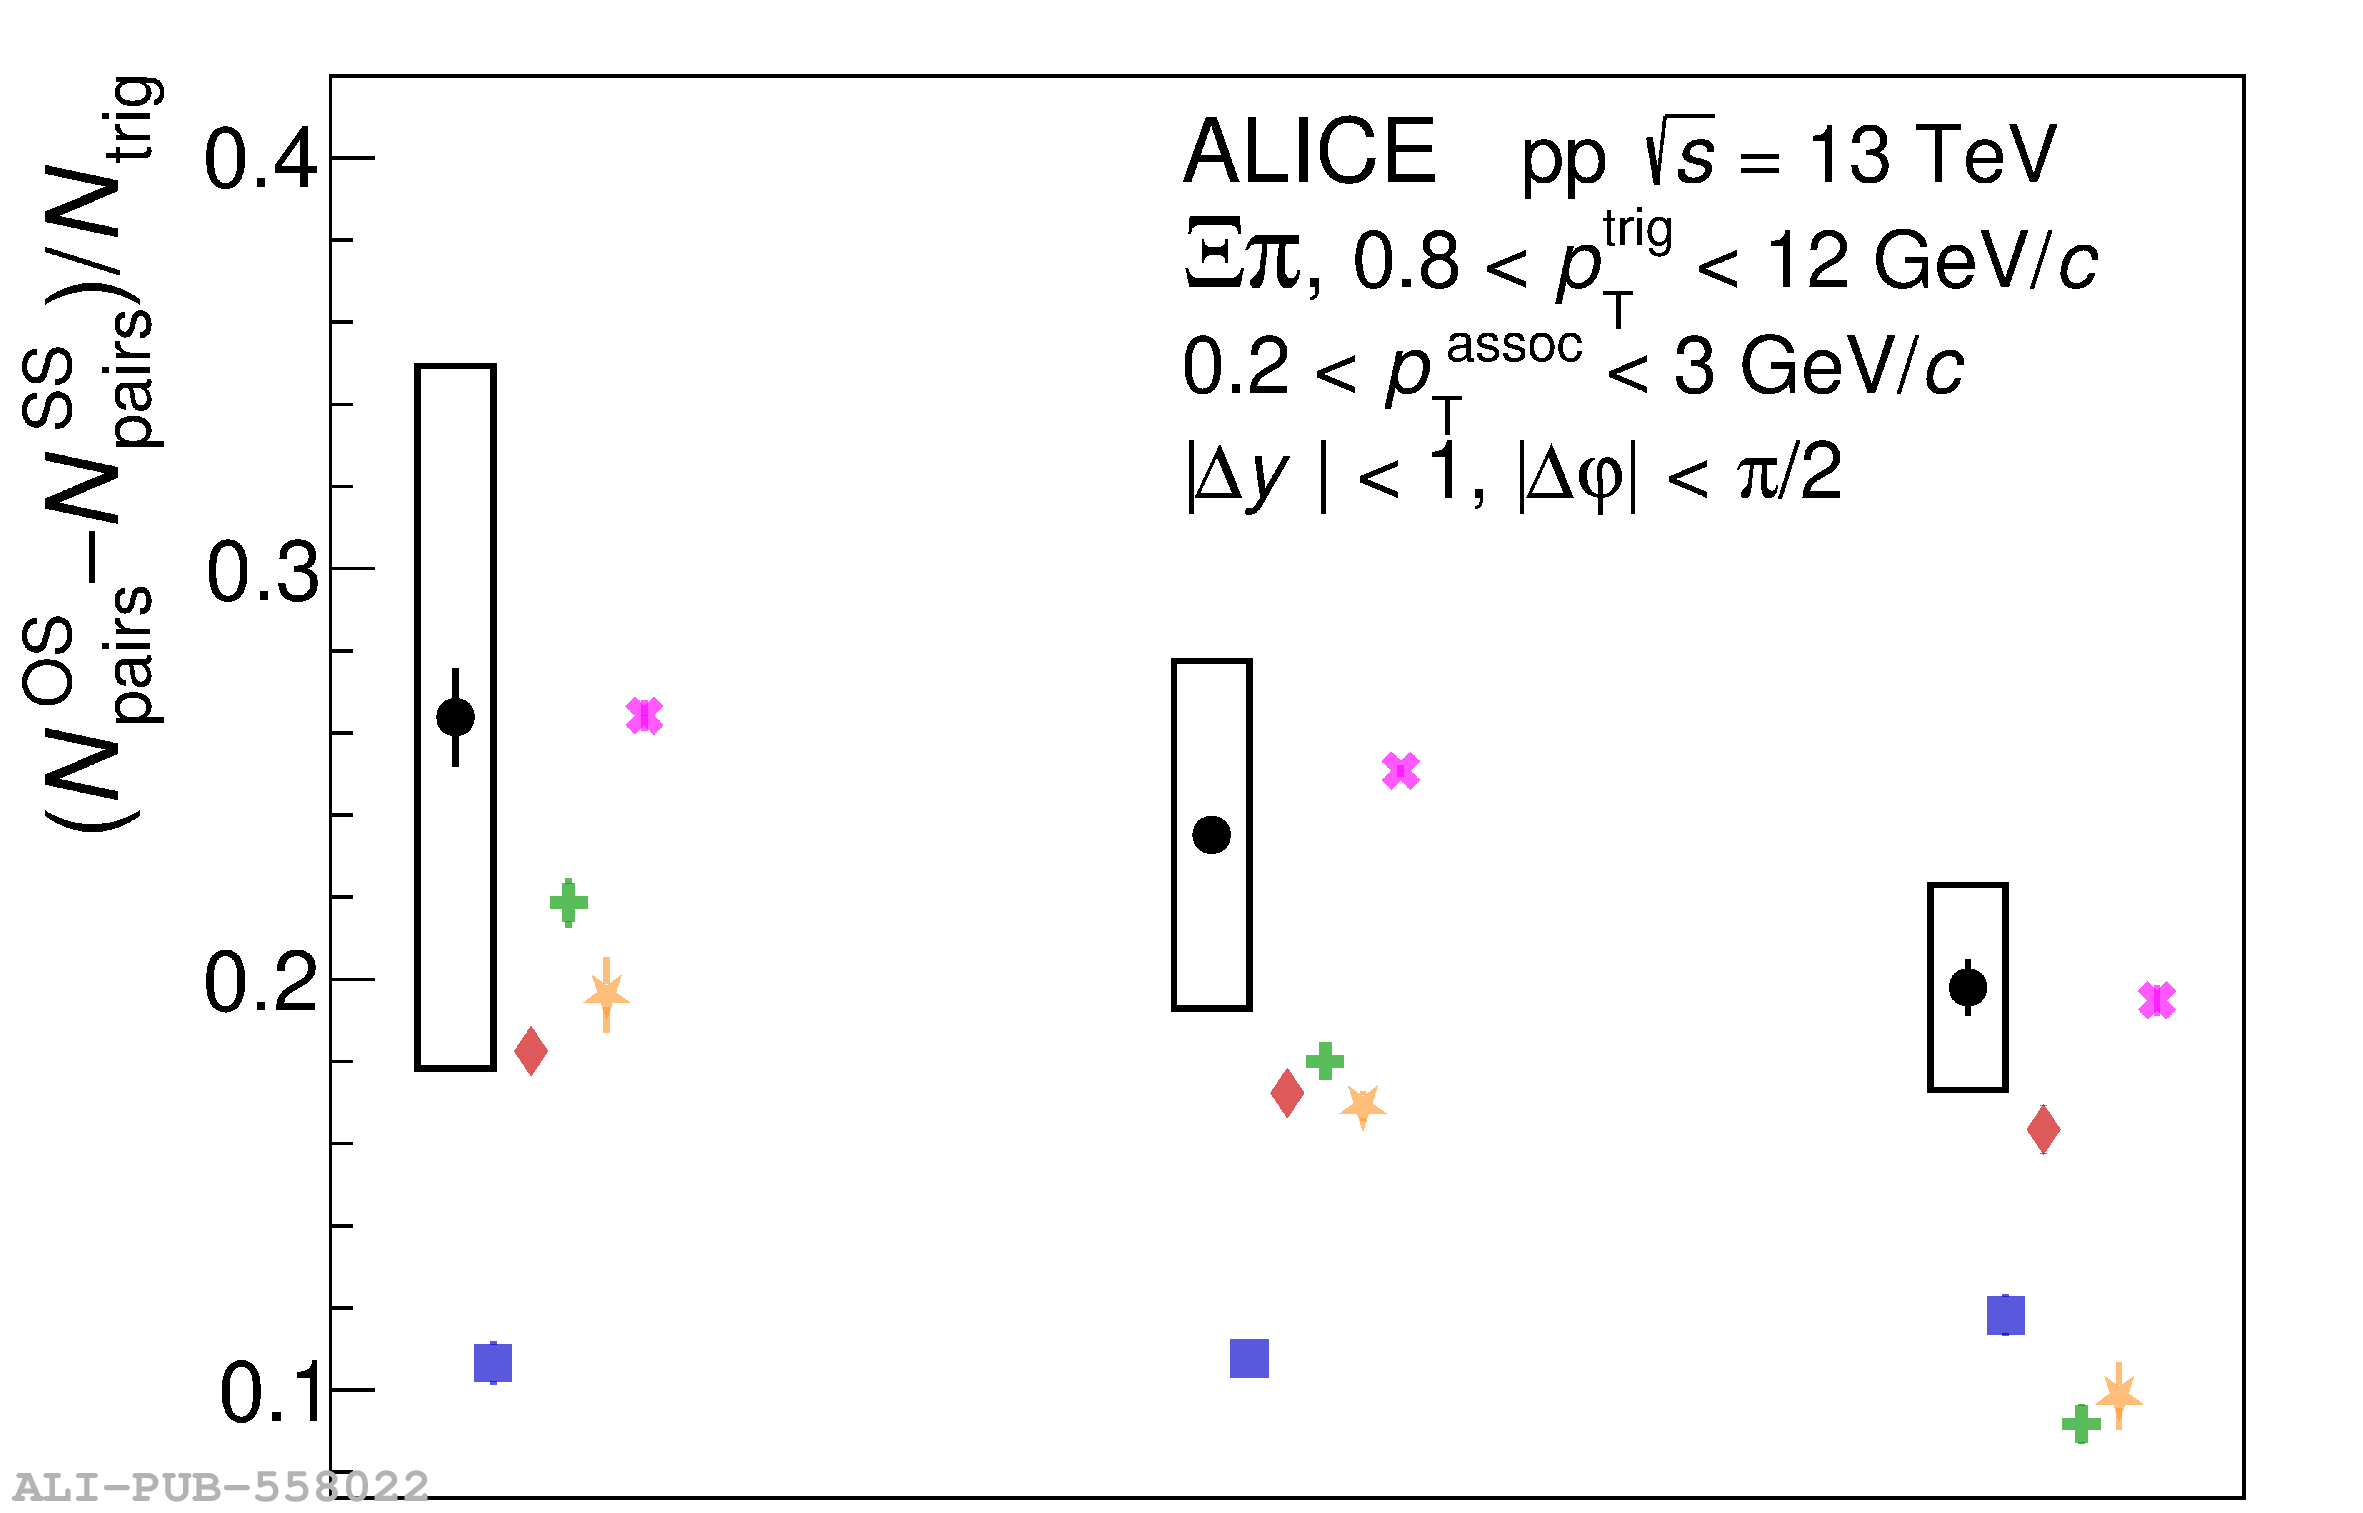 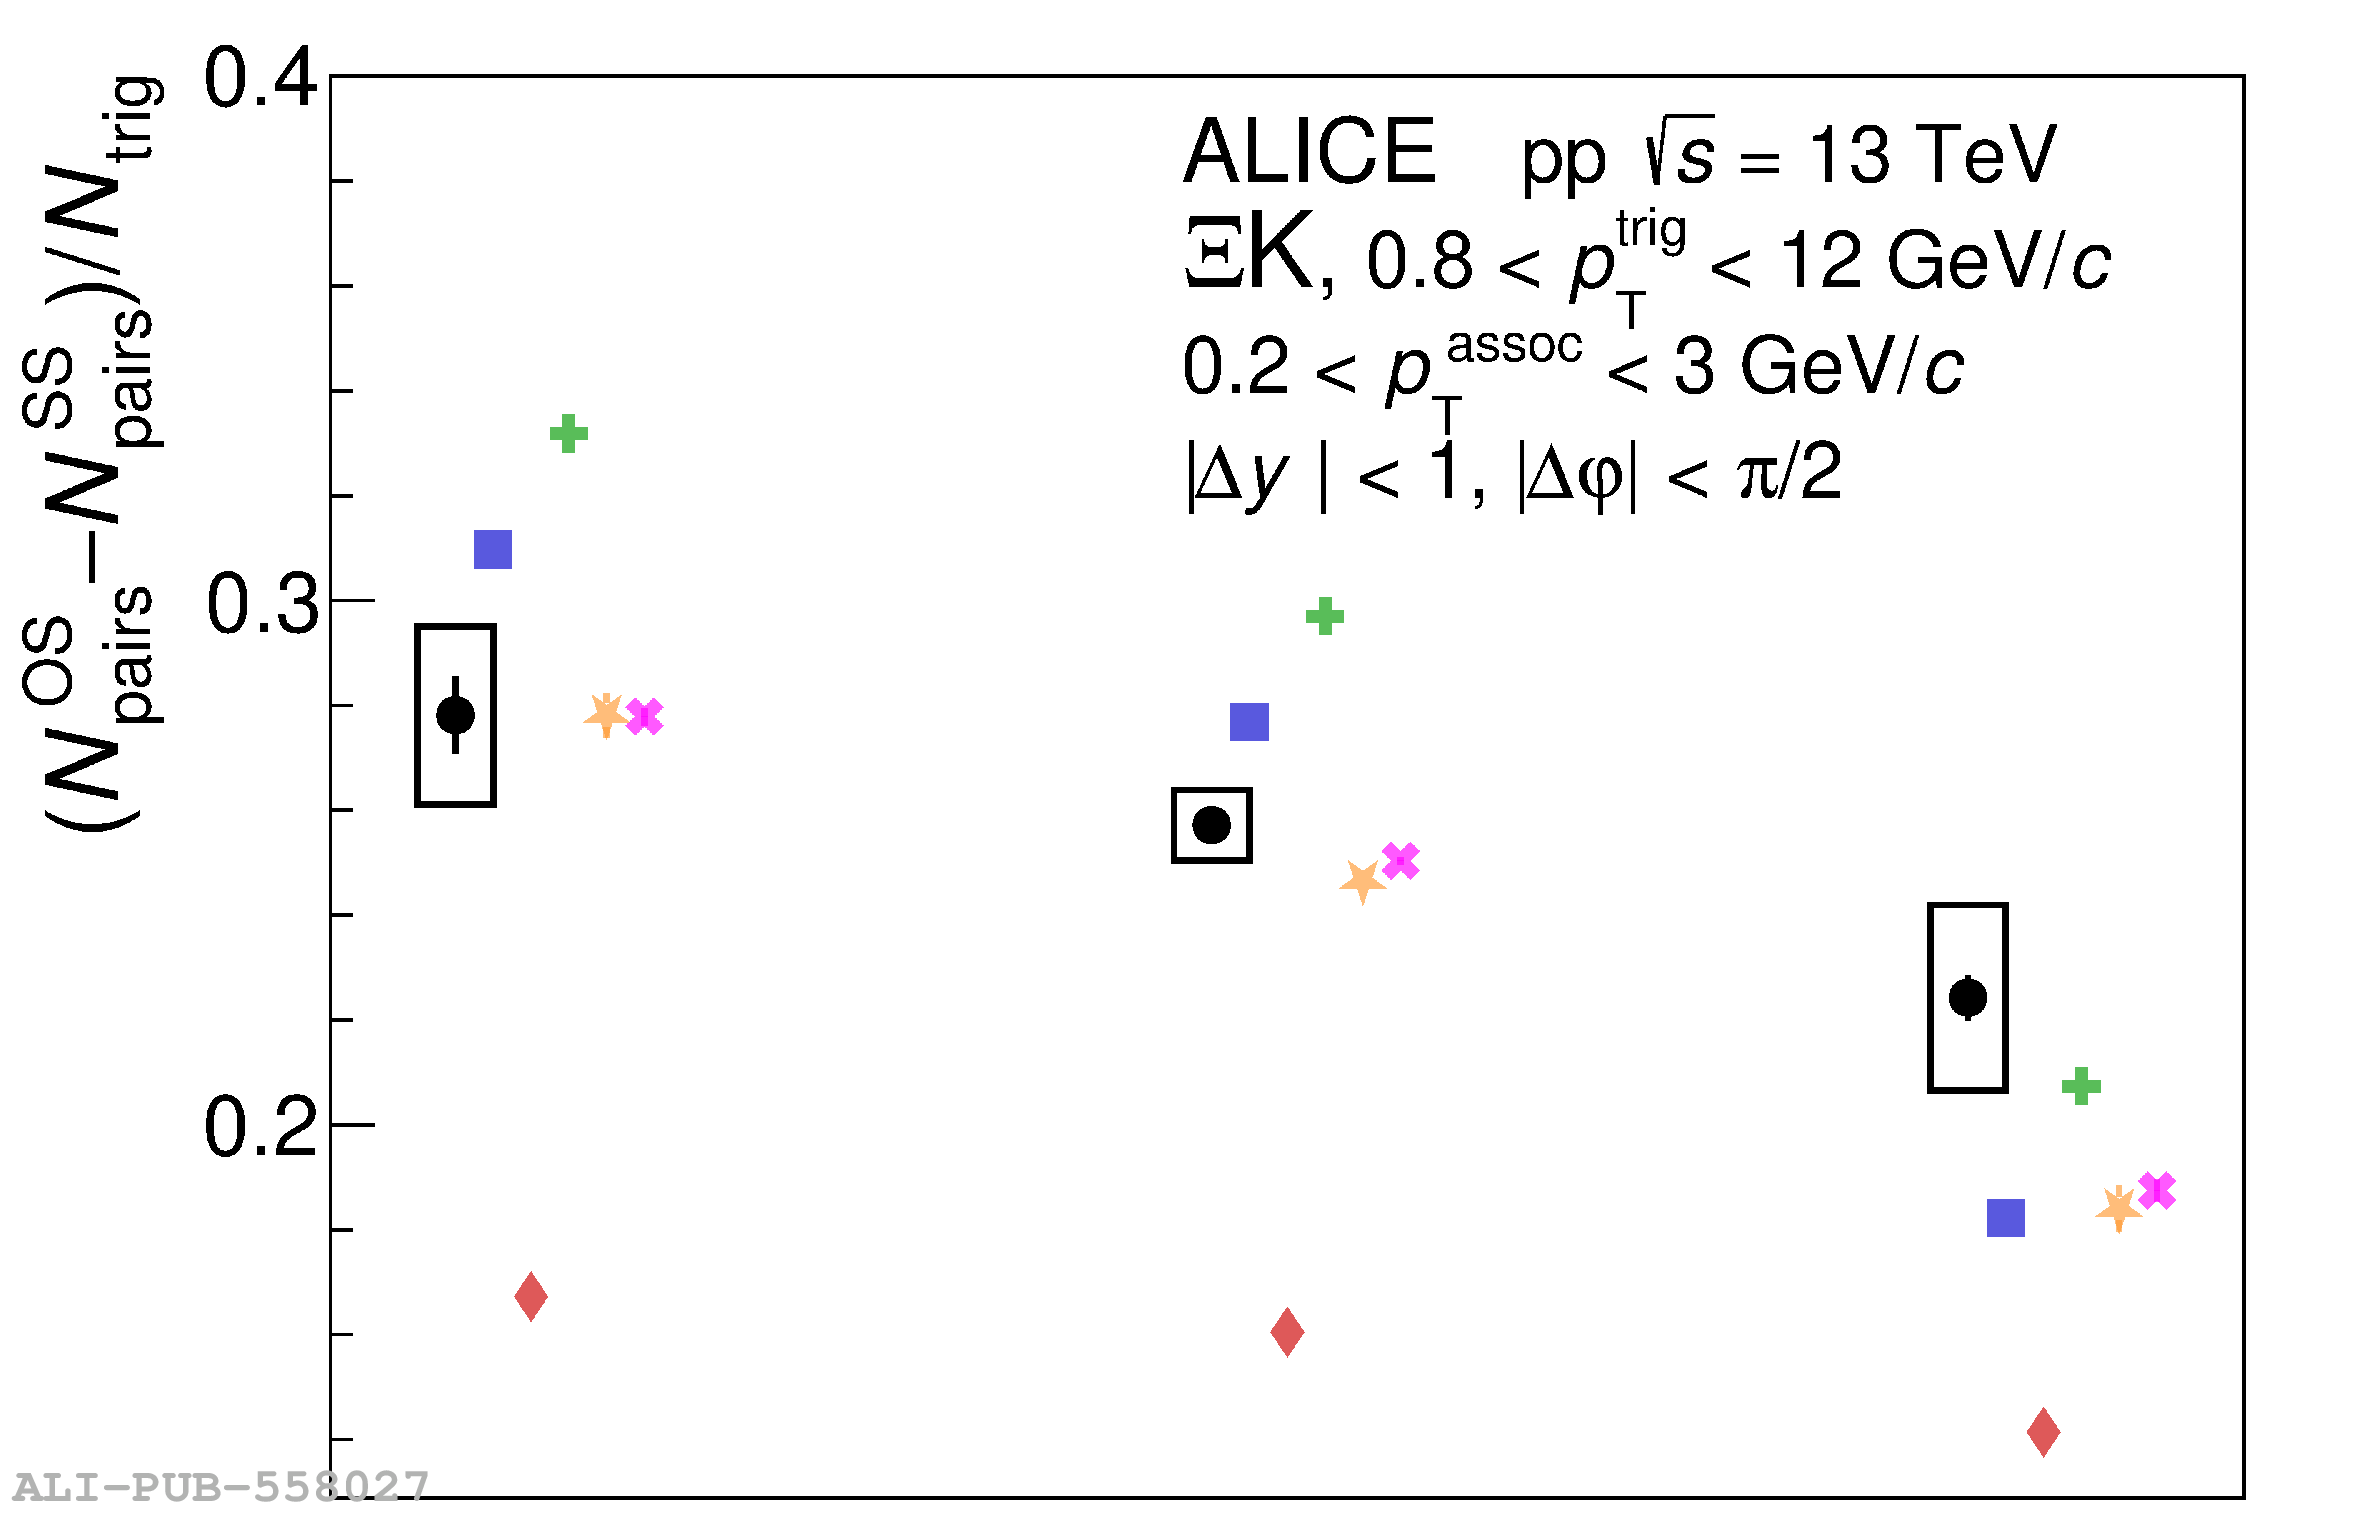 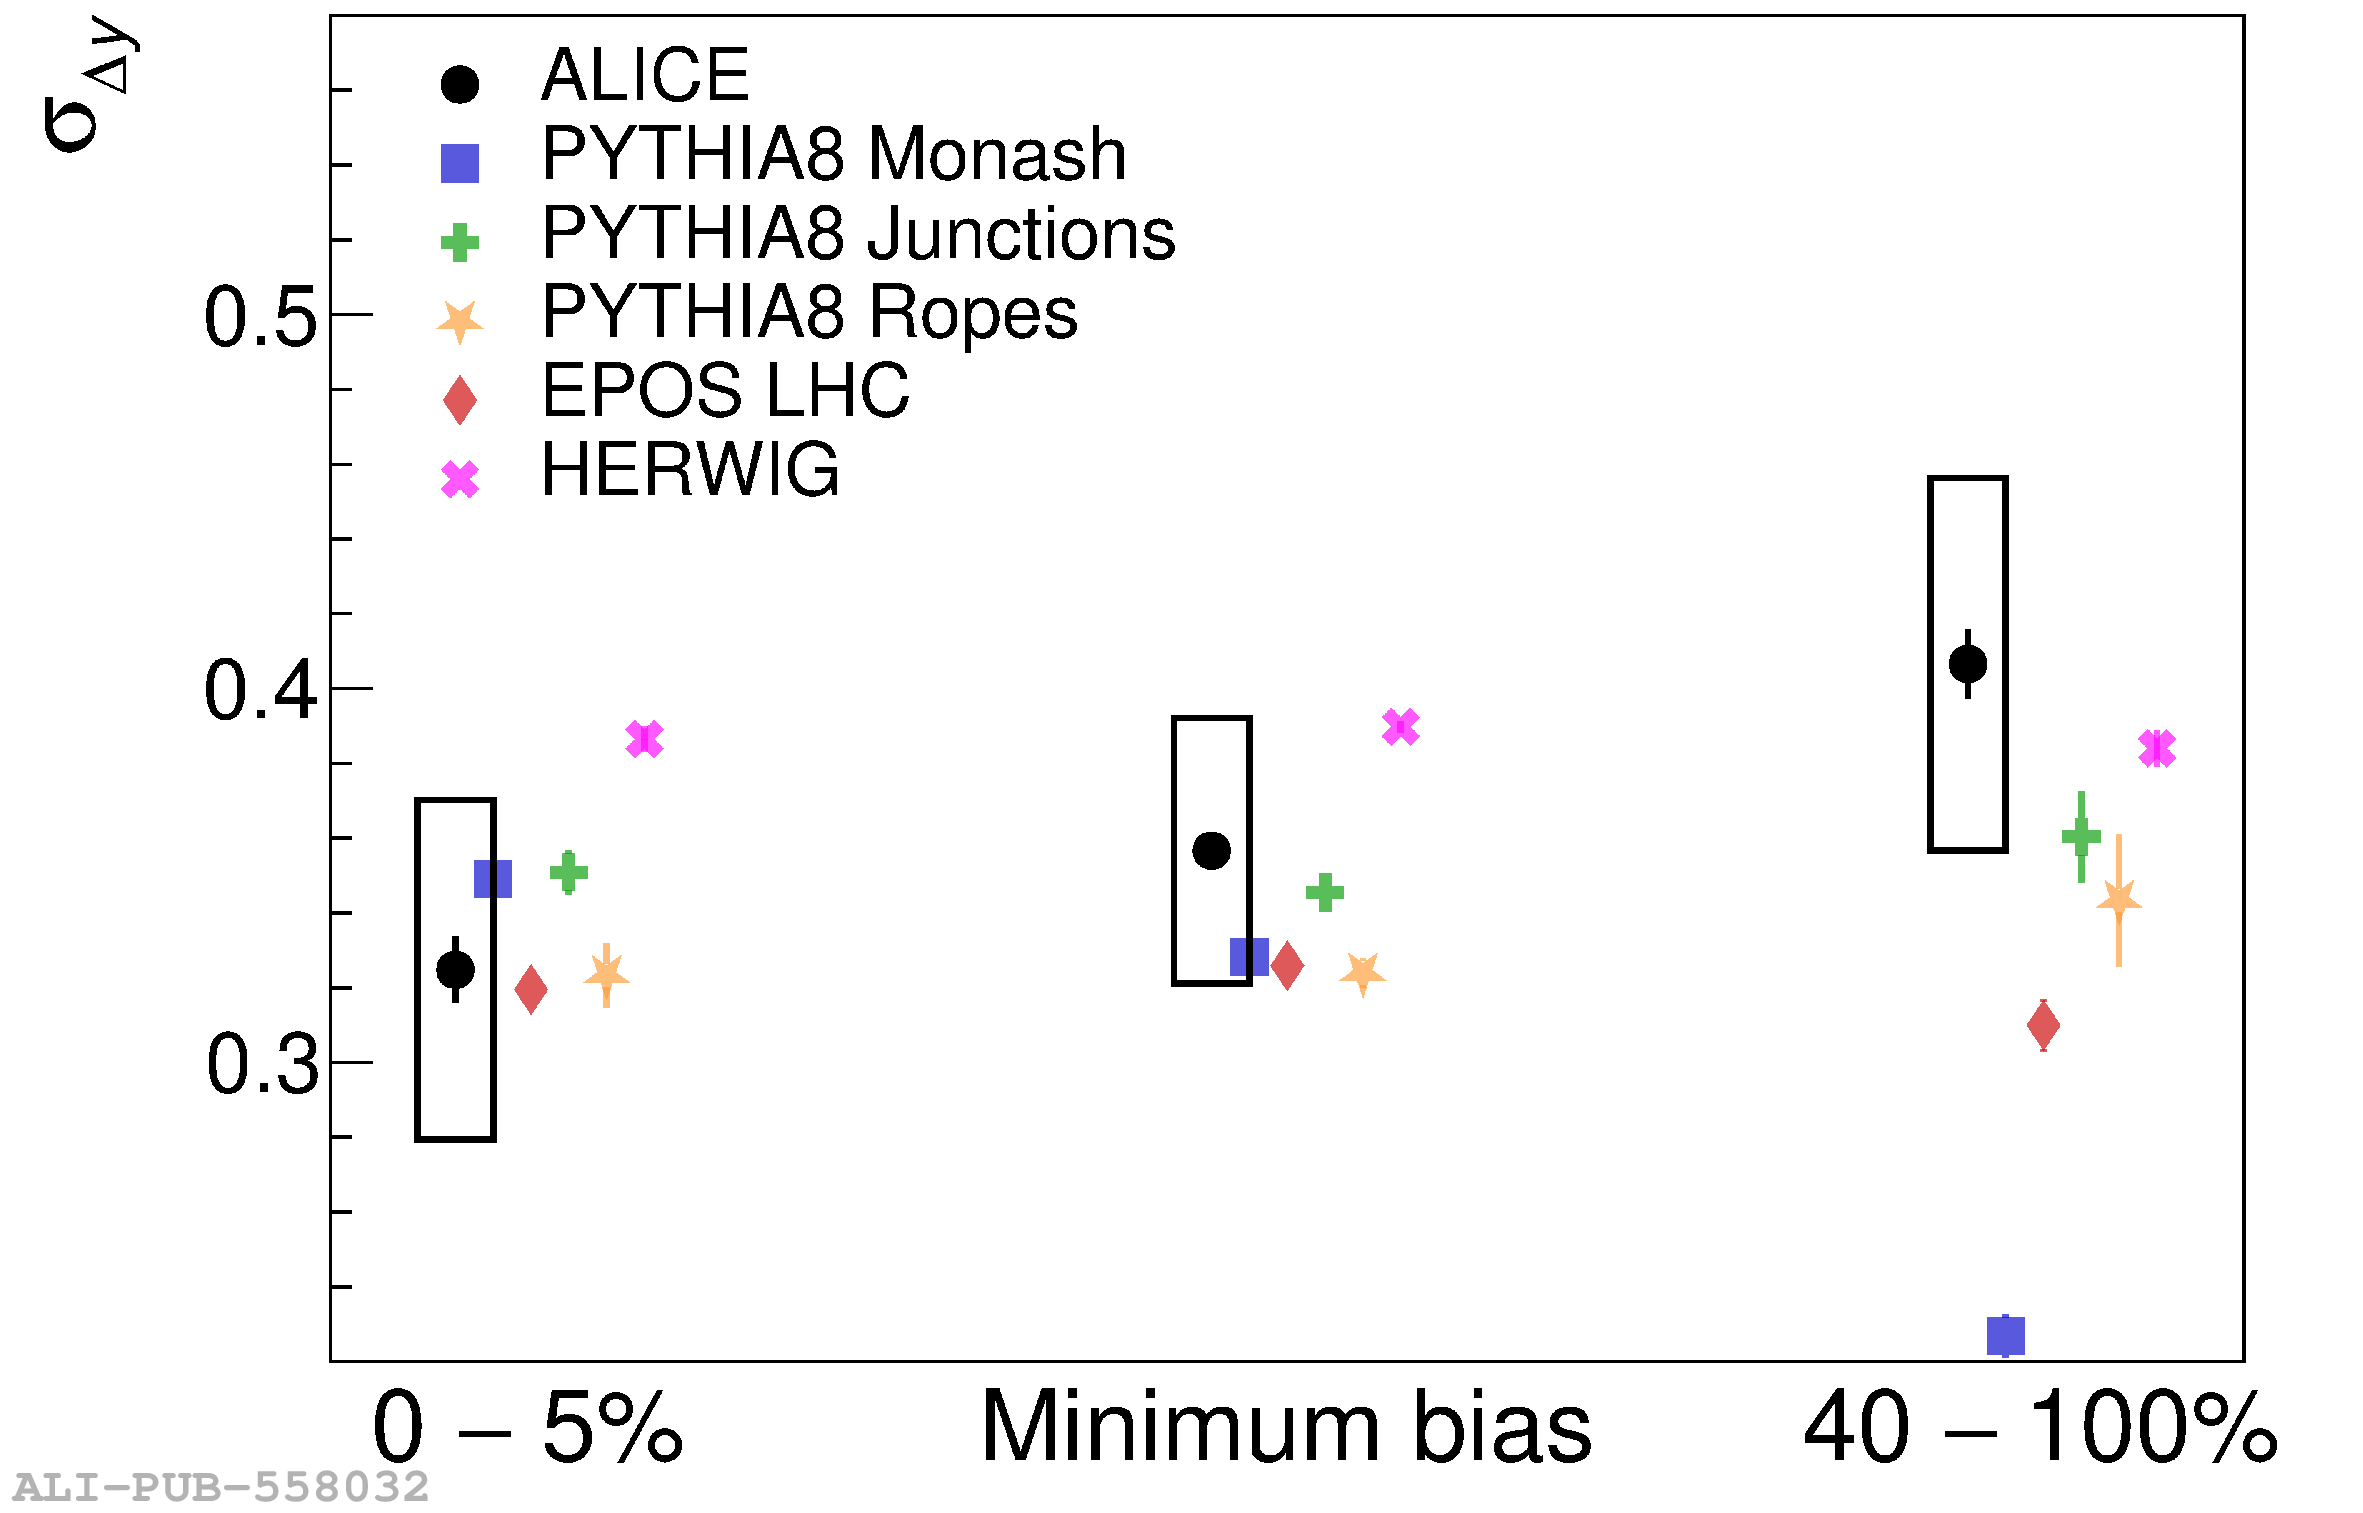 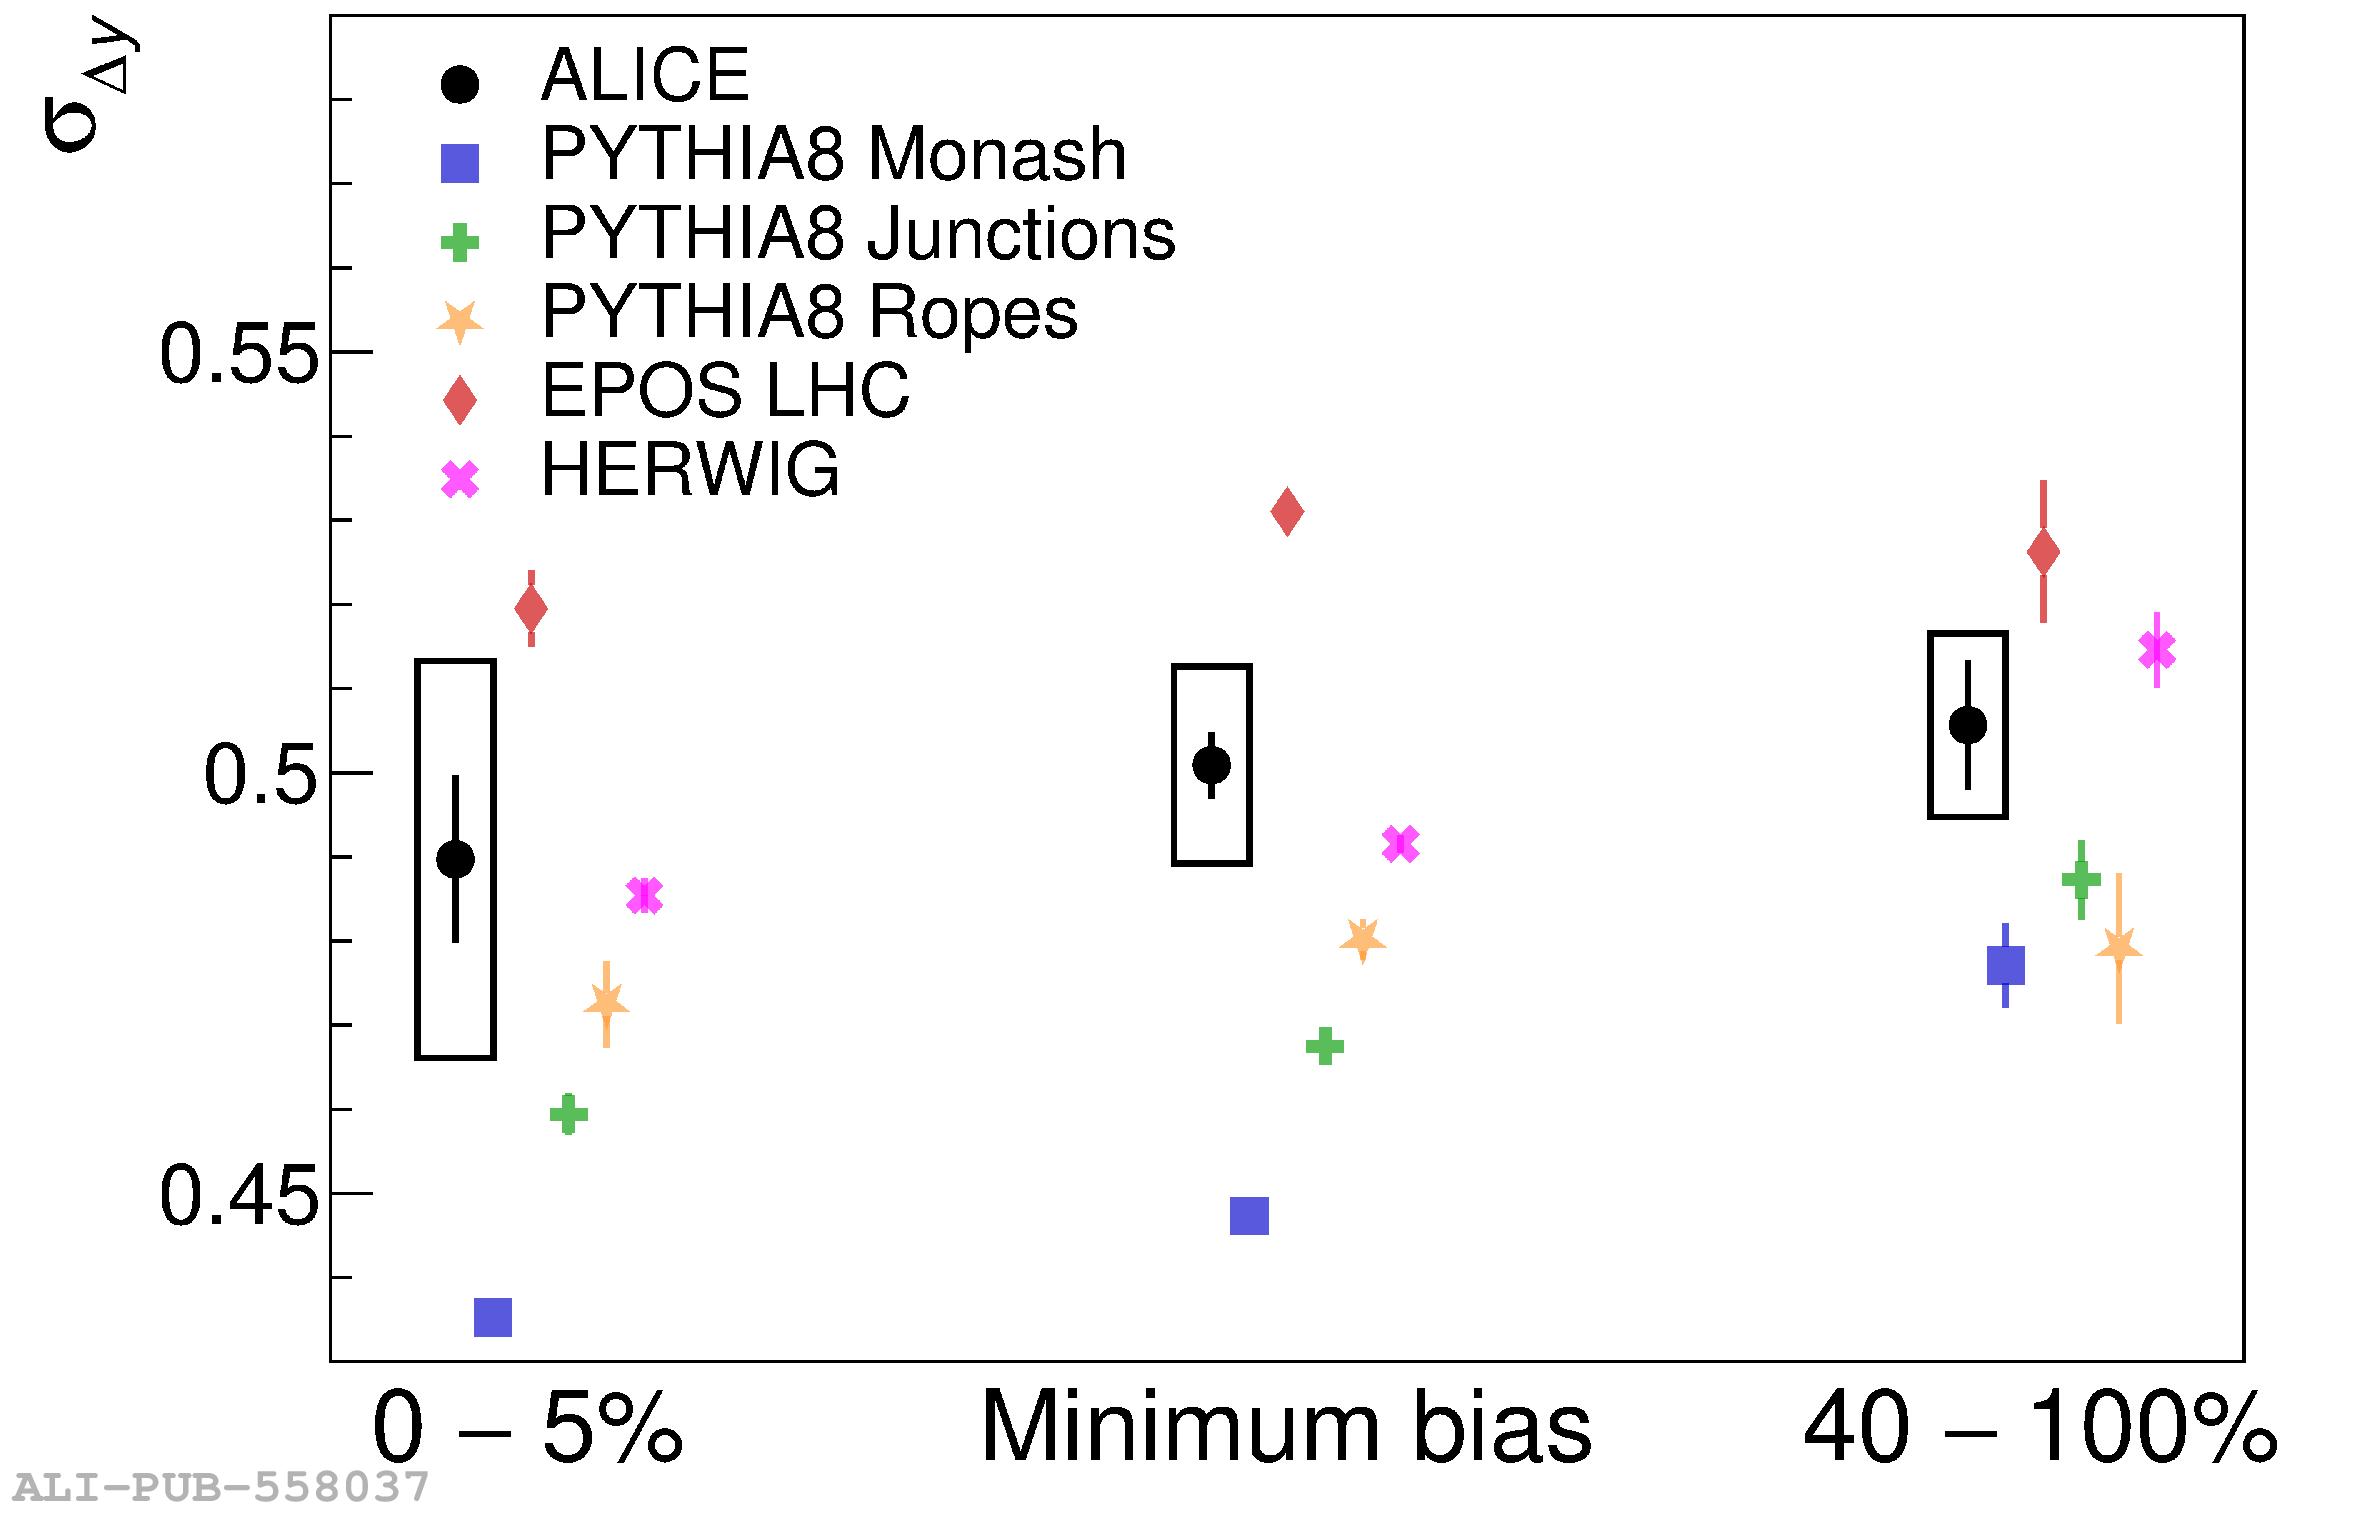 |