The $\Xi\pi$ (top left), $\Xi$K (top centre), $\Xi$p (bottom left), $\Xi\Lambda$ (bottom centre), and $\Xi\Xi$ (bottom right) correlation functions are shown for minimum bias (black), high-multiplicity ($0-5\%$, red), and low-multiplicity ($40-100\%$, blue) events, projected onto $\Delta\varphi$ ($|\Delta y| < 1$). In the top panels, opposite-sign correlations are shown in light markers, the same-sign correlations are shown with darker markers. In the bottom panels, the OS--SS or OB--SB difference is shown in each multiplicity interval. Statistical and systematic uncertainties are represented by bars and boxes, respectively. | 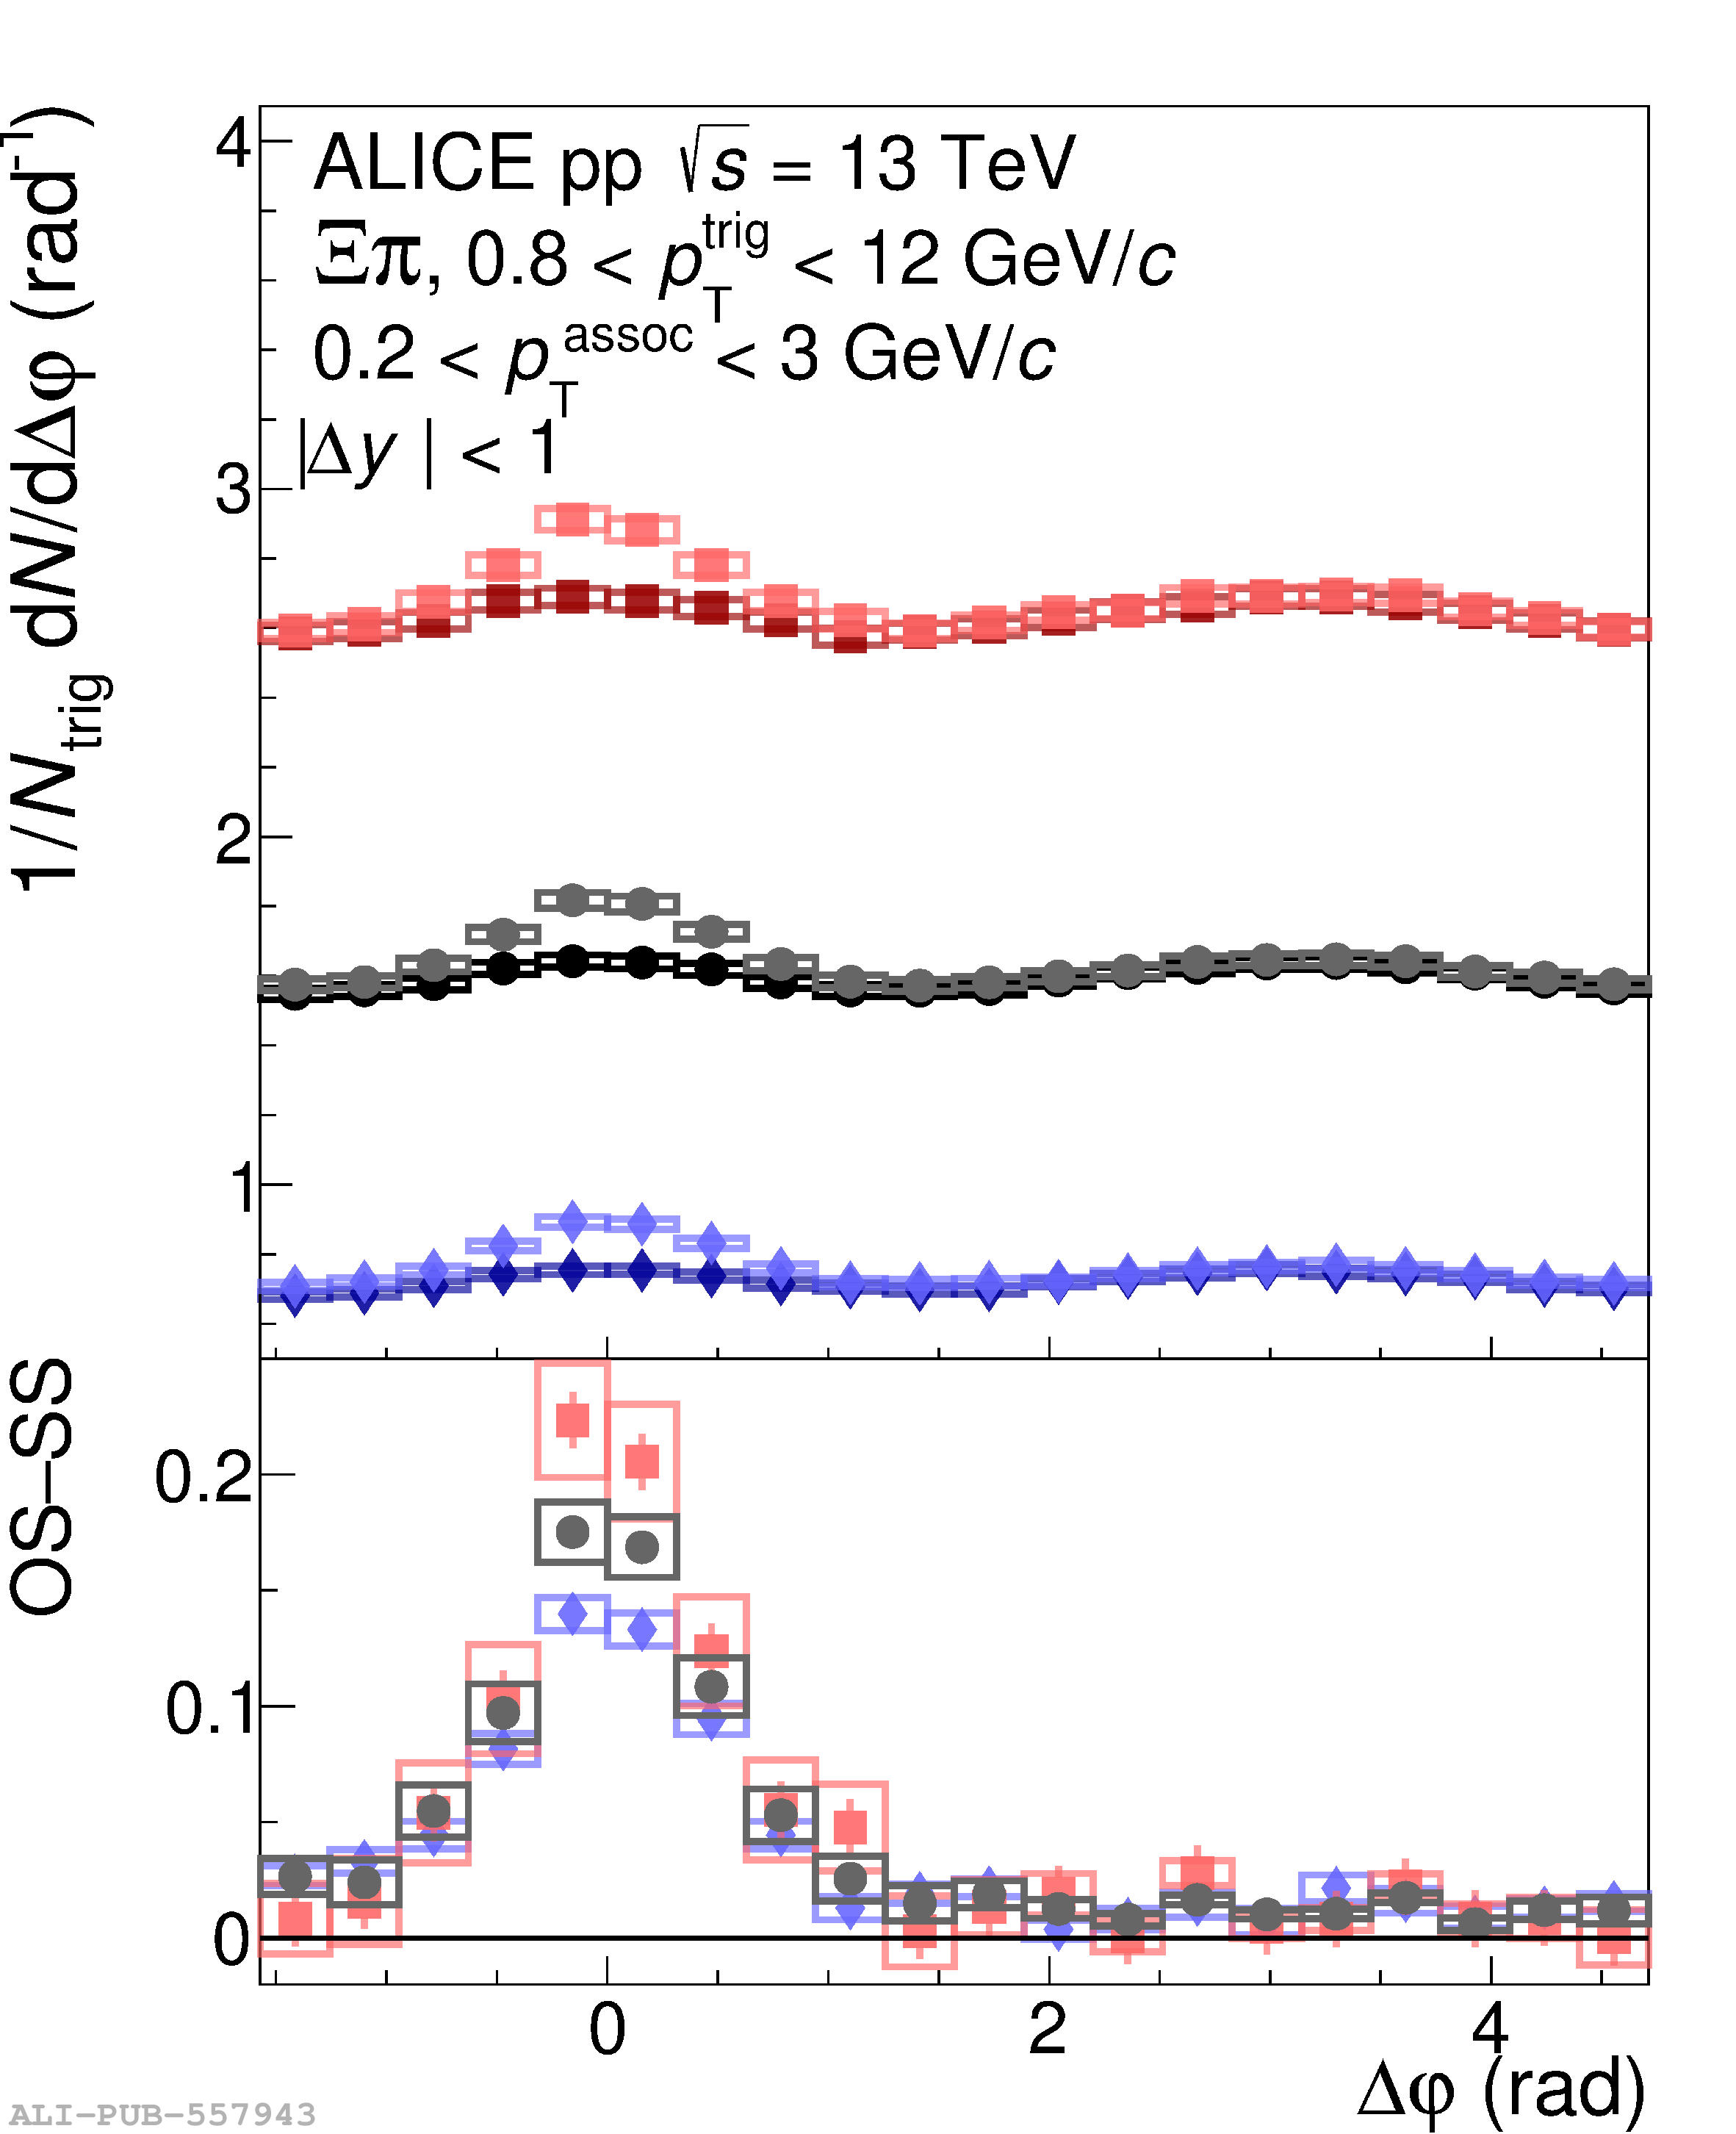 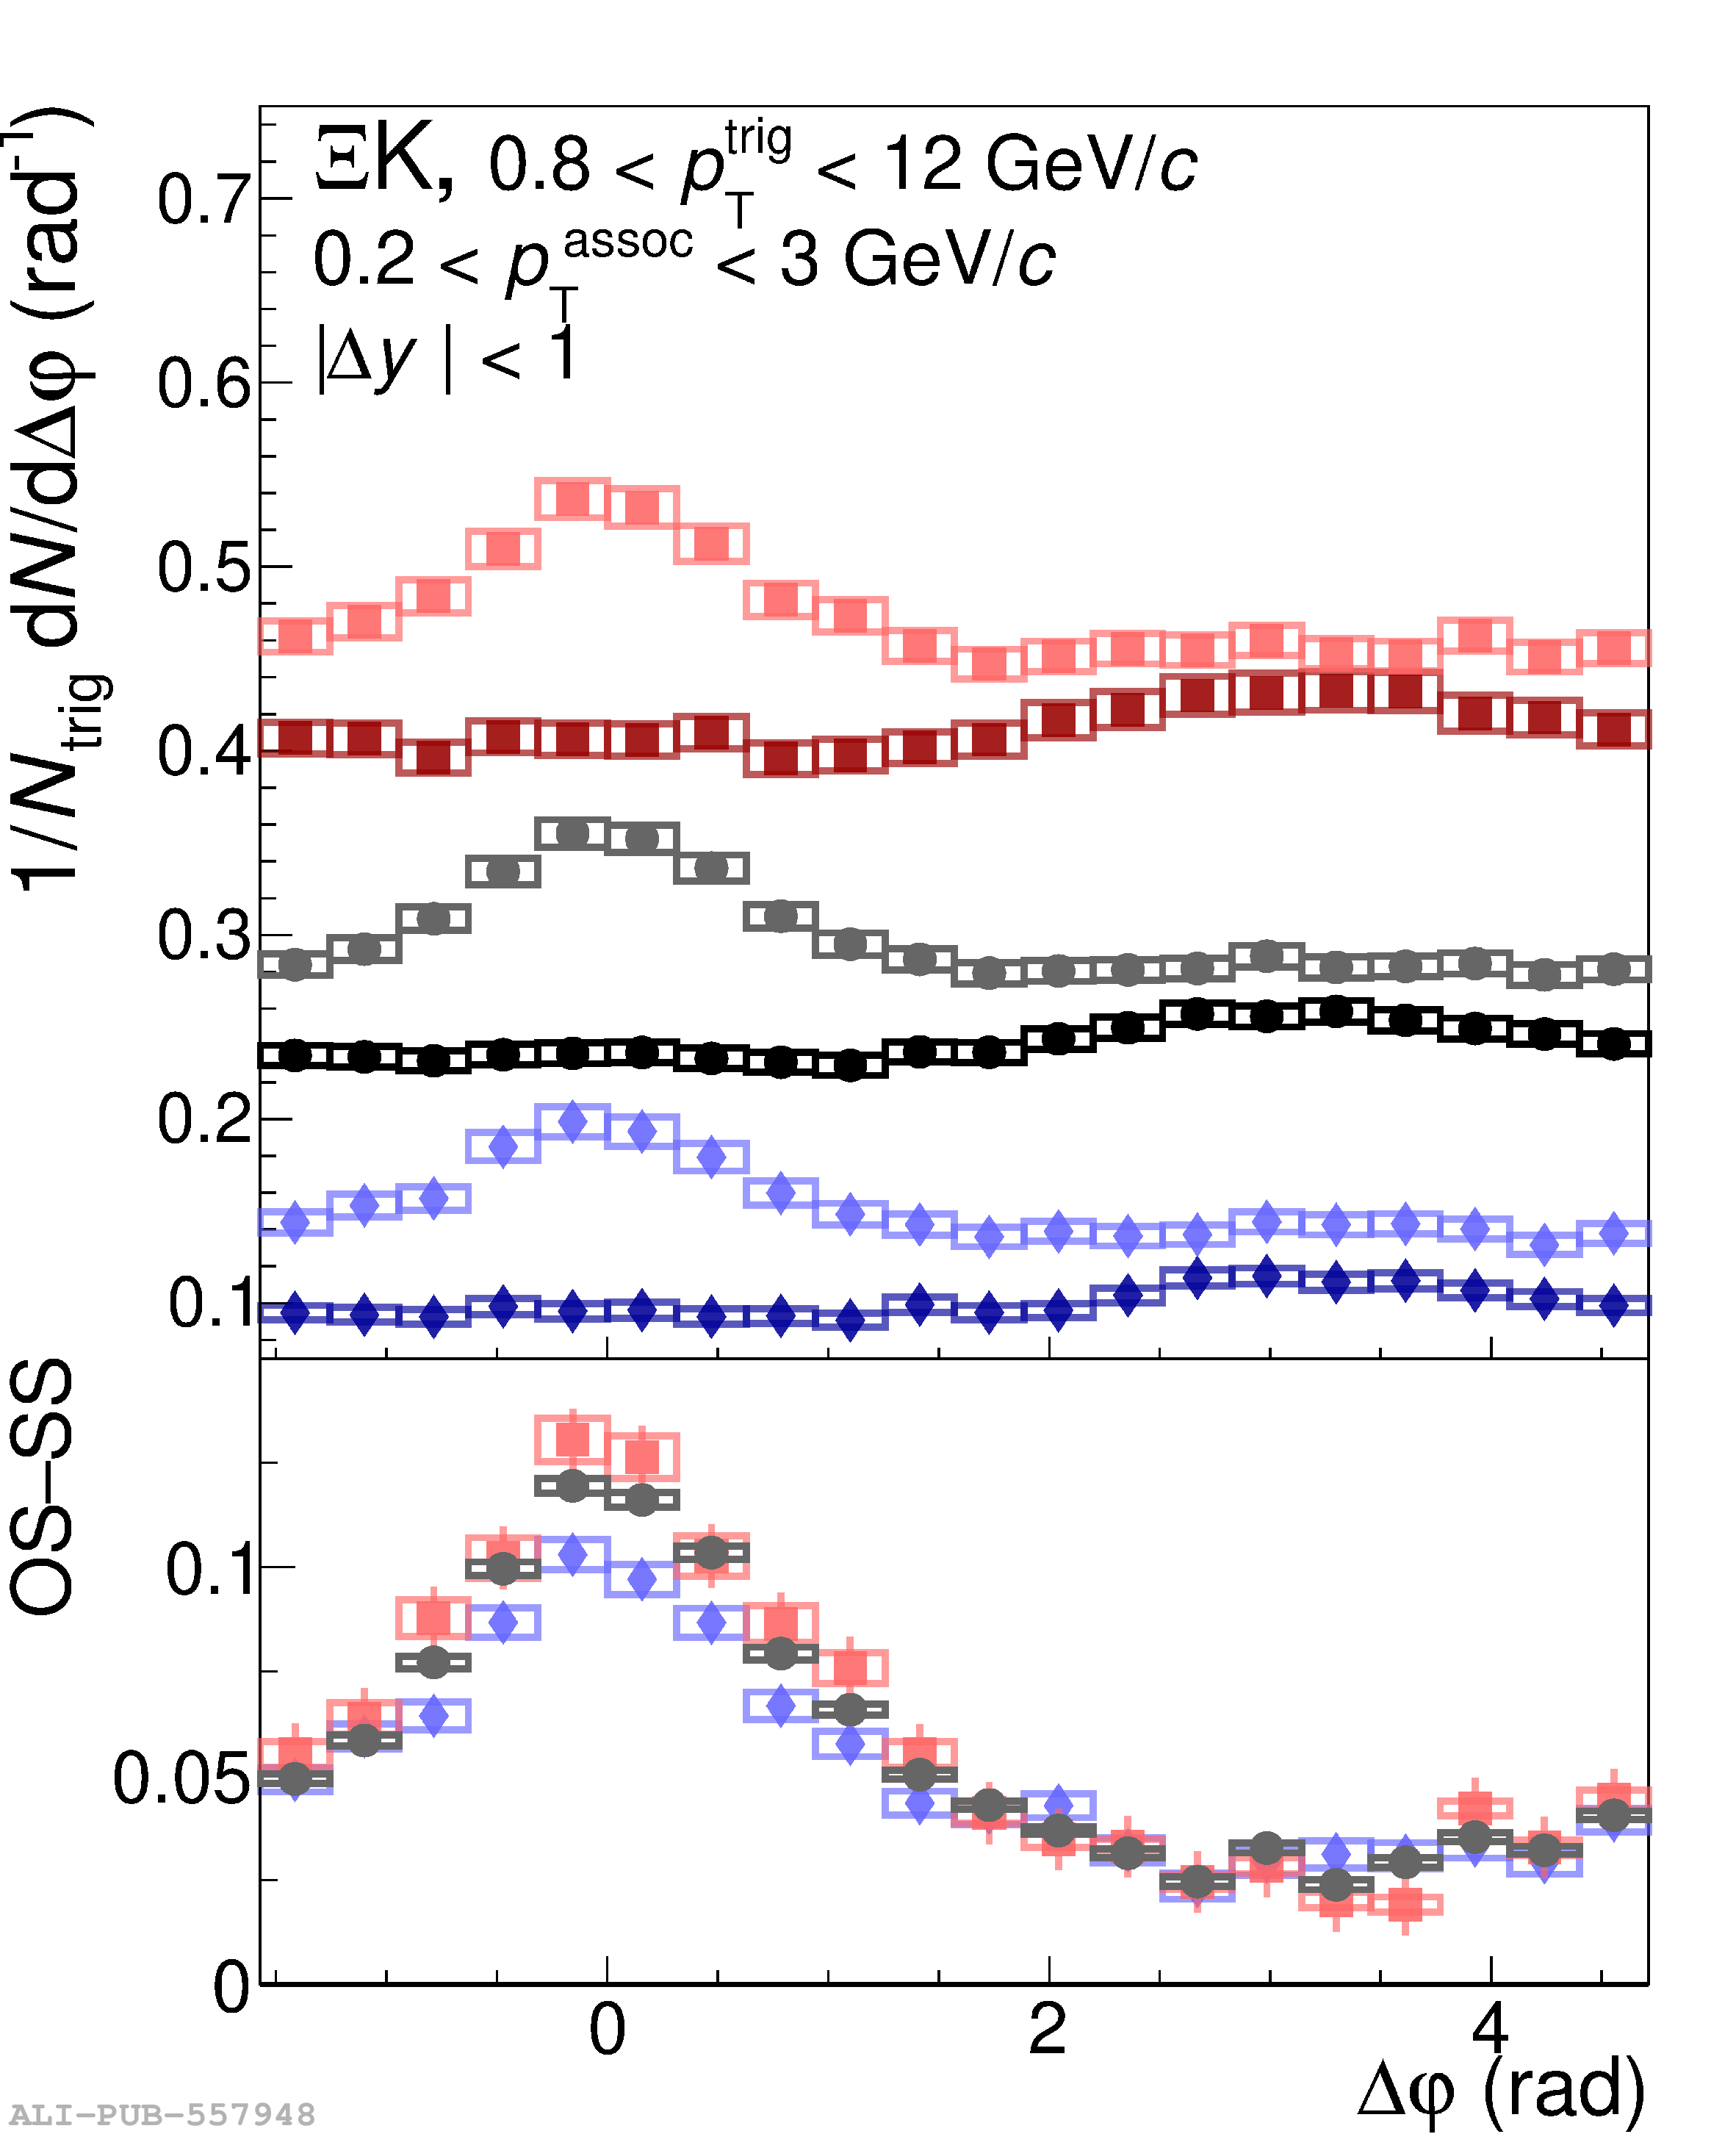  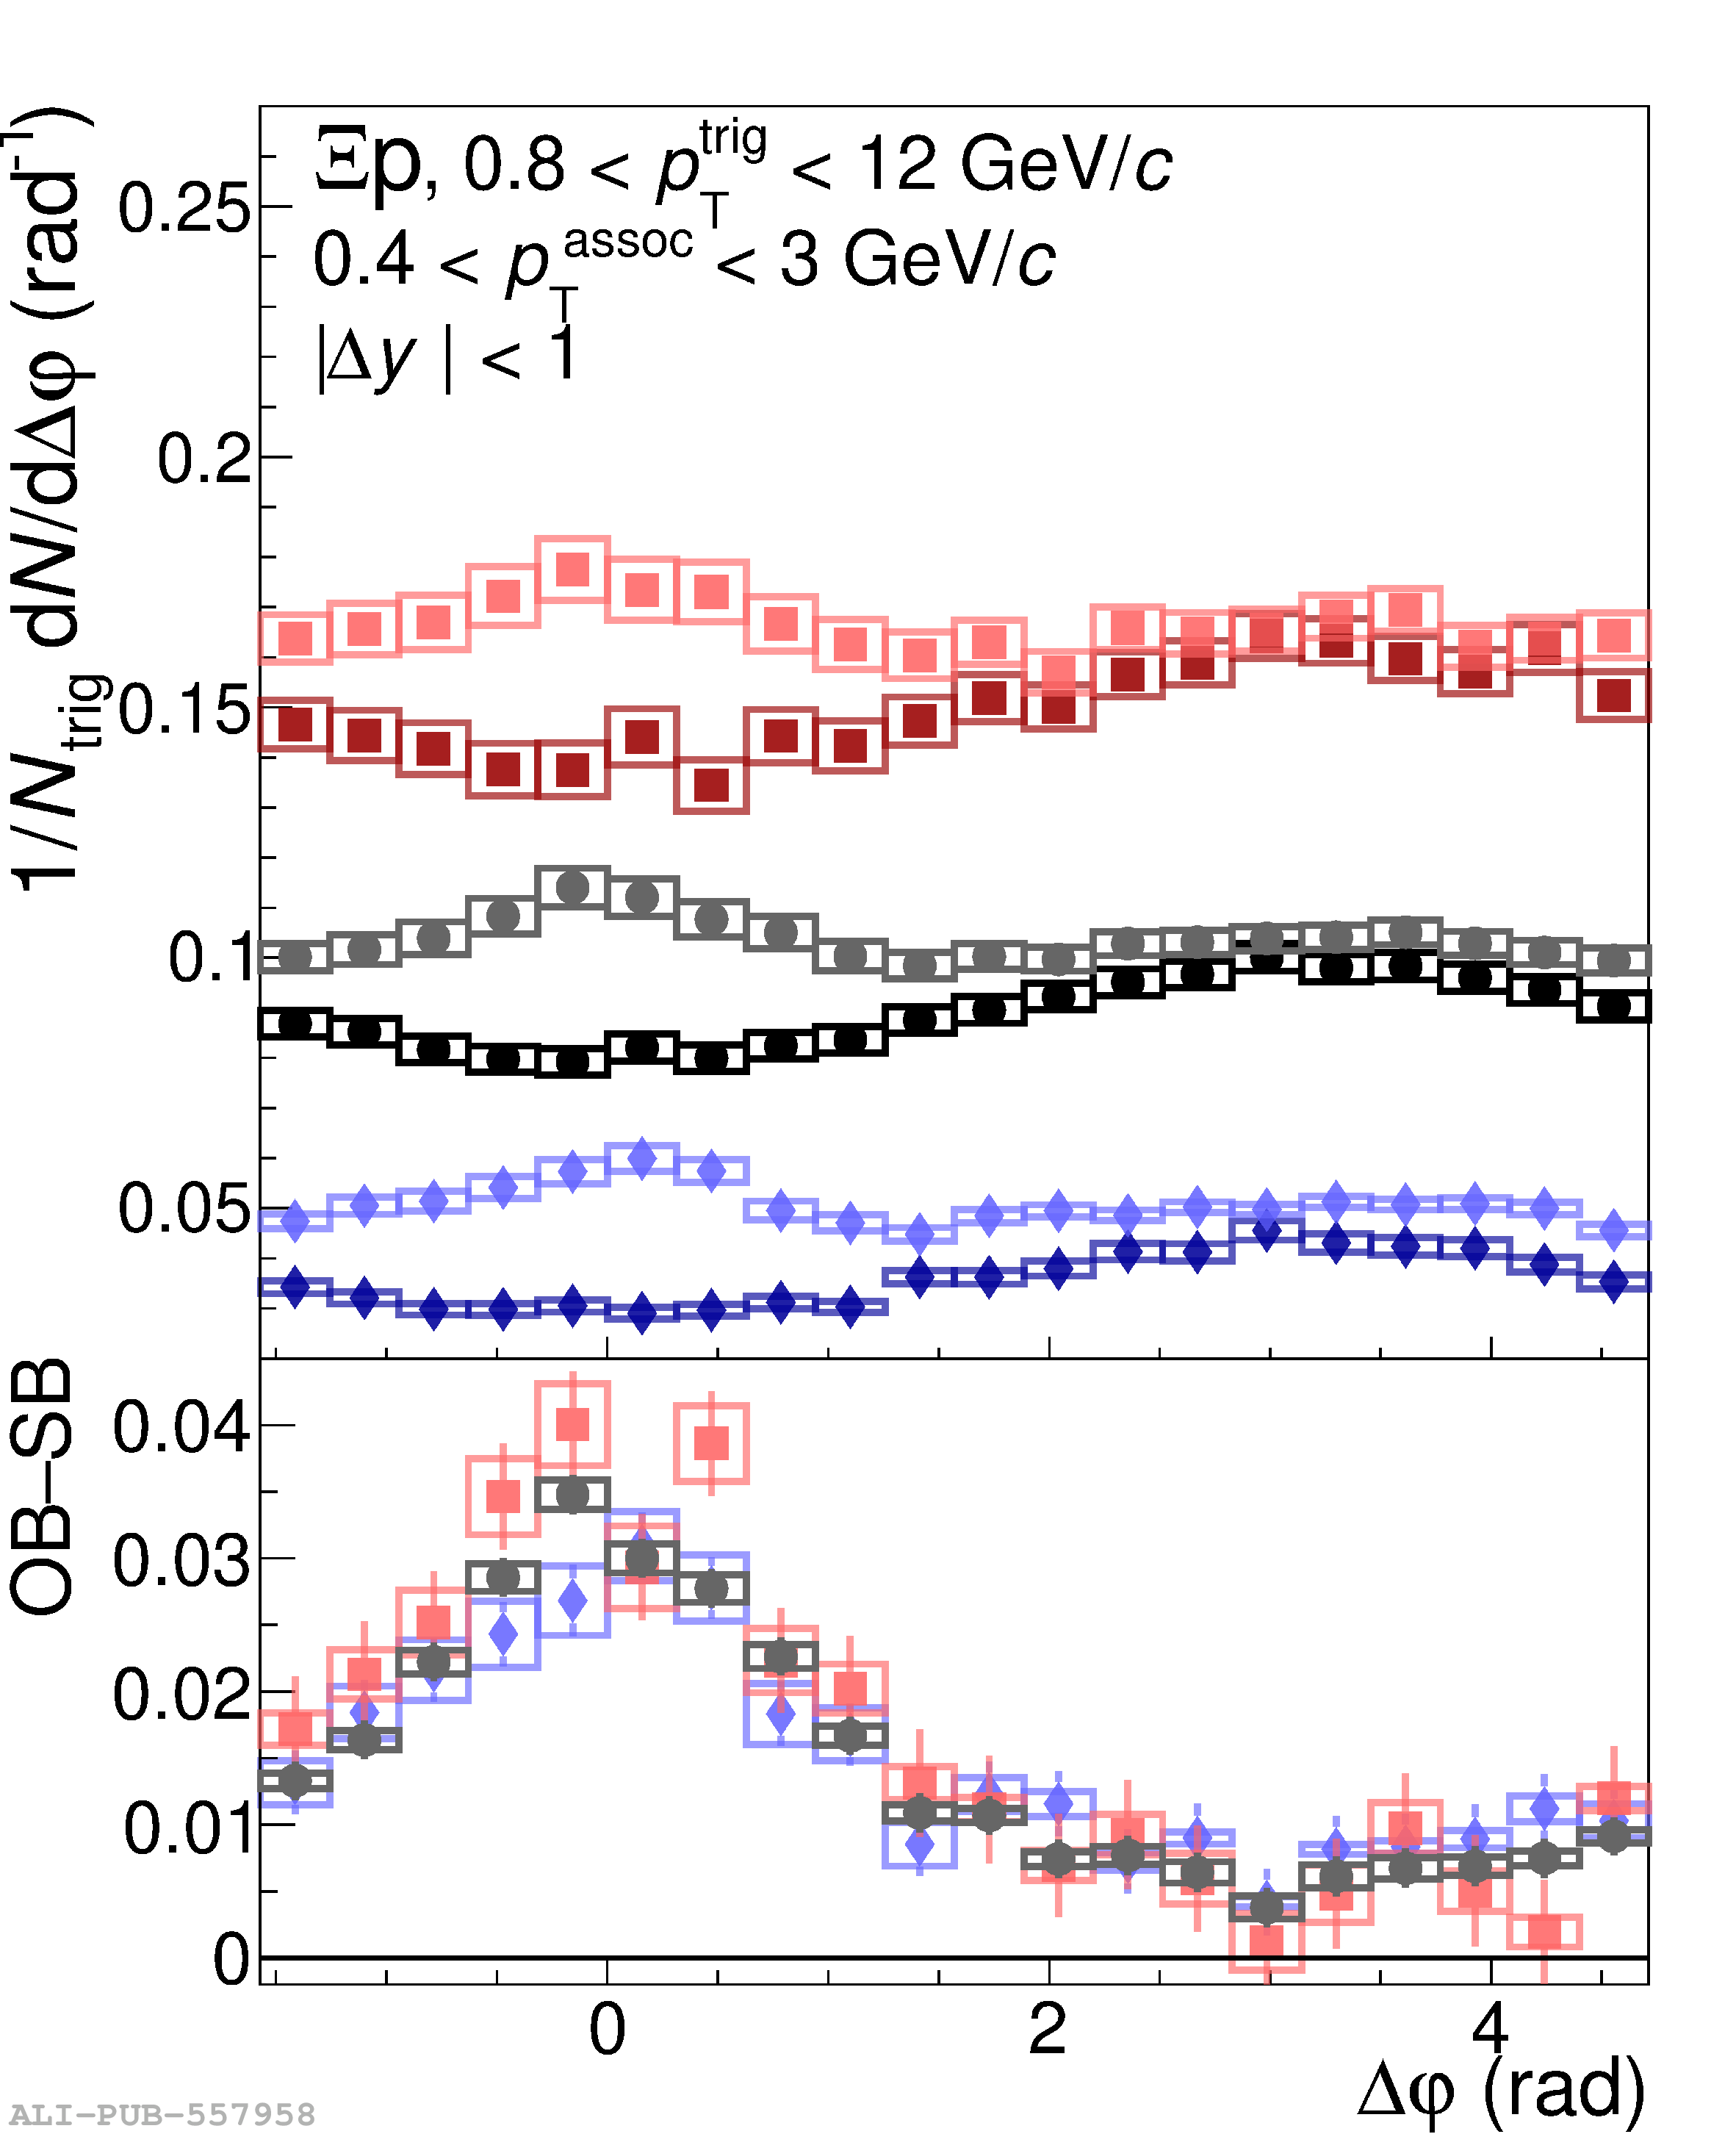 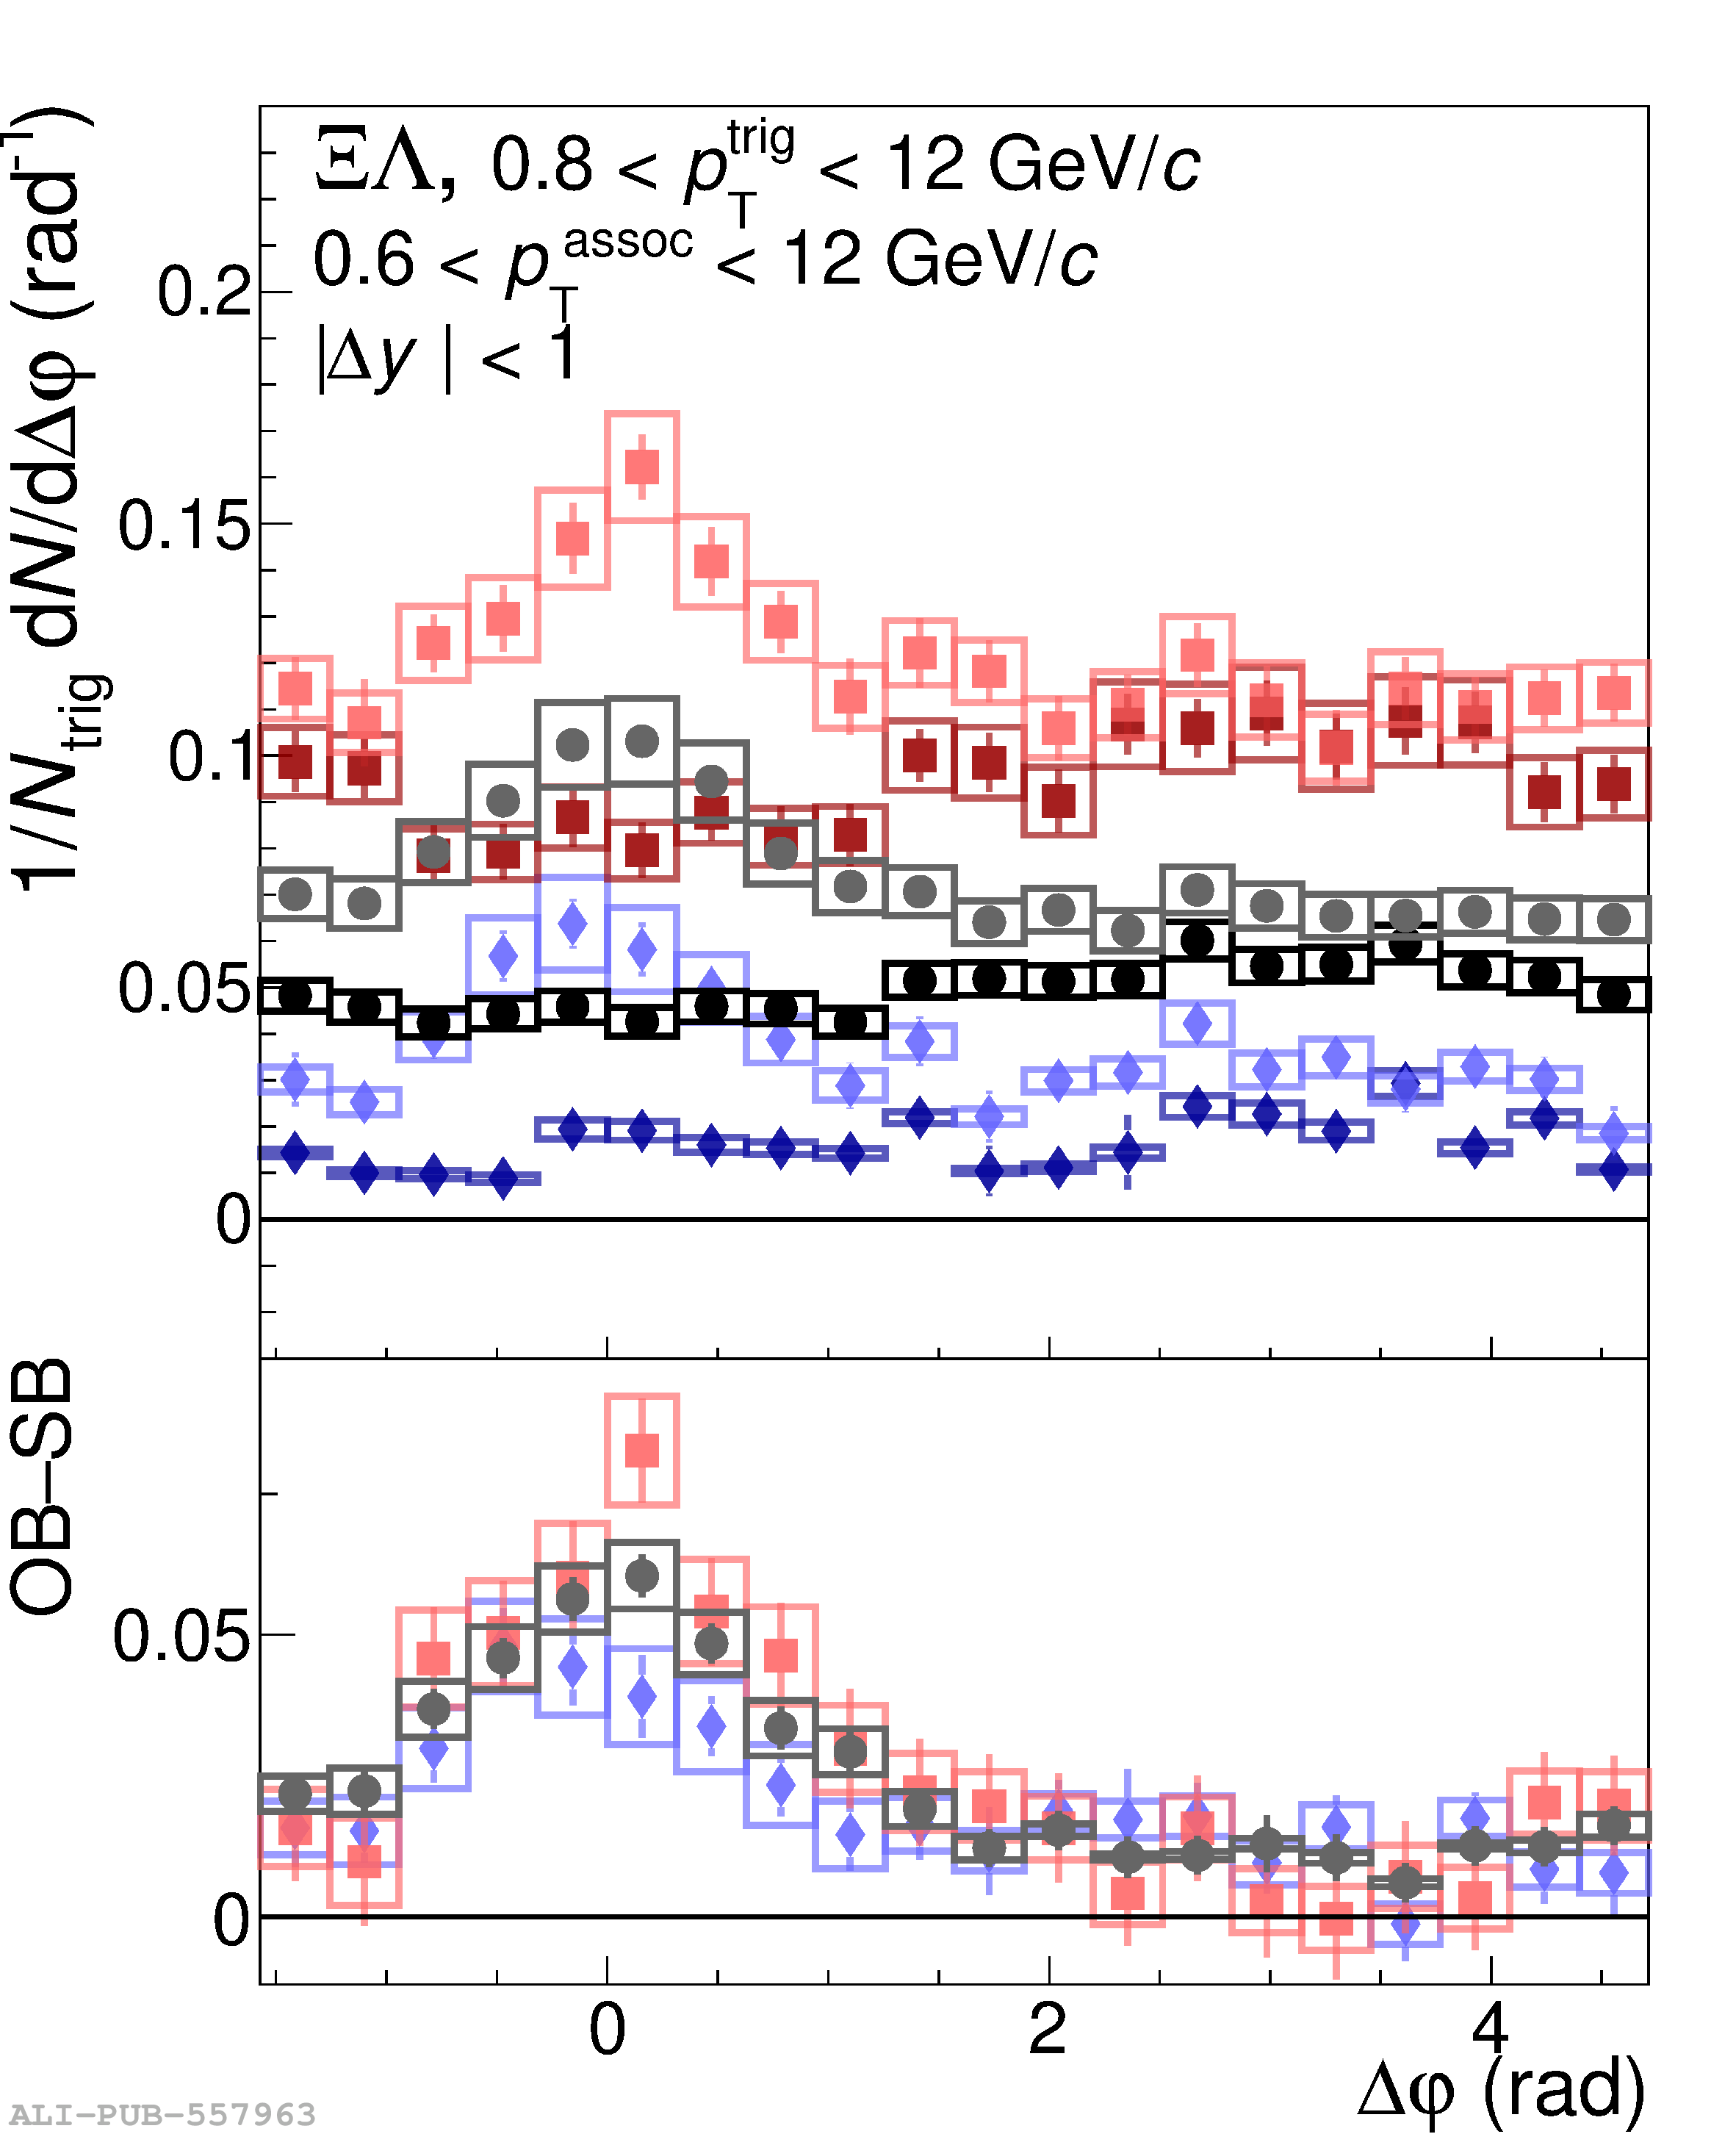 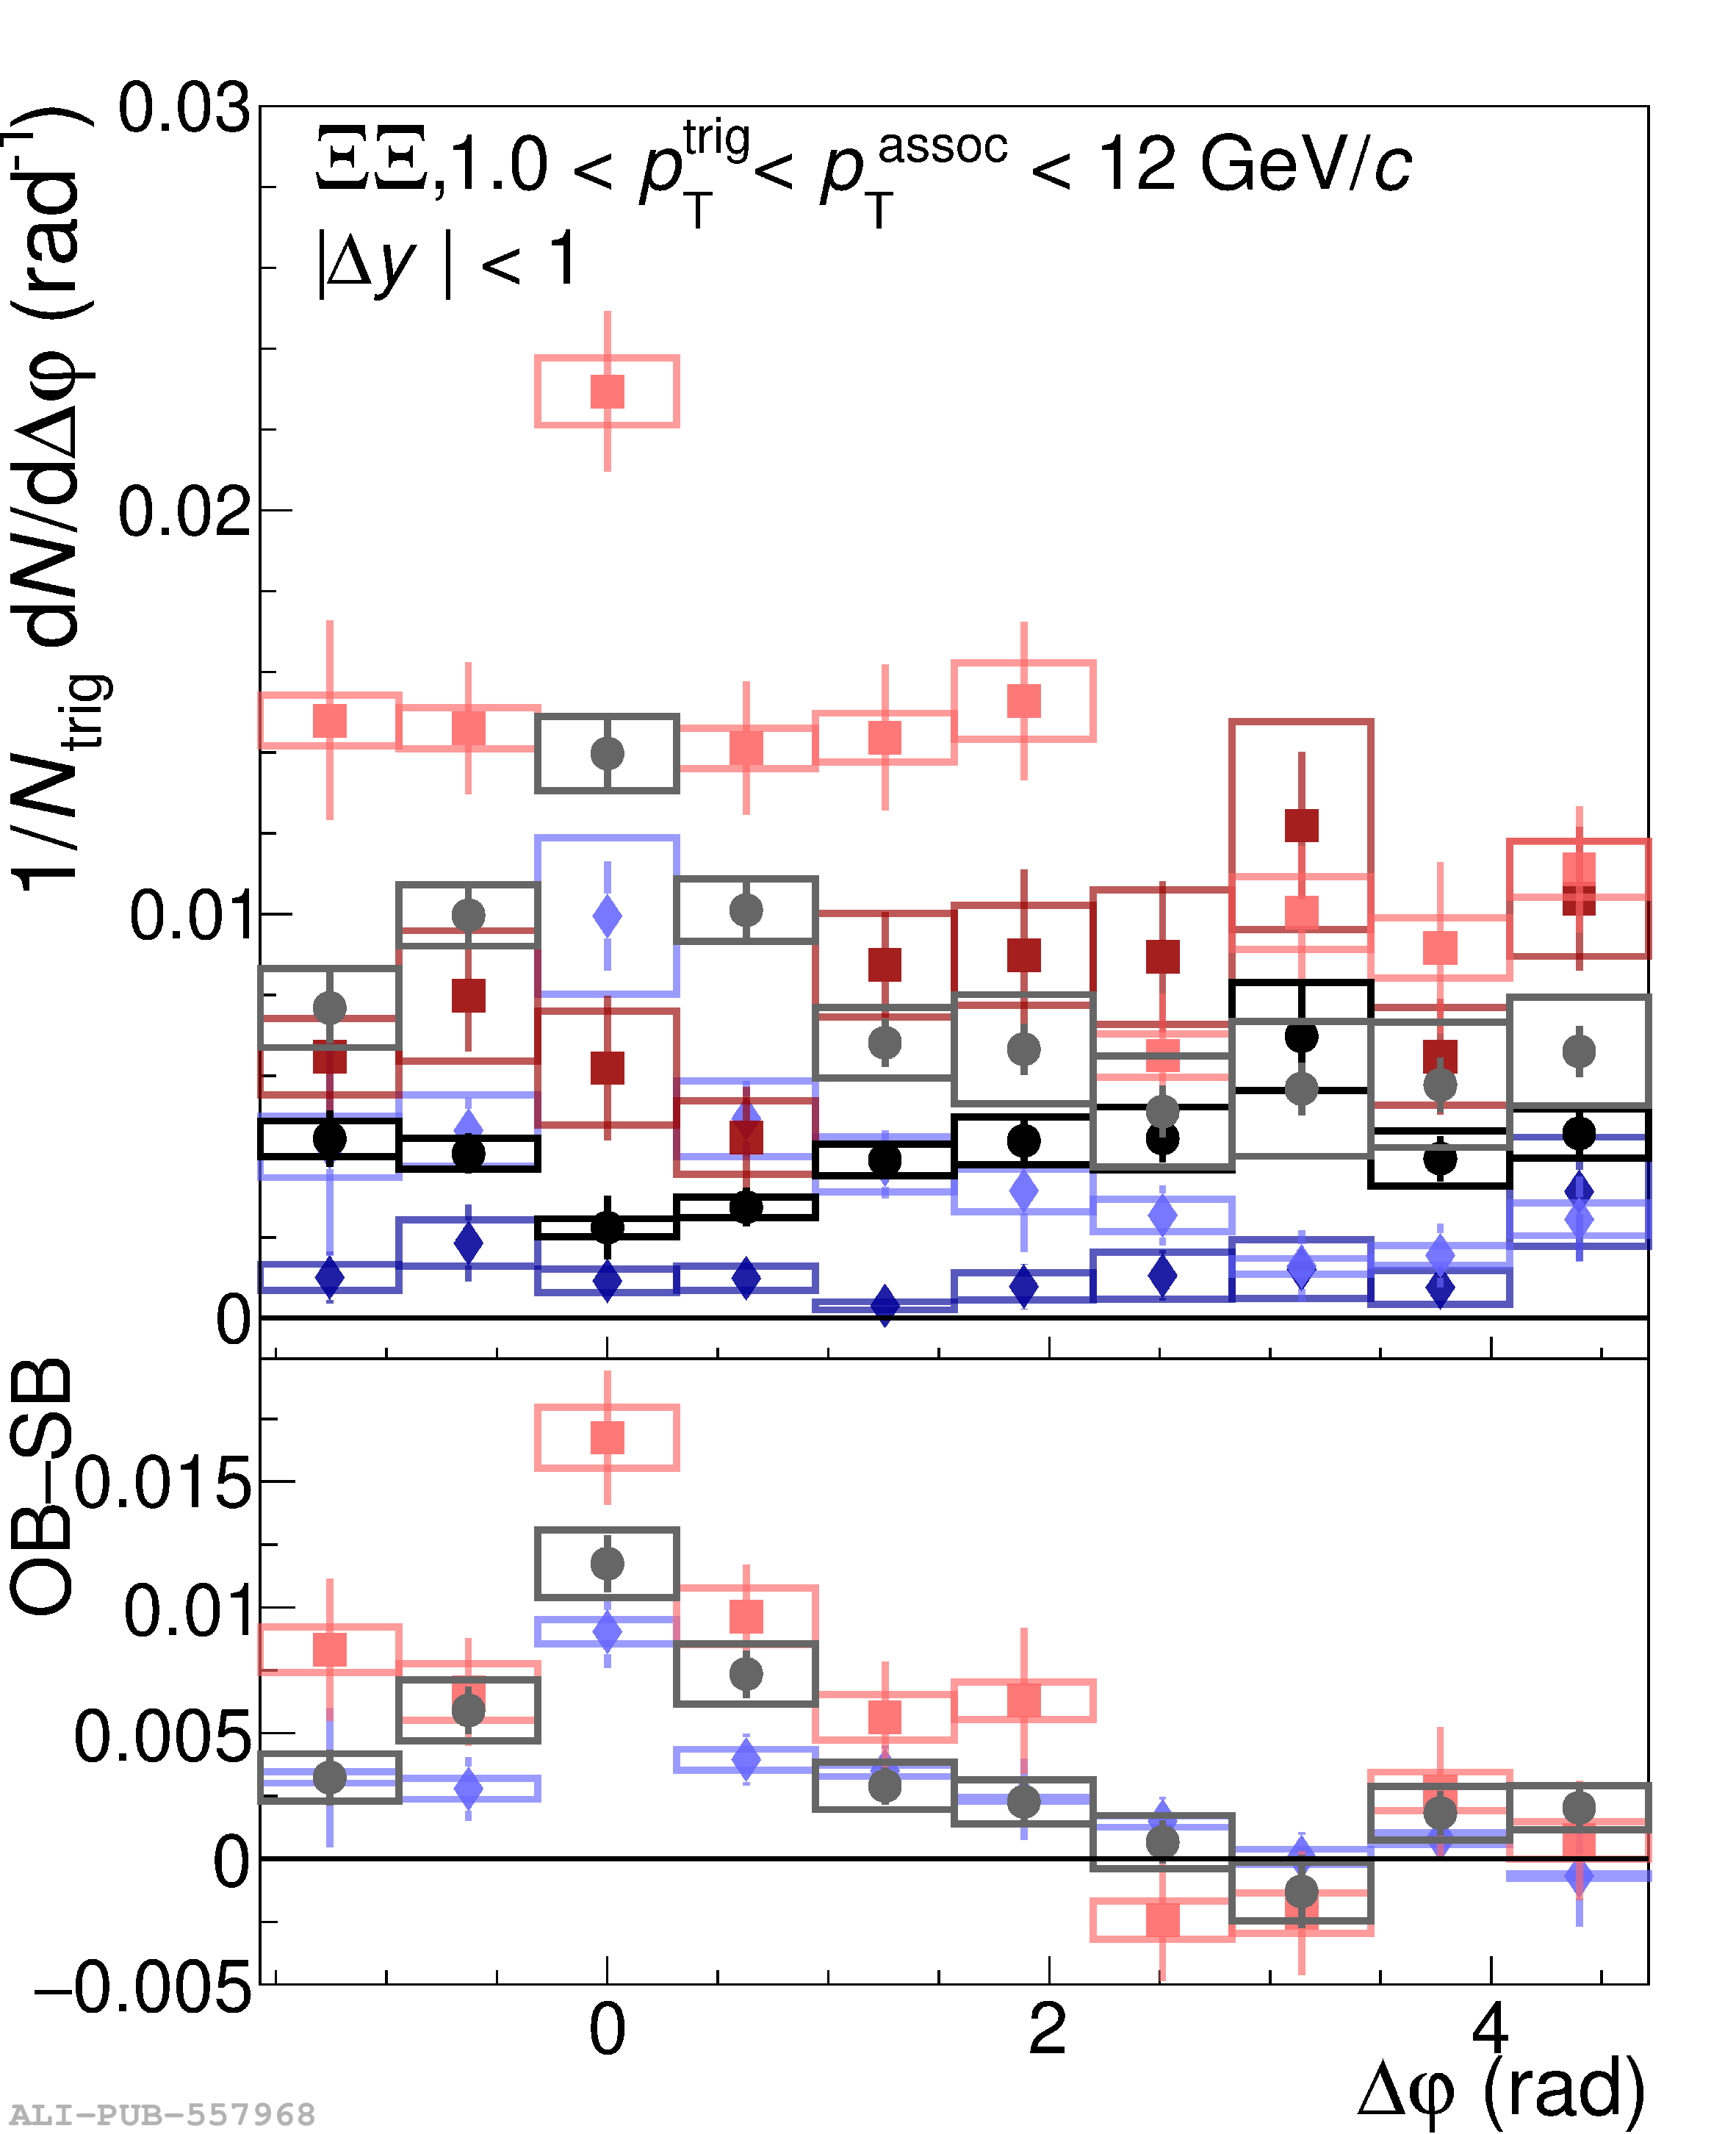 |