The OS--SS and OB--SB per-trigger yields for $\Xi\pi$, $\Xi\mathrm{K}$, $\Xi\mathrm{p}$, $\Xi\Lambda$, and $\Xi\Xi$ correlations are shown when integrated over all phase space (top), on the near-side ($|\Delta\varphi| < \pi/2$, bottom left), and on the away-side ($\pi/2 < \Delta\varphi < 3\pi/2$, bottom right). Statistical and systematic uncertainties are represented by bars and boxes, respectively. The ALICE data are compared with the following models: \pythia{} 8 Monash tune (blue), \pythia{} 8 with junctions enabled (green), \pythia{} 8 with junctions and ropes (yellow), \eposlhc{} (red), and \herwig{} 7 (pink). | 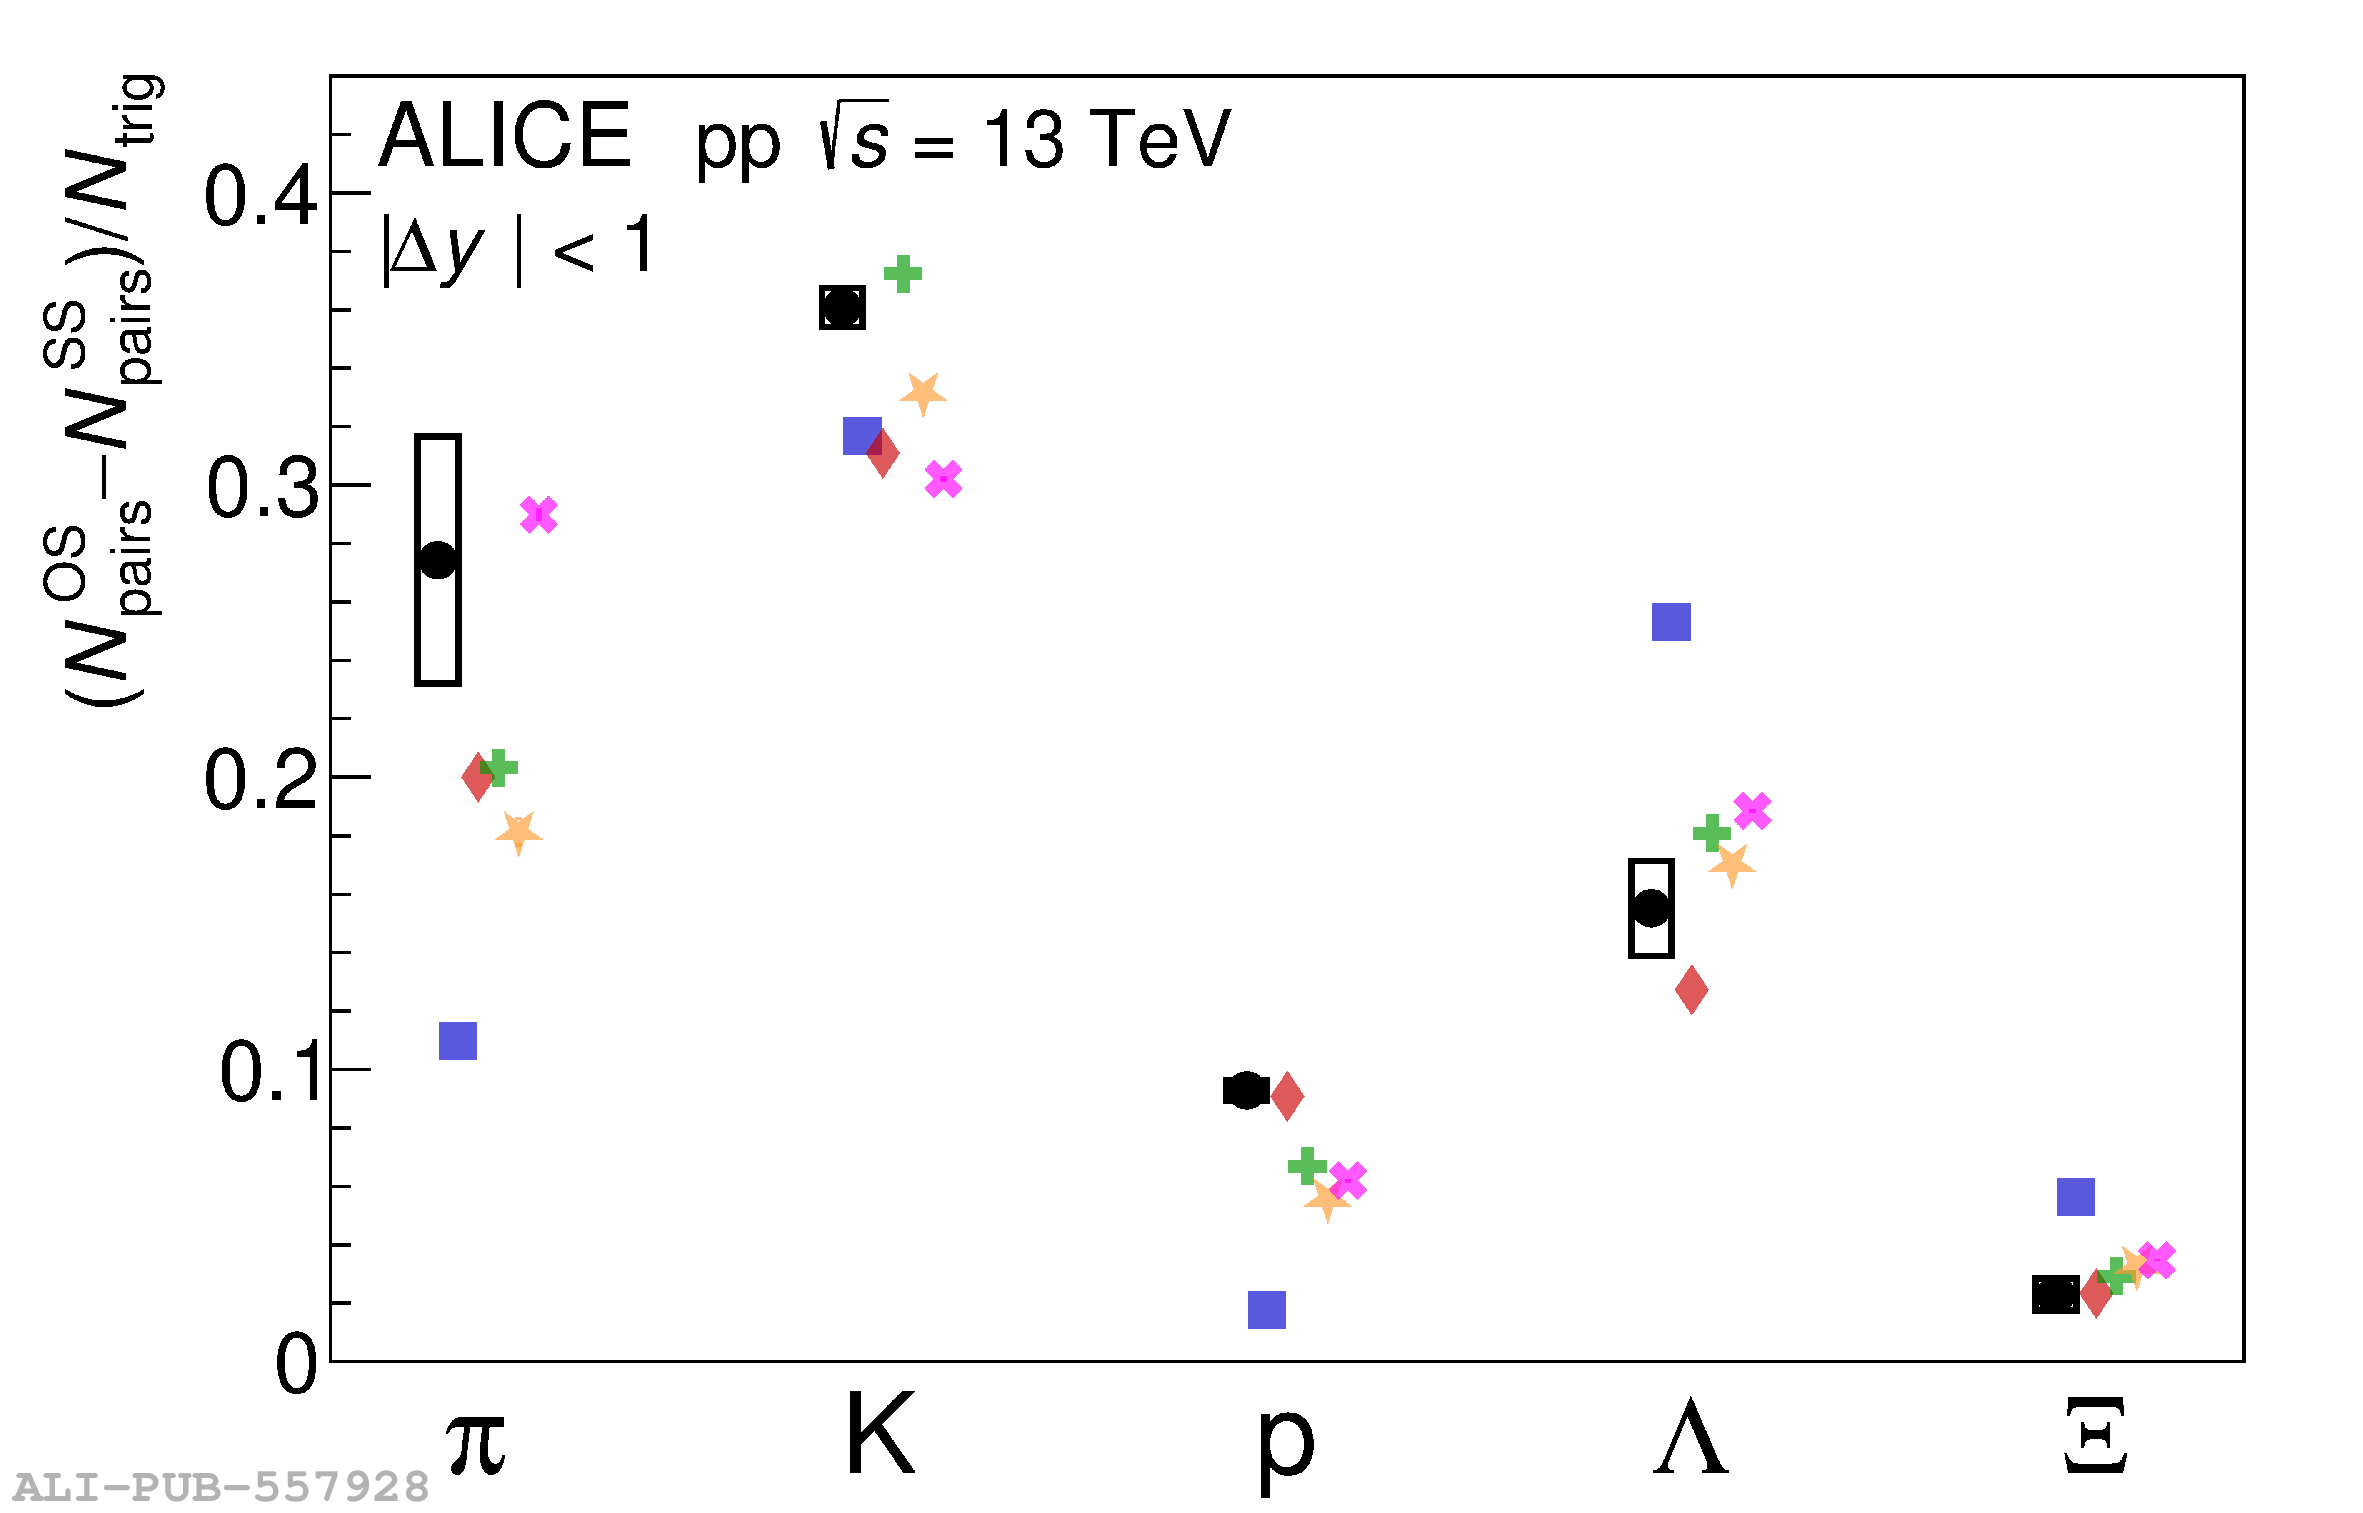 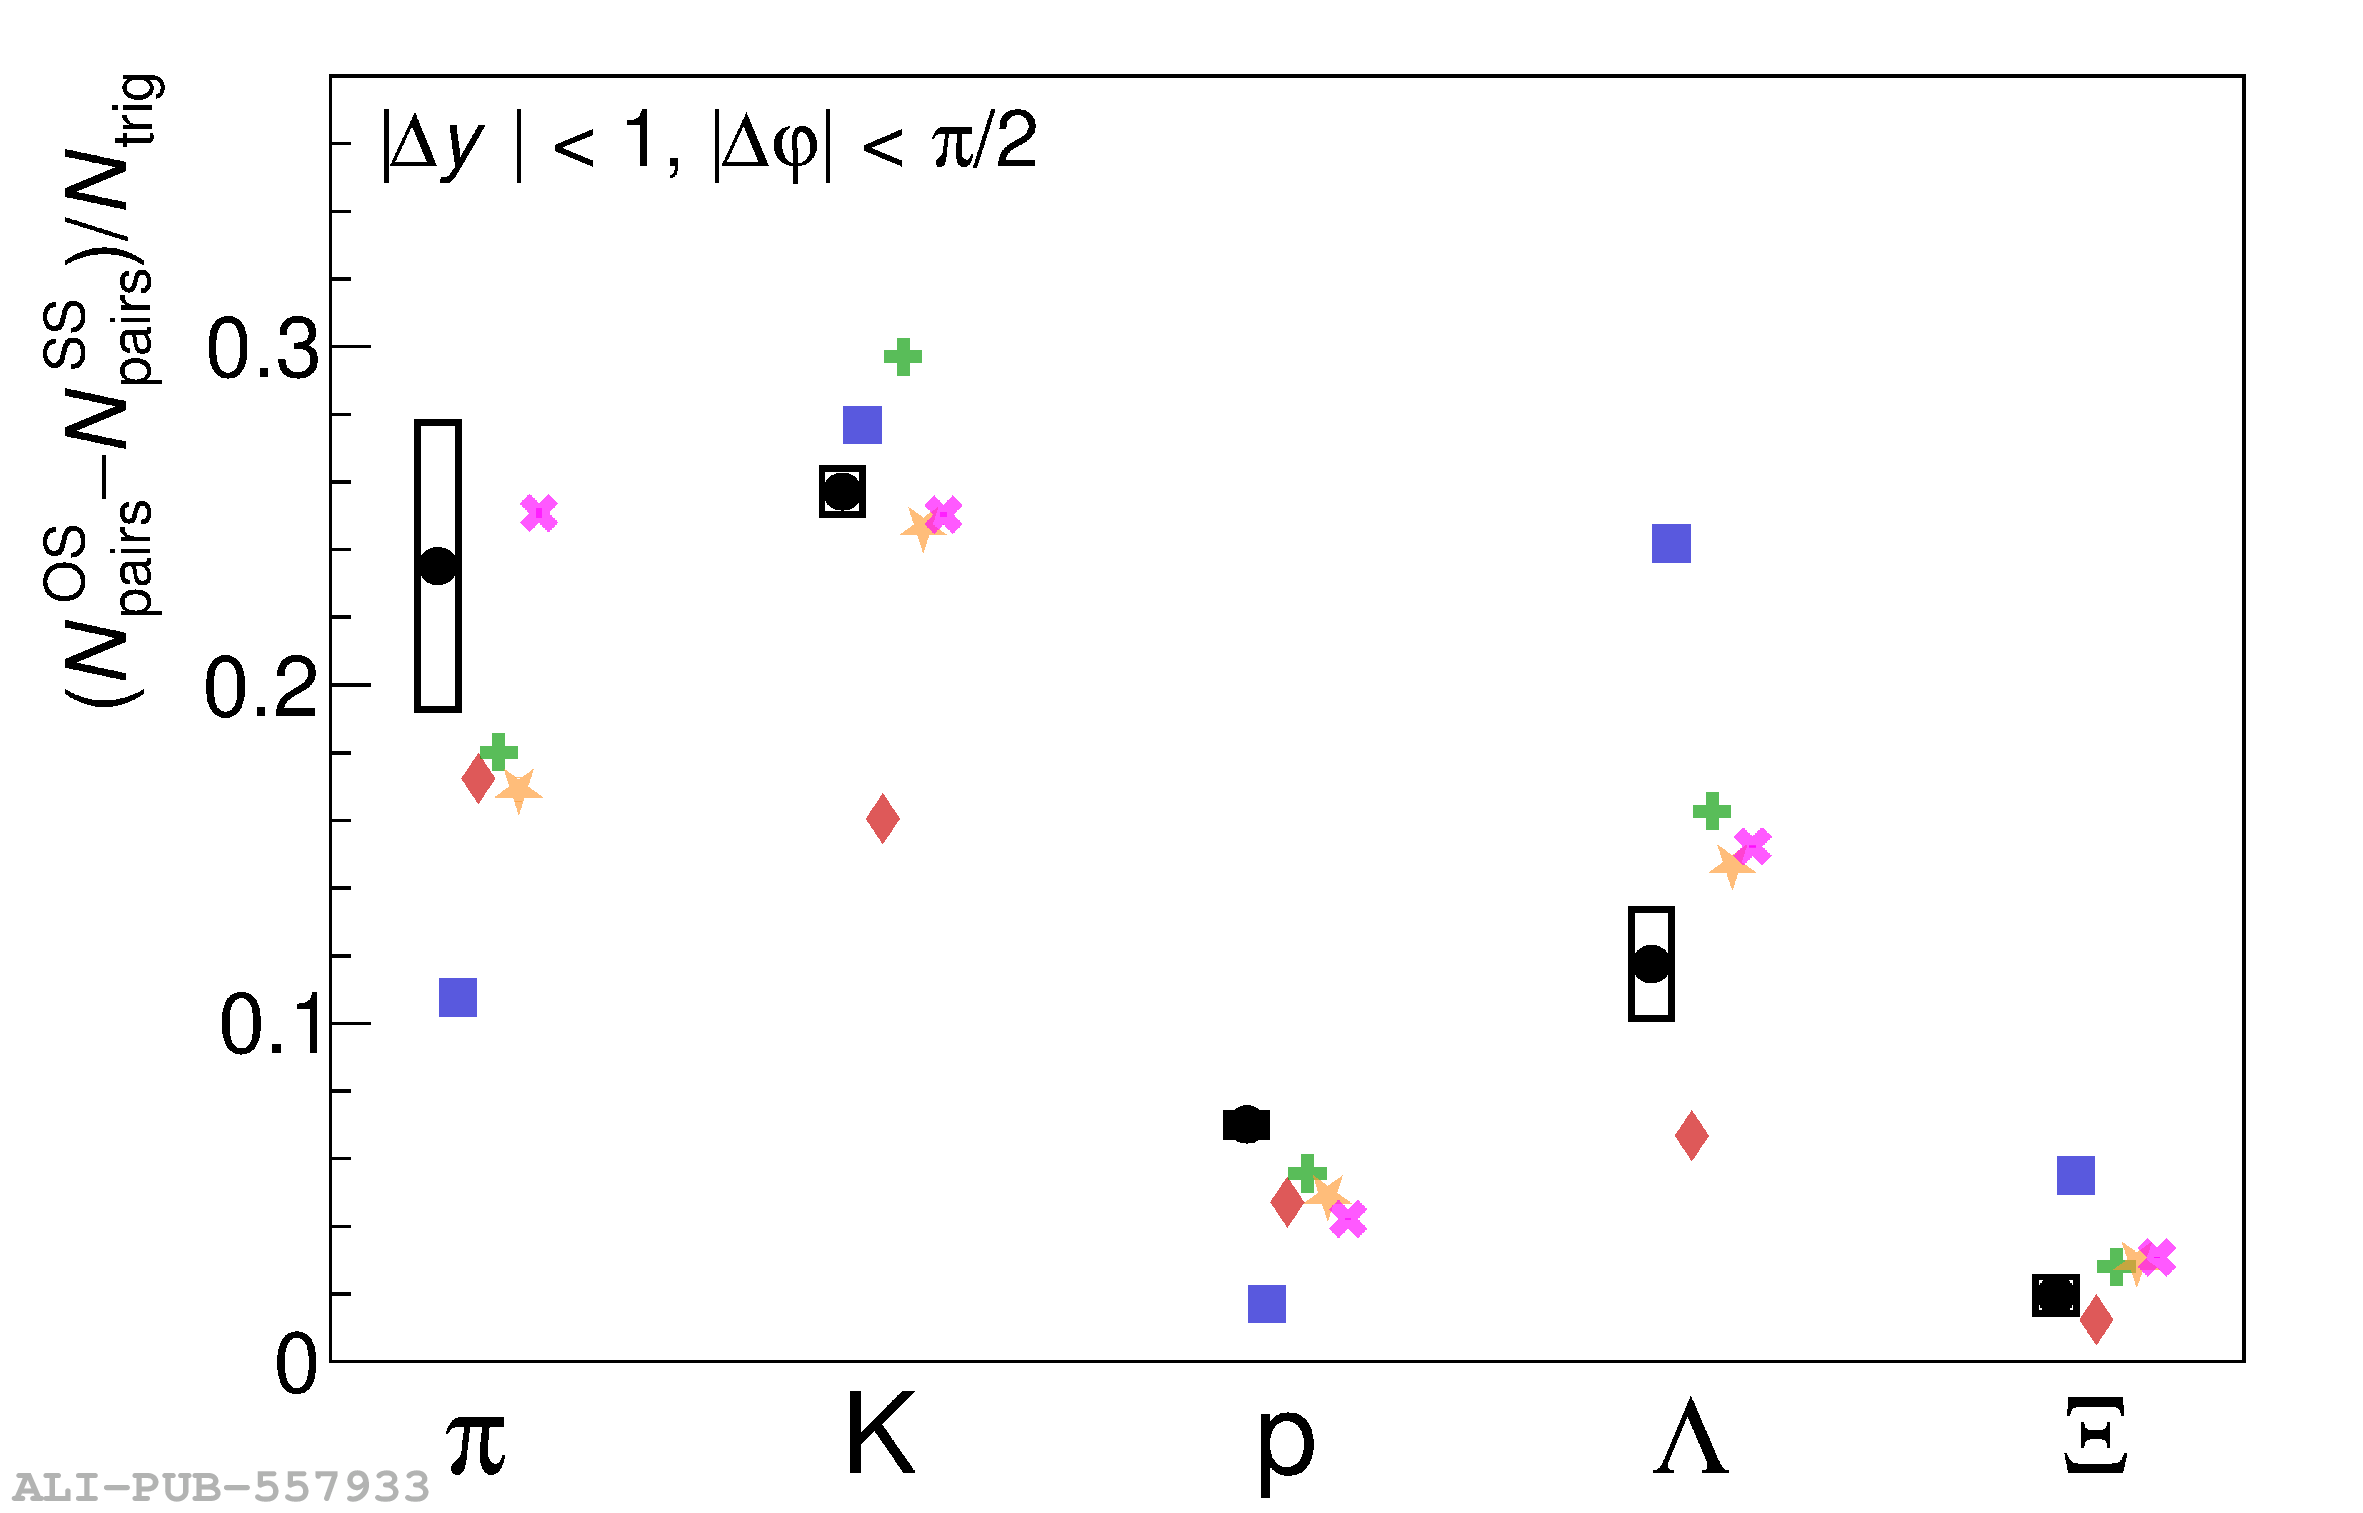 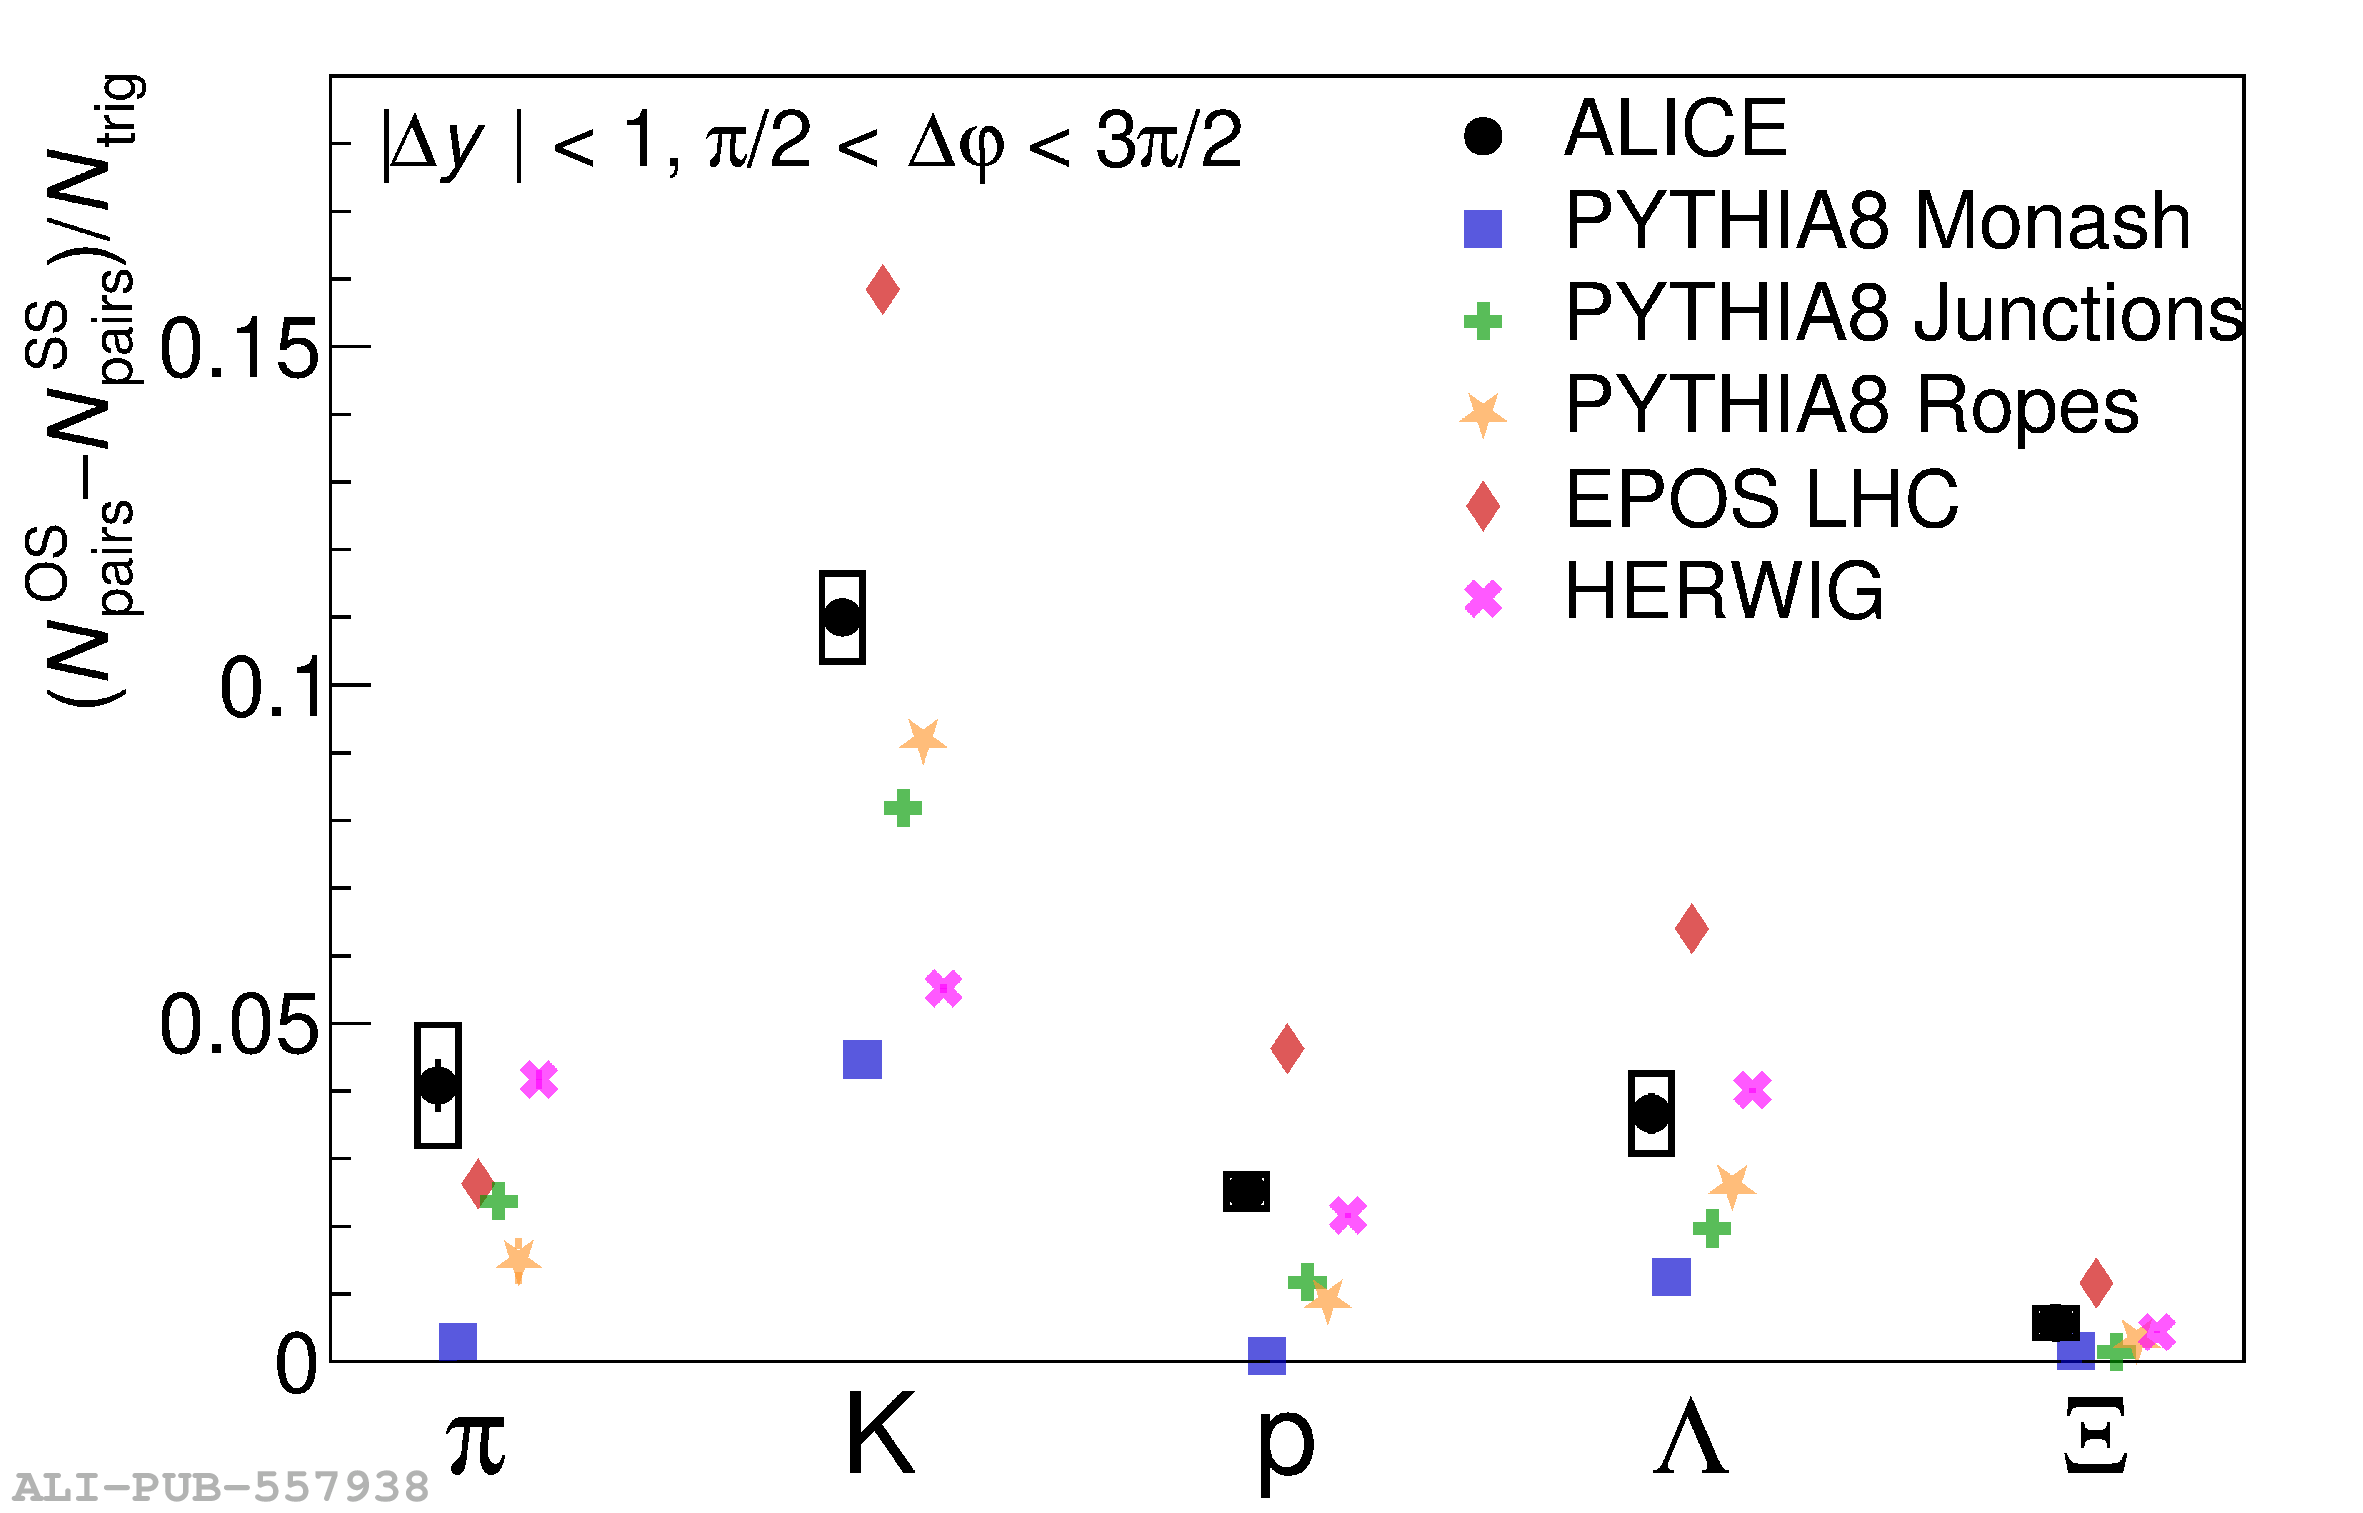 |