$\Xi^-\overline{\Xi}^+$ and $\Xi^-\Xi^-$ (and charge conjugate) correlation functions projected onto $\Delta\varphi$ ($|y| < 1$, left), the near-side on $\Delta y$ ($|\Delta\varphi| < \pi/2$, middle), and the away-side on $\Delta y$ ($\pi/2 < \Delta\varphi < 3\pi/2$, right). Opposite-baryon-number ($\Xi^{-}\overline{\Xi}^{+}+\overline{\Xi}^{+}\Xi^{-}$) correlations are shown in grey squares, the same-baryon-number ($\Xi^{-}\Xi^{-}+\overline{\Xi}^{+}\overline{\Xi}^{+}$) correlations are black circles; the OB--SB difference is displayed in the bottom panels. Statistical and systematic uncertainties are represented by bars and boxes, respectively. The ALICE data are compared with the following models: \pythia{} 8 Monash tune (blue), \pythia{} 8 with junctions enabled (green), \pythia{} 8 with junctions and ropes (yellow), \eposlhc{} (red), and \herwig{} 7 (pink). | 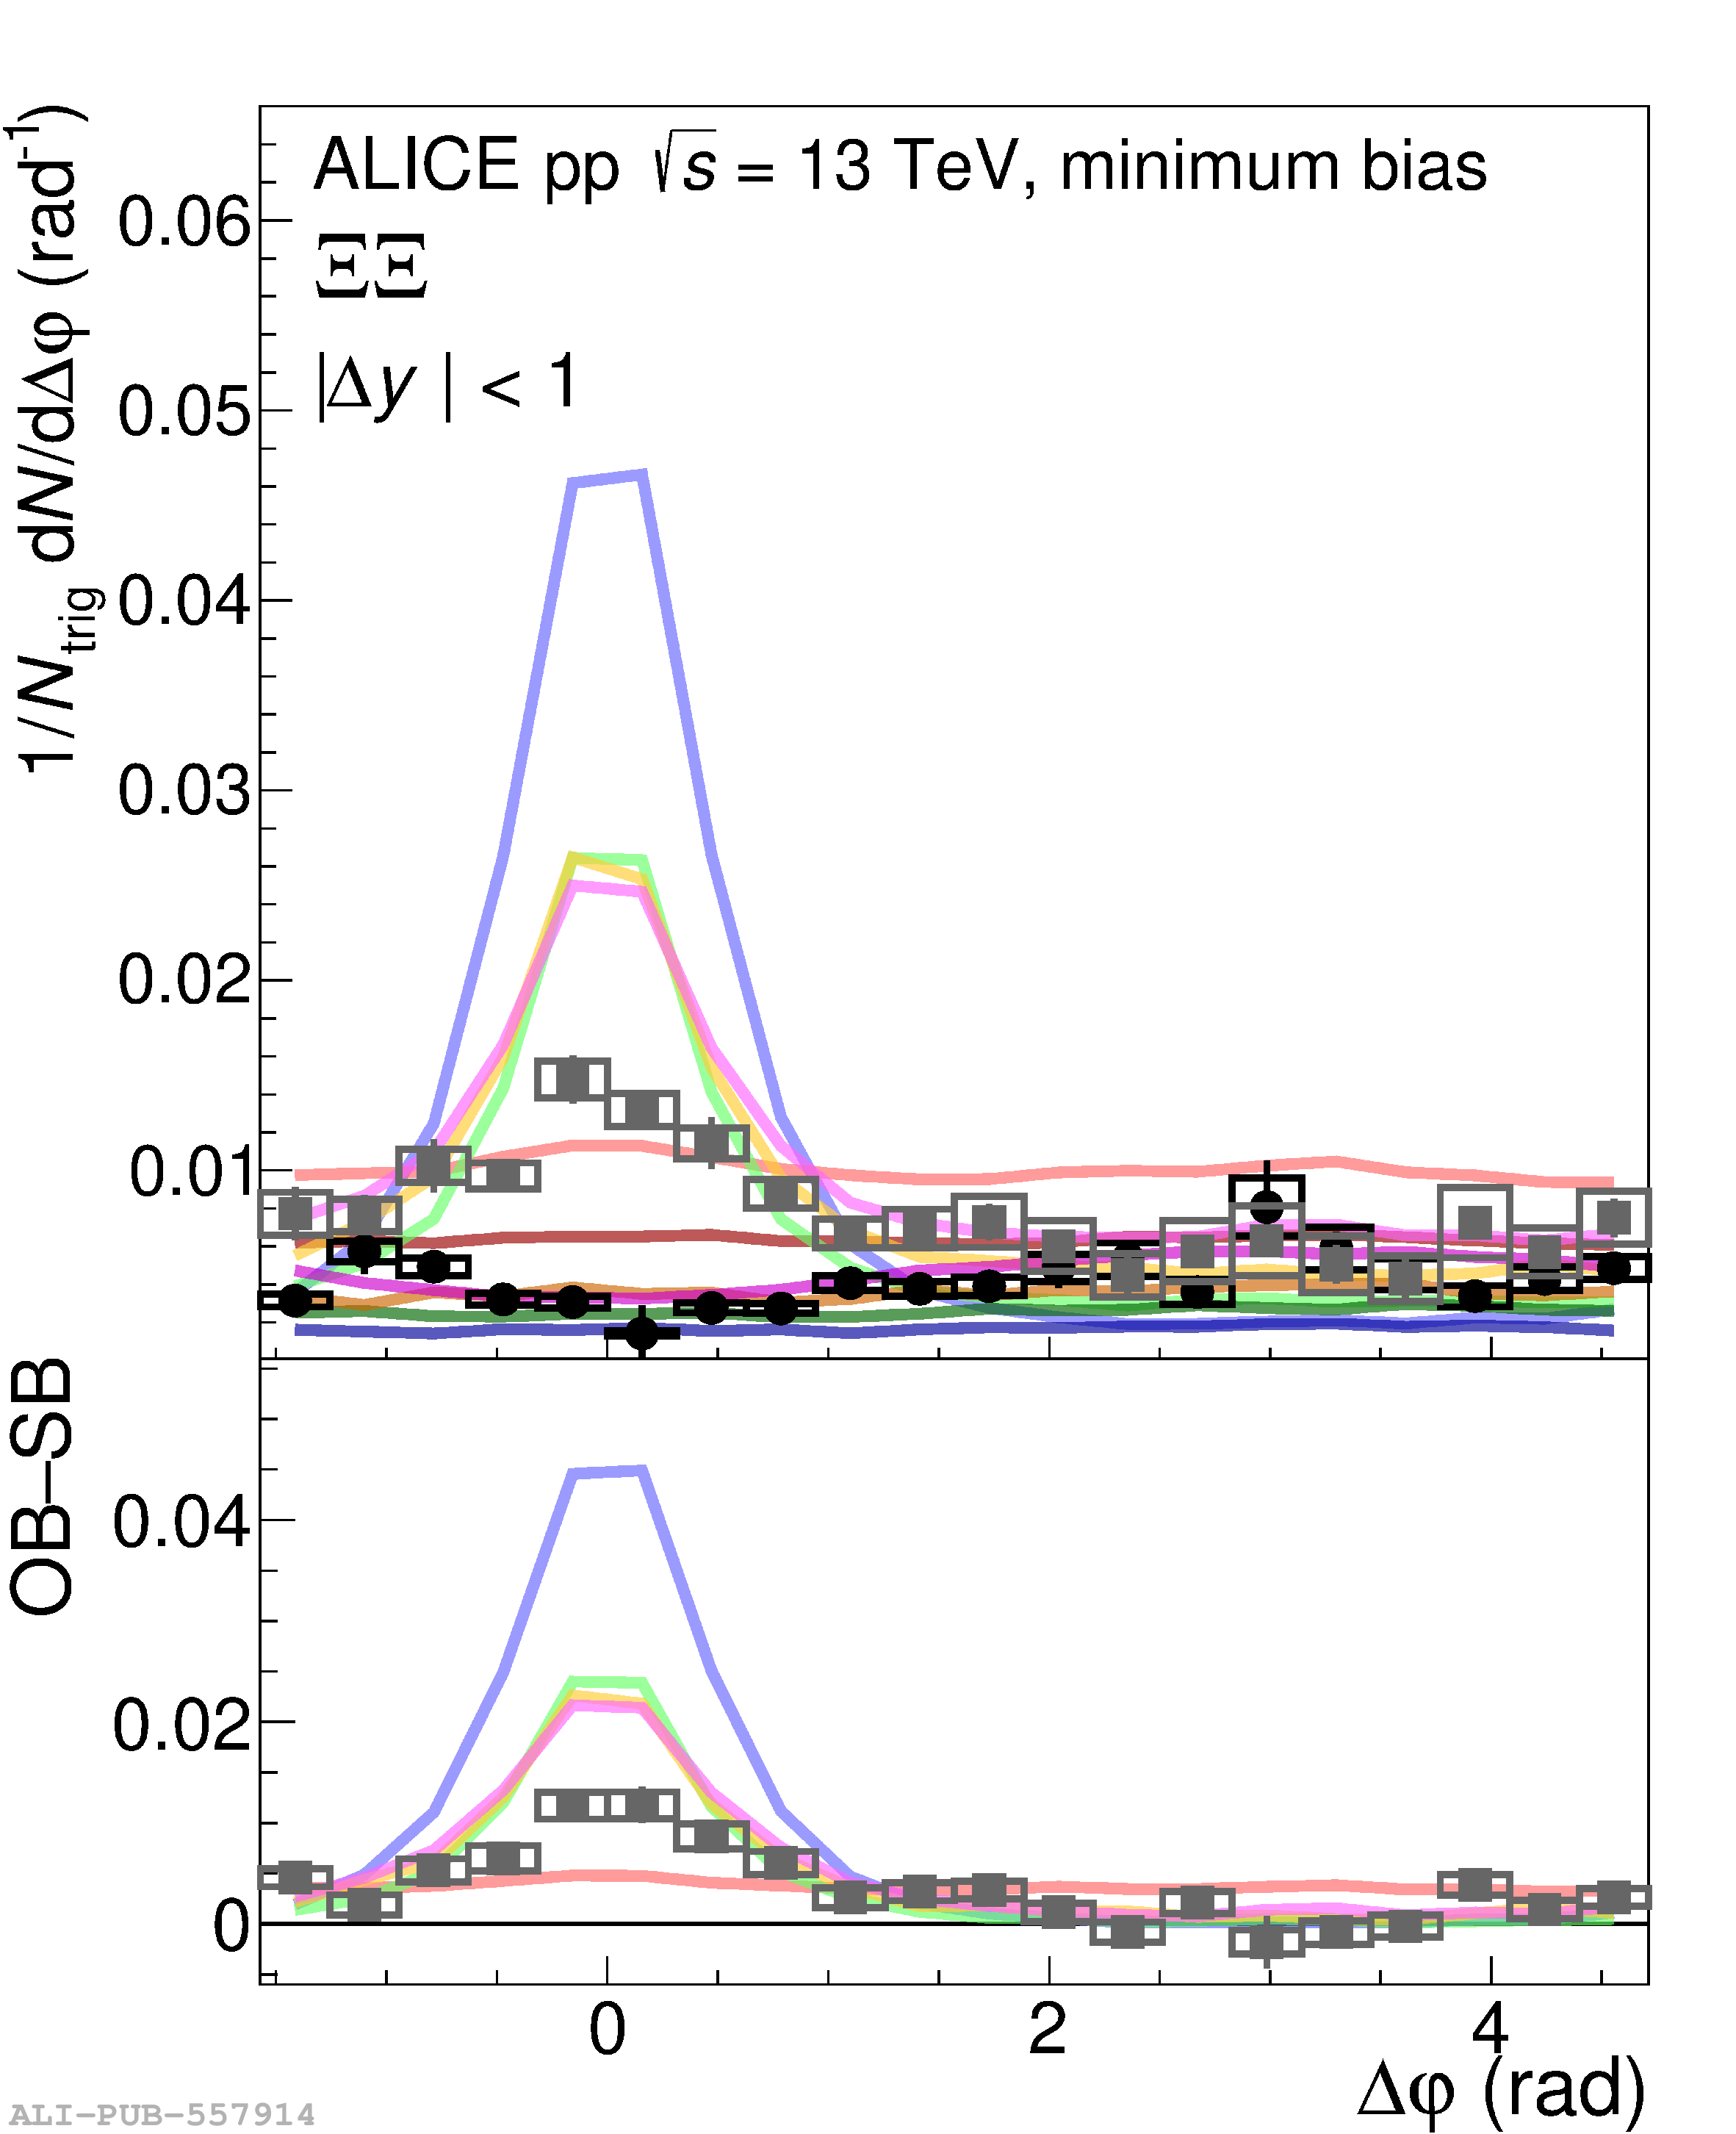  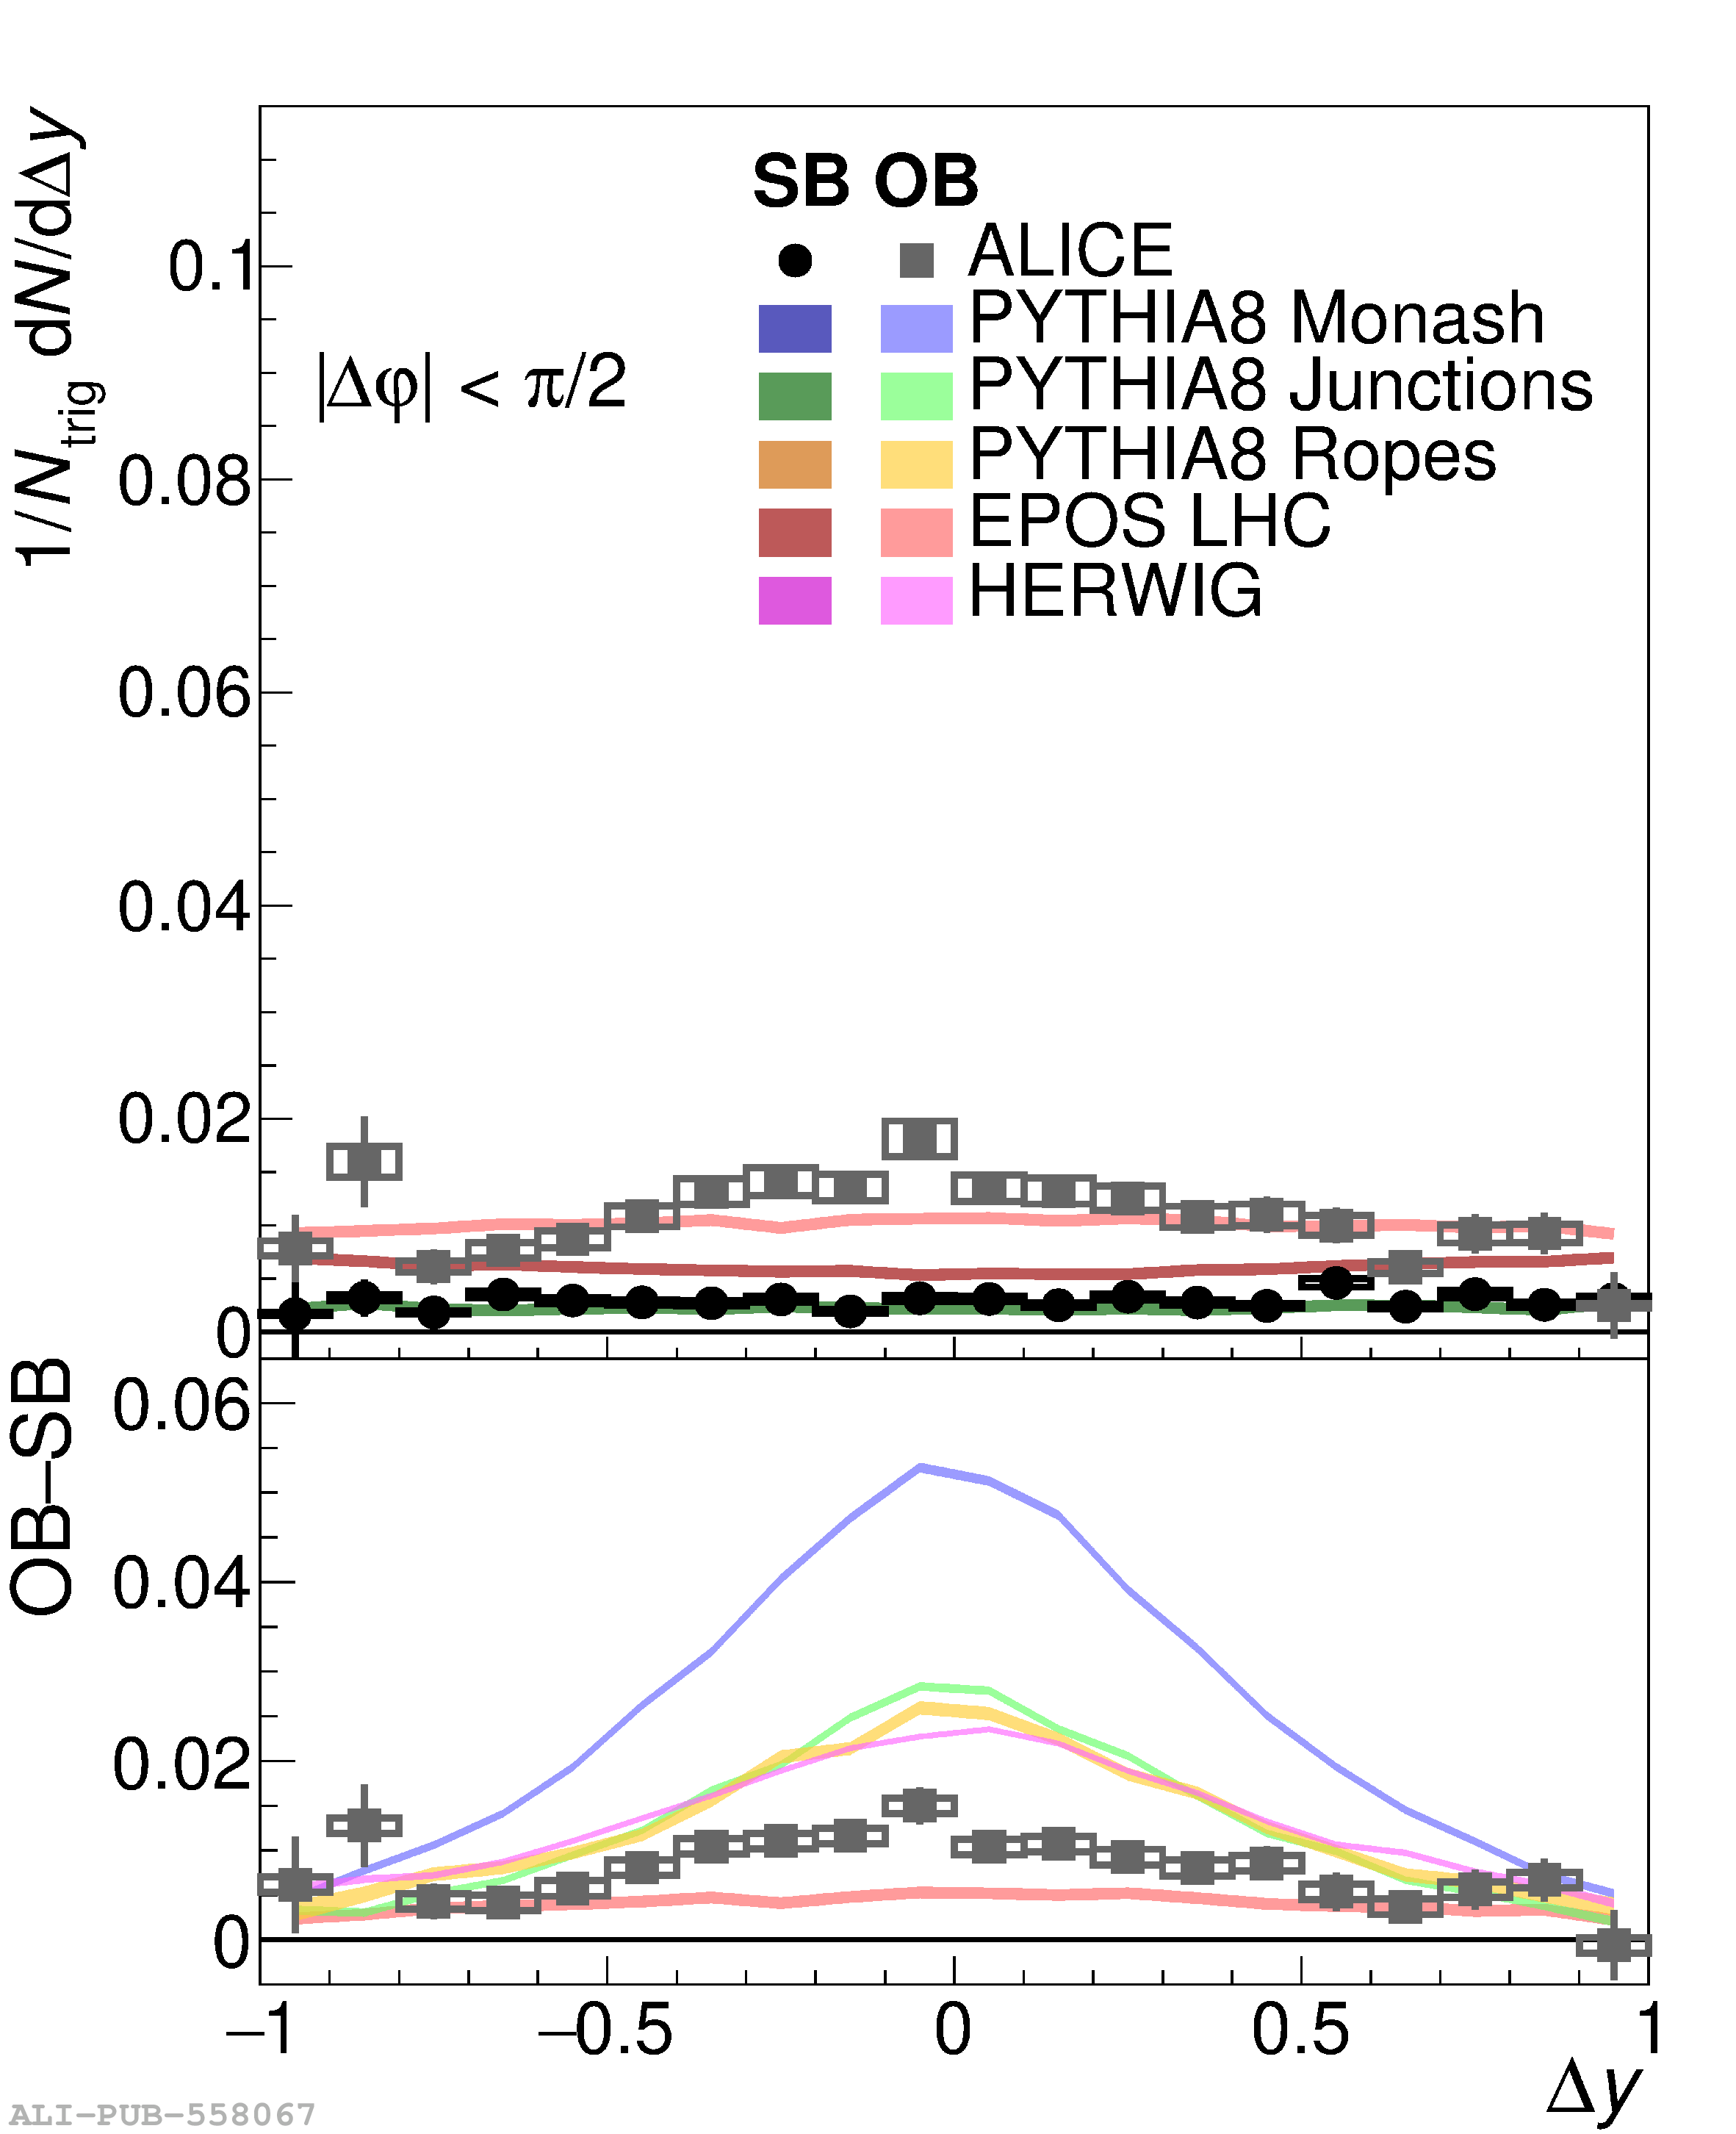 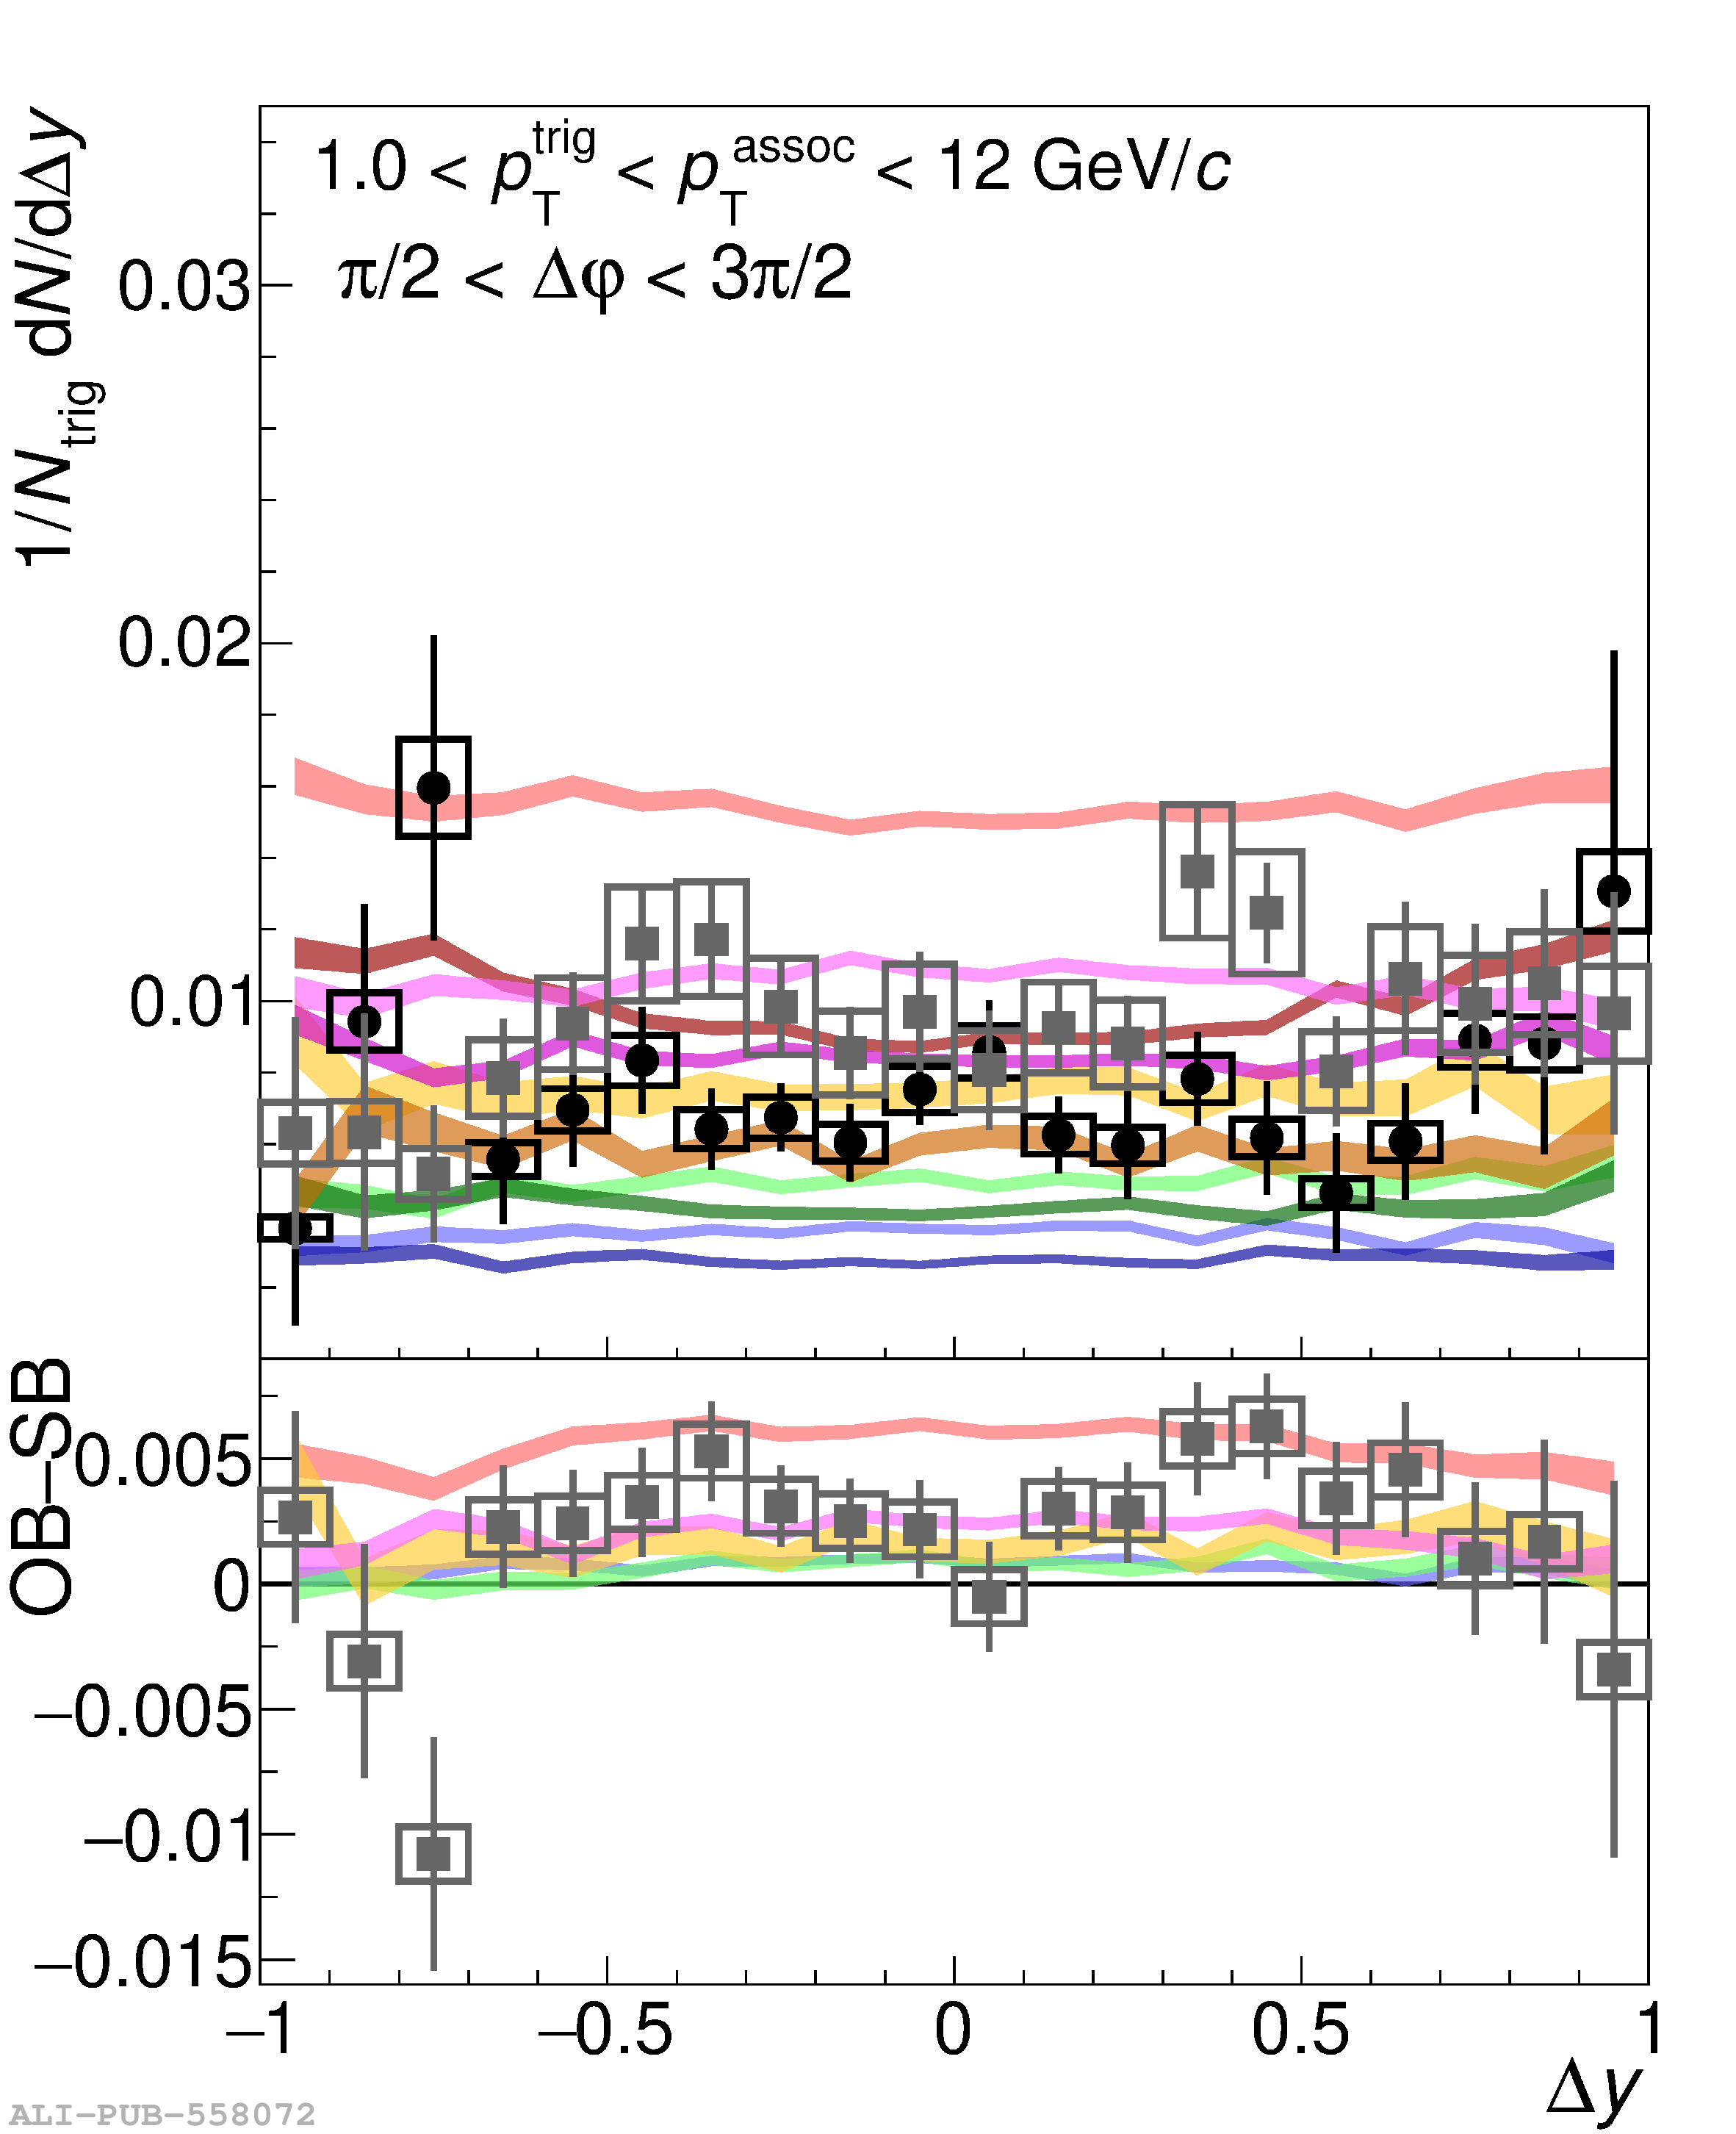 |