Upper panel: inclusive \ee yield in the 10\% most central \PbPb collisions at \fivenn as a function of DCA$_{\rm ee}$ in the mass range $2.6 < m_{\rm ee} < 3.1$ \GeVmass, compared with a cocktail of expected sources, including medium effects for the heavy-flavor contributions. Bottom panel: corresponding data to cocktail ratio. Statistical and systematic uncertainties on the data are shown as vertical bars and boxes, respectively. The total uncertainty of the cocktail is represented as a grey band. | 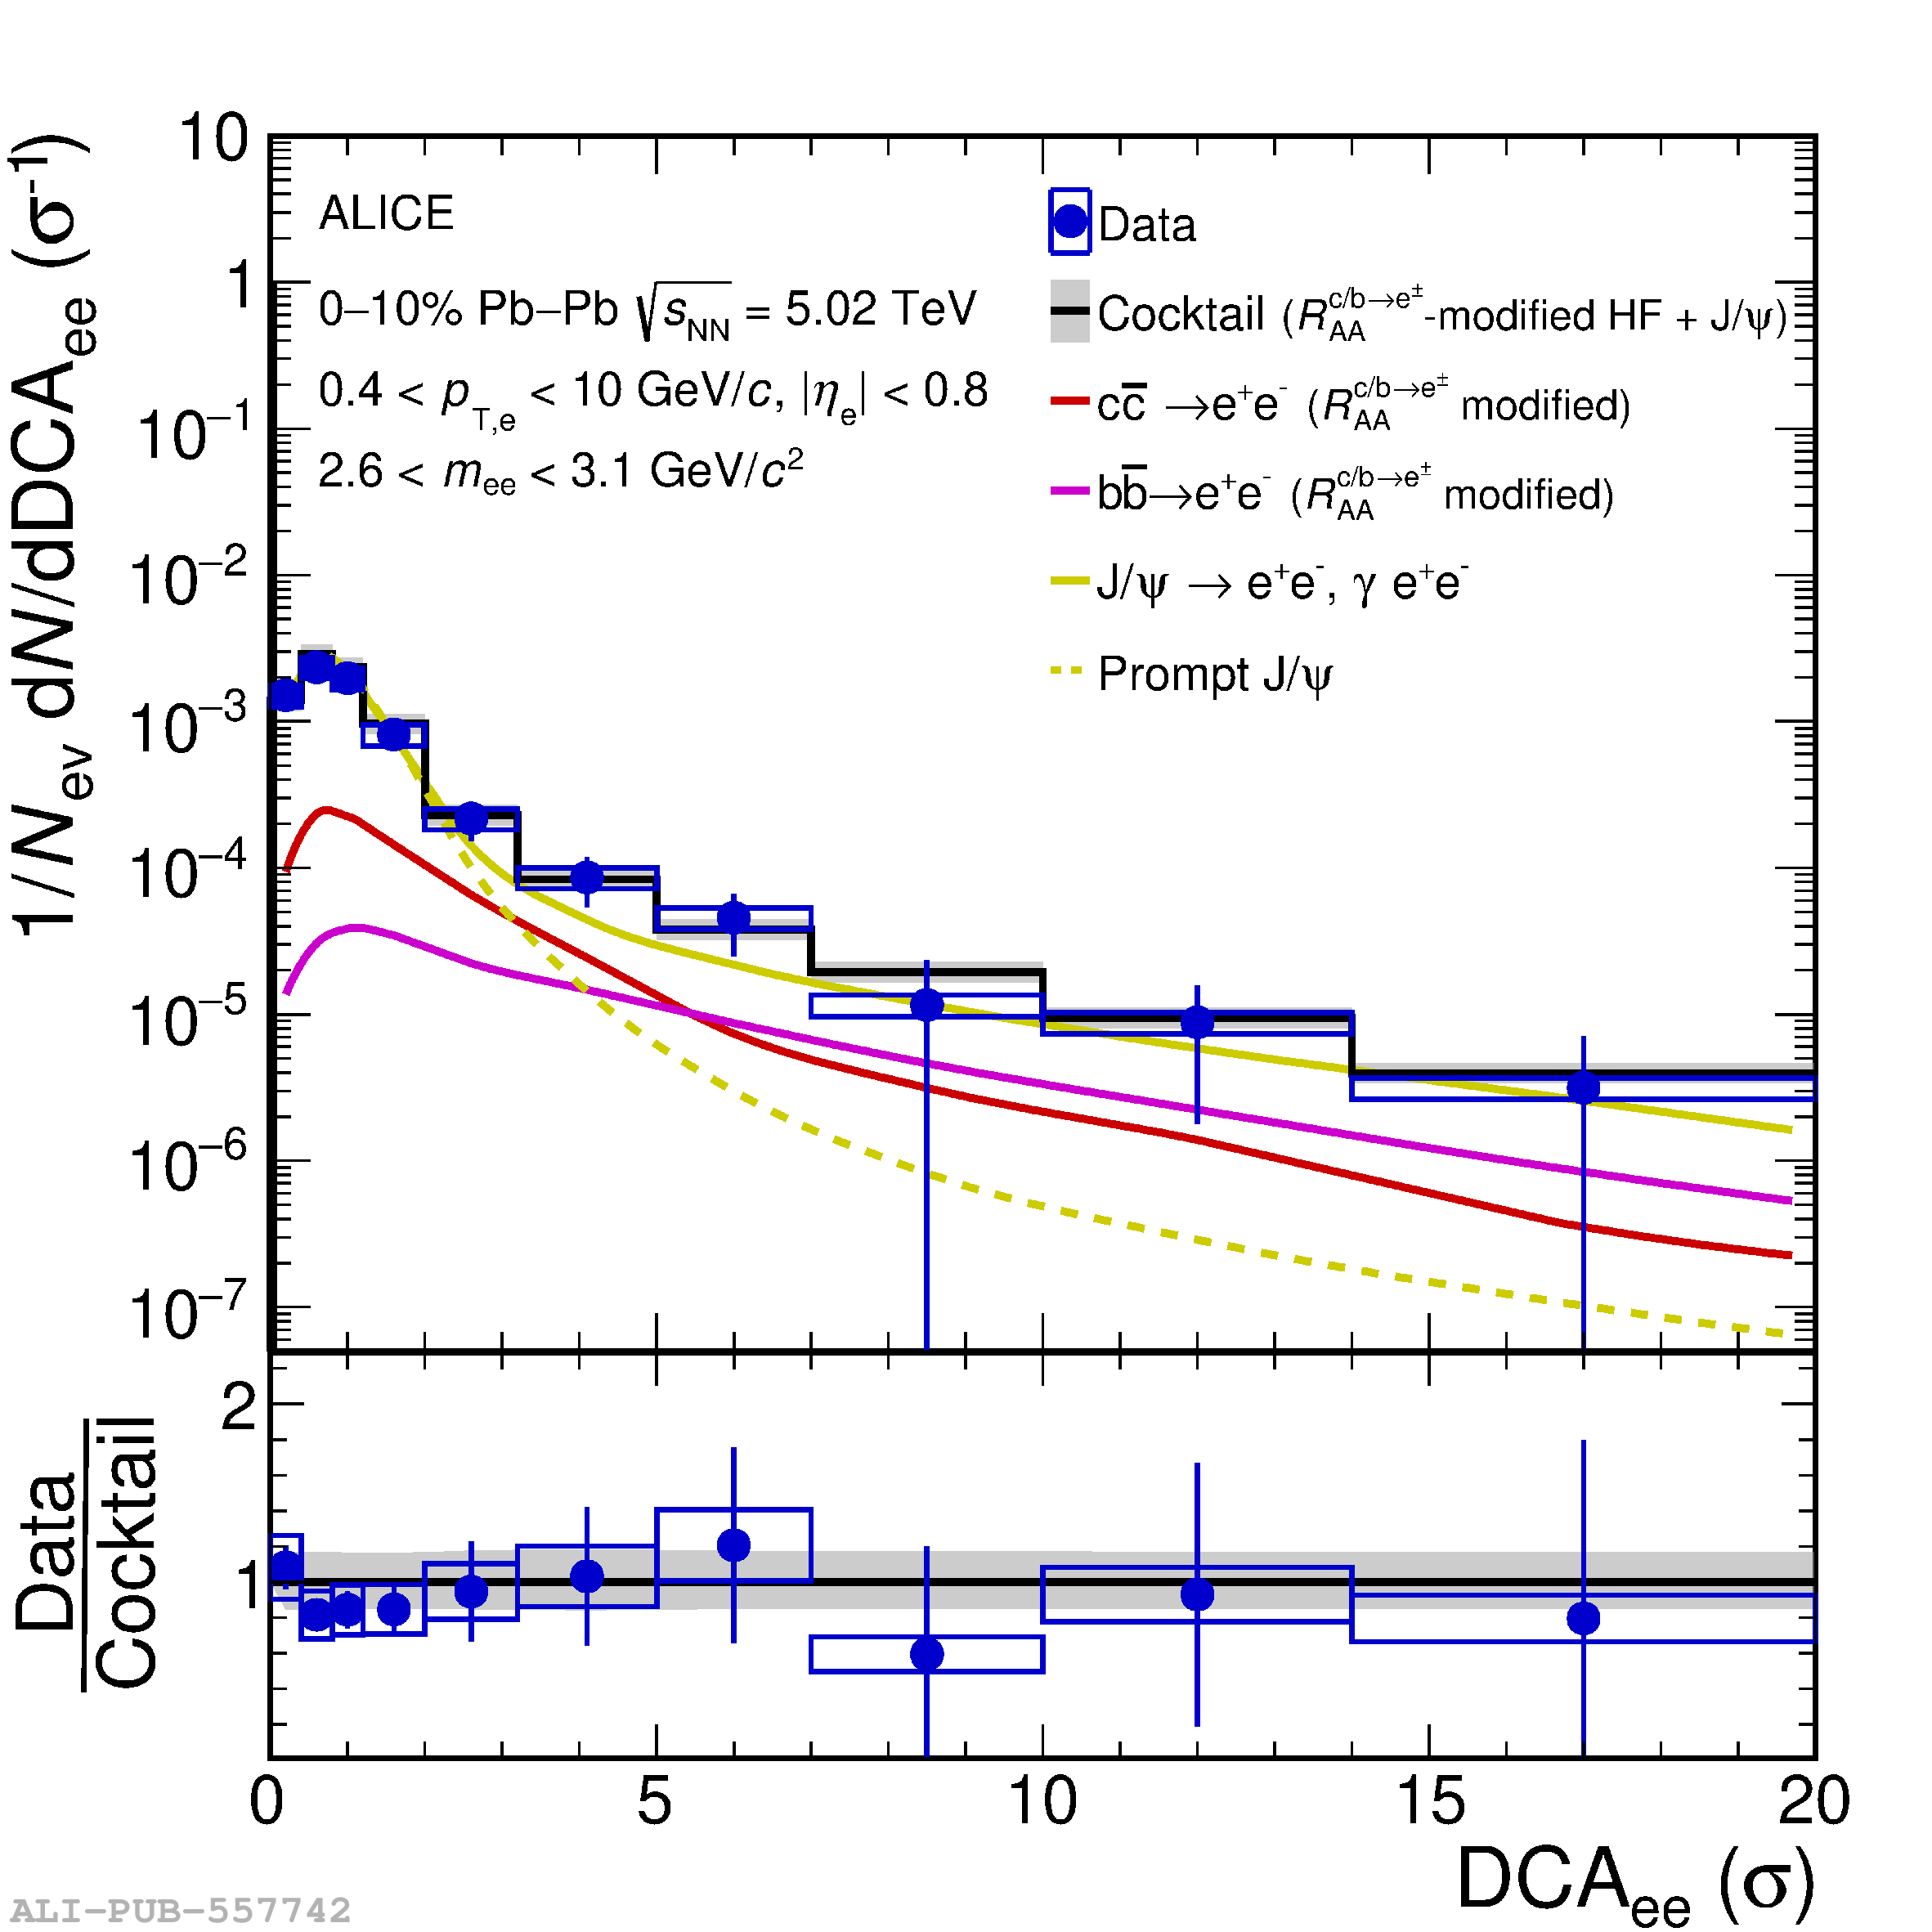 |