First measurements of hadron(h)$-\Lambda$ azimuthal angular correlations in p$-$Pb collisions at $\sqrt{s_{\rm NN}}$ = 5.02 TeV using the ALICE detector at the Large Hadron Collider are presented. These correlations are used to separate the production of associated $\Lambda$ baryons into three different kinematic regions, namely those produced in the direction of the trigger particle (near-side), those produced in the opposite direction (away-side), and those whose production is uncorrelated with the jet axis (underlying event). The per-trigger associated $\Lambda$ yields in these regions are extracted, along with the near- and away-side azimuthal peak widths, and the results are studied as a function of associated particle $p_{\rm T}$ and event multiplicity. Comparisons with the DPMJET event generator and previous measurements of the $\phi(1020)$ meson are also made. The final results indicate that strangeness production in the highest multiplicity p$-$Pb collisions is enhanced relative to low multiplicity collisions in both the jet-like regions and the underlying event. The production of $\Lambda$ relative to charged hadrons is also enhanced in the underlying event when compared to the jet-like regions. Additionally, the results hint that strange quark production in the away-side of the jet is modified by soft interactions with the underlying event.
Phys. Rev. C 111 (2025) 015201
HEP Data
e-Print: arXiv:2405.19855 | PDF | inSPIRE
CERN-EP-2024-146
Figure group
Figure 1
Invariant mass distributions of $\Lambda$ candidates in events with a trigger hadron for the lower ($1.5 < \pt < 2.5$ GeV/$c$, left) and higher ($2.5 < \pt < 4.0$ GeV/$c$, right) associated momentum ranges. A double-sided Crystal Ball + linear background function is used to fit the data. The signal and side-band (SB) regions are highlighted in green and orange, respectively. The SB region is used to subtract the combinatorial background from the correlation distributions. |   |
Figure 2
Examples of the h$-$$\Lambda$ single-particle efficiency-corrected same-event distribution $S(\Delta\varphi, \Delta\eta)$ (left), mixed-event distribution $B(\Delta\varphi, \Delta\eta)$ (middle), and fully corrected correlation function $C_{\text{yield}}(\Delta\varphi, \Delta\eta)$ (right), taken in the 20$-$50% multiplicity class. | 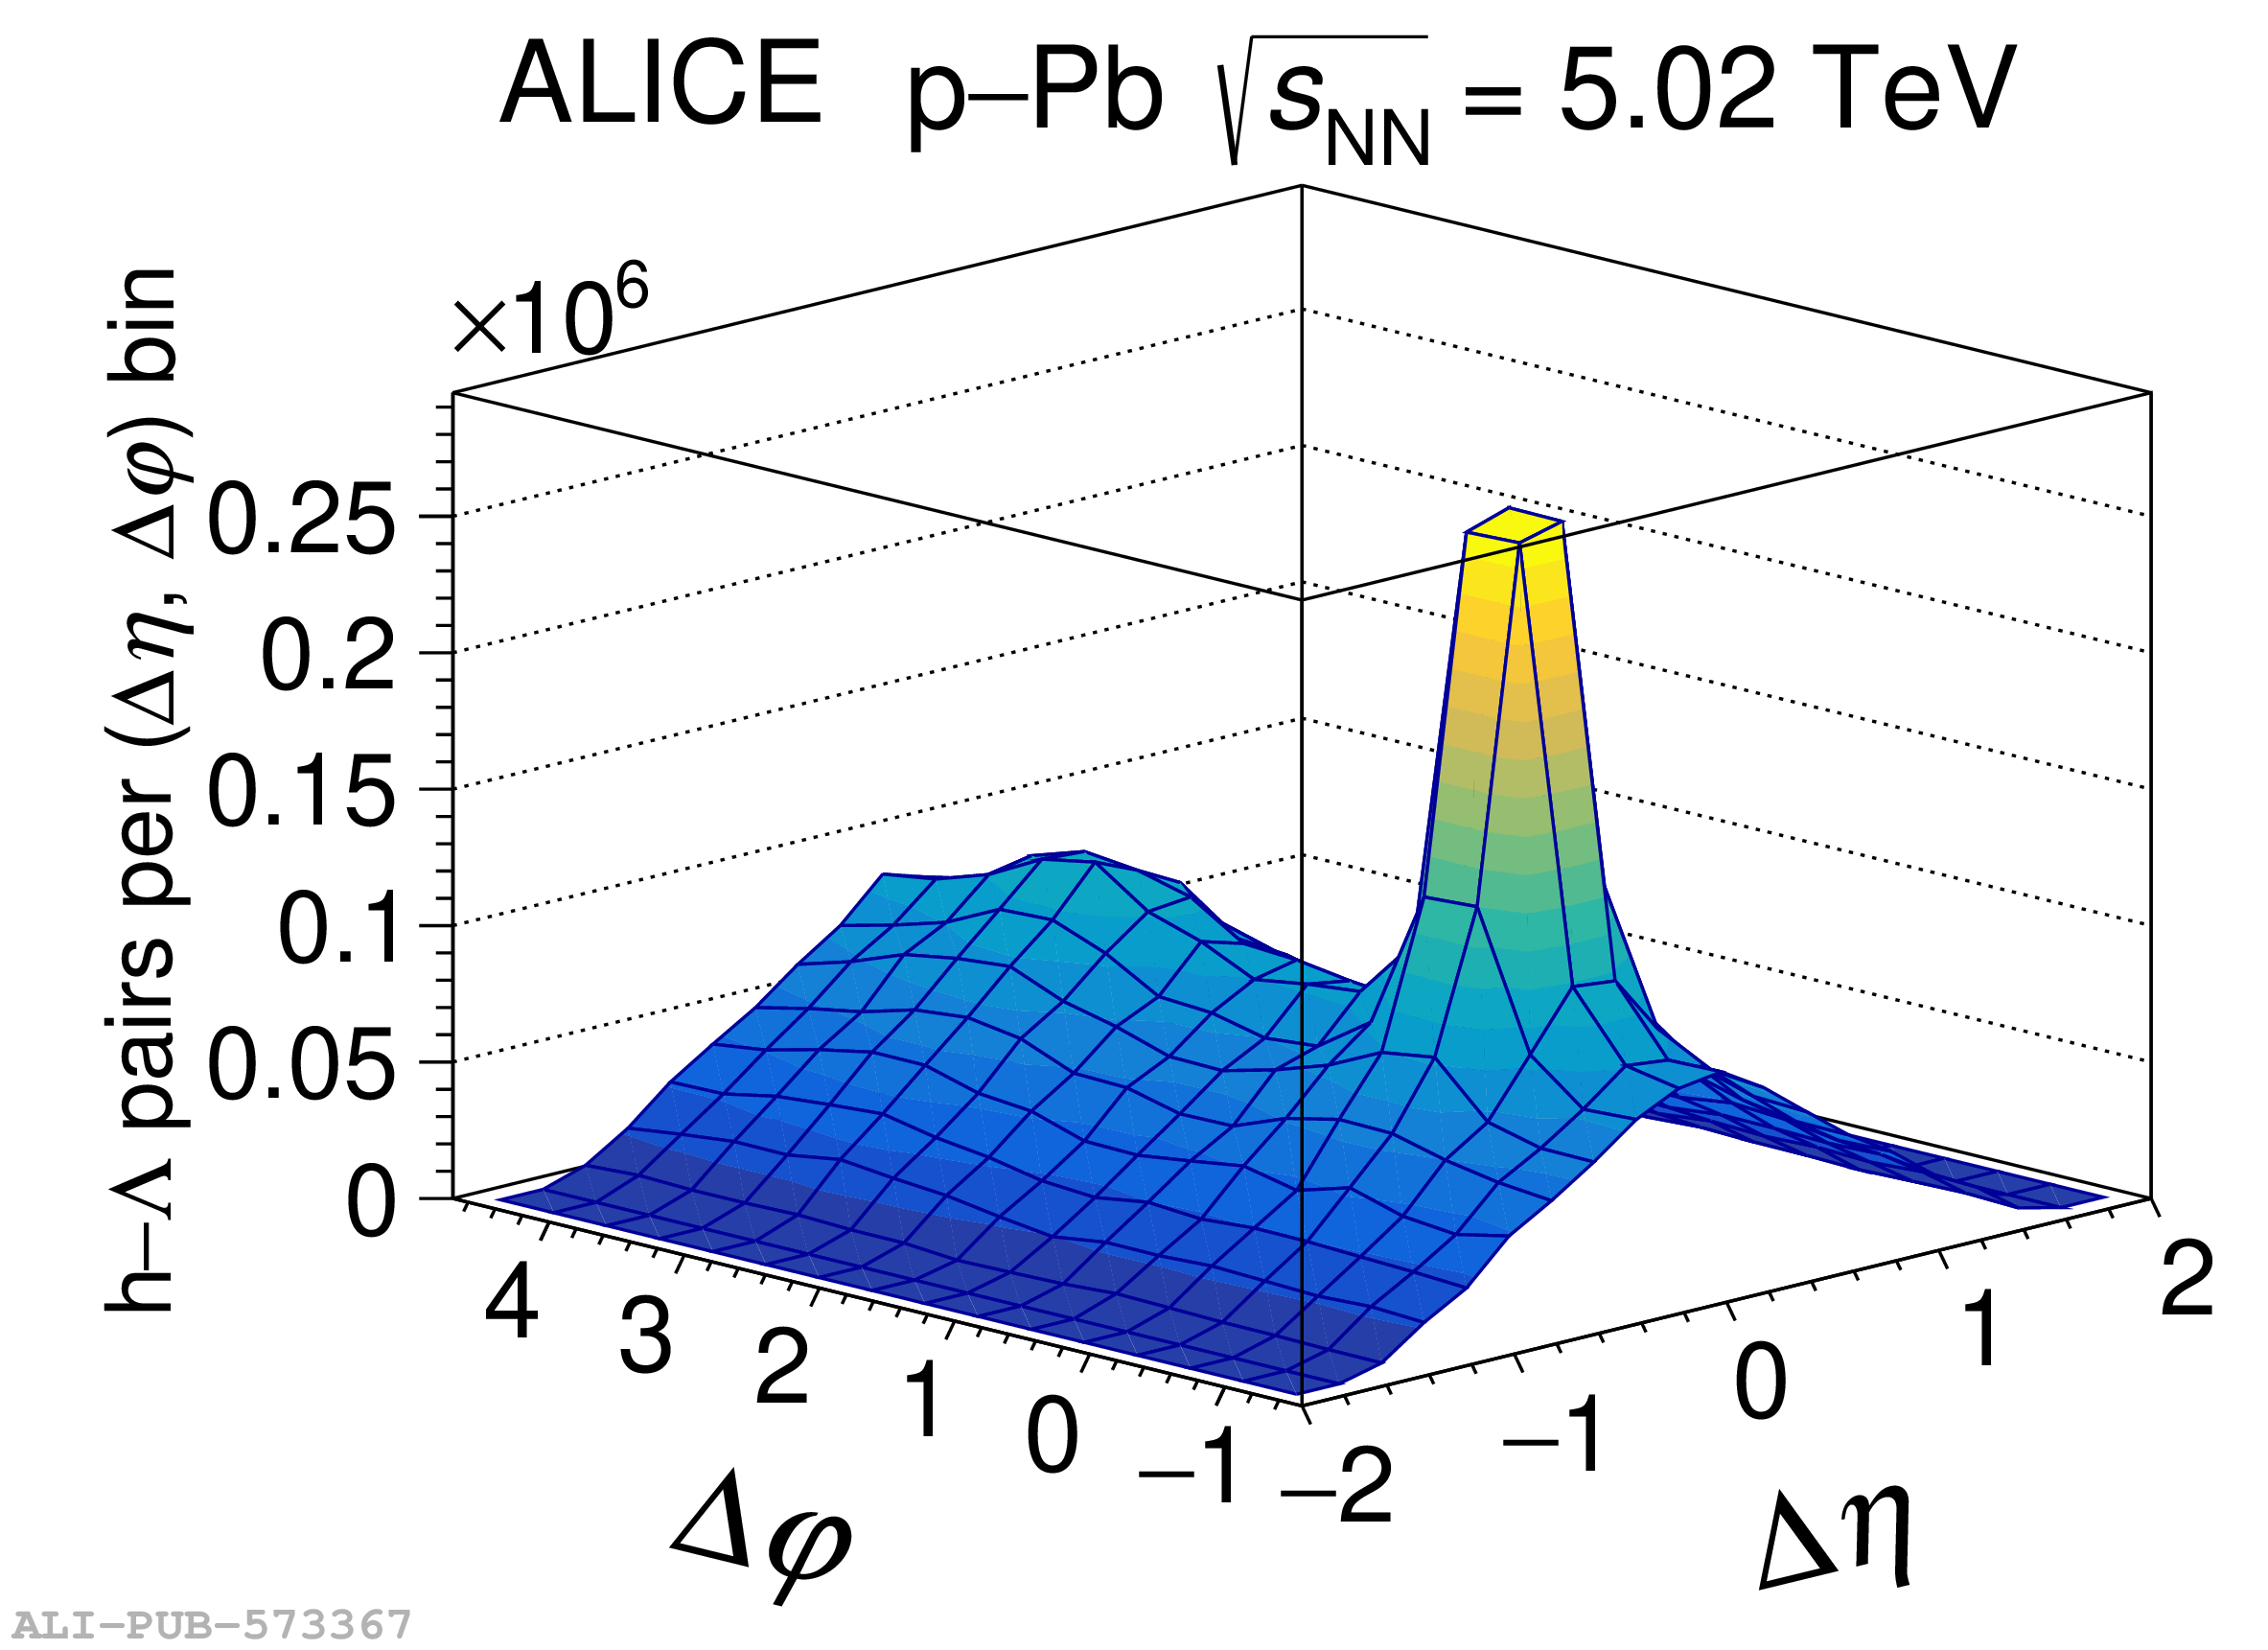   |
Figure 3
The h$-$$\Lambda$ (top) and h$-$h (bottom) $\Delta\varphi$ distributions for each multiplicity class with $4.0 < p_{\text{T,trig}} < 8.0$ GeV/$c$ and $1.5 < p_{\text{T,assoc}} < 2.5$ GeV/$c$, with statistical (systematic) uncertainties shown as vertical lines (shaded boxes). The multiplicity classes are plotted from the most central (left) to the least central (right). The total fit to the data (Eq. 7) is shown as a solid line, and the UE estimate with the $v_{2}$ assumption is shown as a dashed line. |  |
Figure 4
The h$-$$\Lambda$ (top) and h$-$h (bottom) $\Delta\varphi$ distributions for each multiplicity class with $4.0 < p_{\text{T,trig}} < 8.0$ GeV/$c$ and $2.5 < p_{\text{T,assoc}} < 4.0$ GeV/$c$, with statistical (systematic) uncertainties shown as vertical lines (shaded boxes). The multiplicity classes are plotted from the most central (left) to the least central (right). The total fit to the data (Eq. 7) is shown as a solid line, and the UE estimate with the $v_{2}$ assumption is shown as a dashed line. | 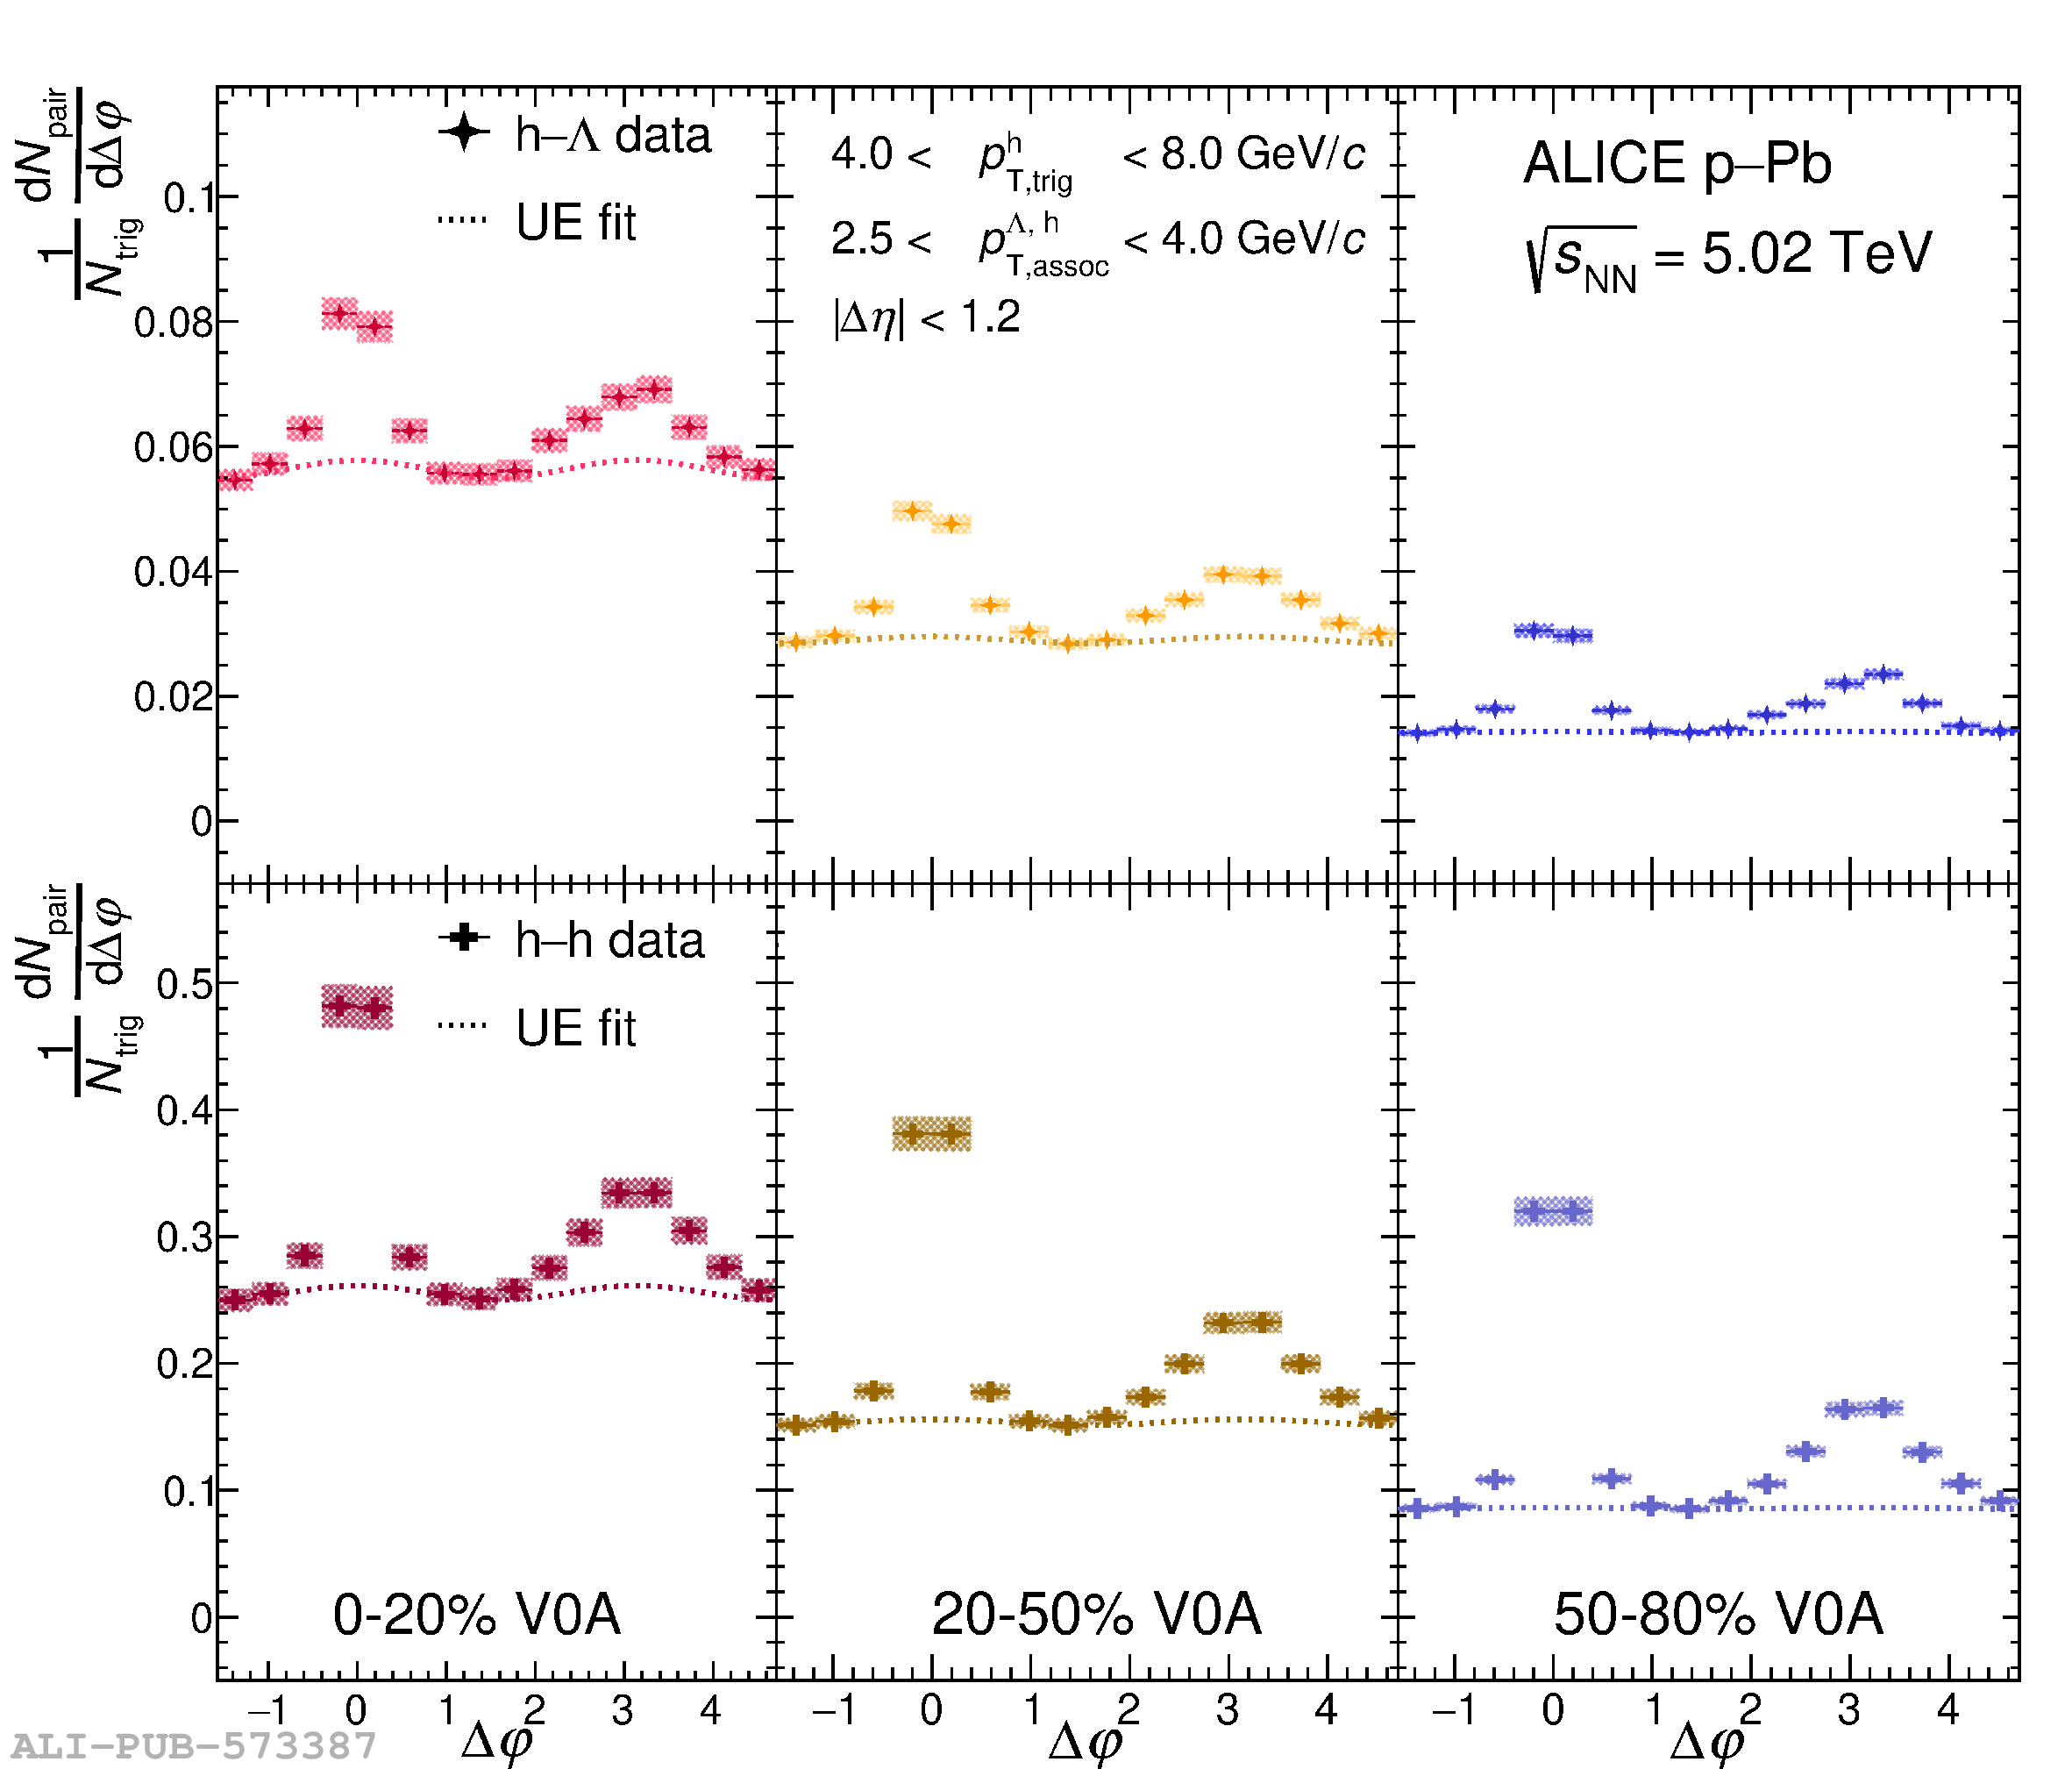 |
Figure 5
The per-trigger pair-wise yields $Y_{\text{near}}, Y_{\text{away}}$ as a function of charged particle multiplicity for the h$-$$\Lambda$ (square markers) and h$-$h (circle markers) correlations in the lower (left) and higher (right) associated $\pt$ ranges. The statistical (systematic) uncertainties are shown as vertical lines (boxes). The same yields predicted by DPMJET are shown as shaded bands, with the width of the band representing the uncertainty of the model. The h$-$$\Lambda$ yields (data and DPMJET) have been scaled by a factor of 20 to increase visibility. The ratios of the model to the data are also shown as shaded bands in the bottom panels, where the width of the band represents the uncertainty of the ratio. A dashed line is drawn at unity for reference. |  |
Figure 6
The per-trigger pair-wise yield ratios $R_{i}^{\Lambda/\text{h}} \equiv Y_{i}^{\text{h--}\Lambda}$/$Y_{i}^{\text{h--h}}$ ($i$ = near-side, away-side, UE) as a function of multiplicity in the lower (left) and higher (right) associated momentum ranges. The statistical (systematic) uncertainties are shown as vertical lines (boxes). Linear fits to the data are given as dashed lines. The ratios predicted by DPMJET are presented as shaded bands, with the width of the band representing the uncertainty of the model. The ratios of the model to the data are also shown as shaded bands in the bottom panels, where the width of the band represents the uncertainty of the ratio. |  |
Figure 7
The h$-$$\Lambda$ and h$-$h near- and away-side peak widths shown as a function of multiplicity for both associated momentum ranges. The statistical (systematic) uncertainties are shown as vertical lines (boxes). The widths predicted by DPMJET are presented as shaded bands, with the width of the band representing the uncertainty of the model. The ratios of the model to the data are also shown as shaded bands in the bottom panels, where the width of the band represents the uncertainty of the ratio. A dashed line is drawn at unity for reference. |  |
Figure 8
The per-trigger pair-wise yield ratios $R_{i}^{\Lambda/\phi} \equiv Y_{i}^{\text{h--}\Lambda}$/$Y_{i}^{\text{h--}\phi}$ ($i$ = near-side, away-side, UE) as a function of multiplicity in the lower (left) and higher (right) associated momentum ranges. The statistical (systematic) uncertainties are shown as vertical lines (boxes). The ratios predicted by DPMJET are shown as shaded bands, with the width of the band representing the uncertainty of the model. The ratios of the model to the data are also given as shaded bands in the bottom panels, where the width of the band represents the uncertainty of the ratio. |  |