The h$-$$\Lambda$ (top) and h$-$h (bottom) $\Delta\varphi$ distributions for each multiplicity class with $4.0 < p_{\text{T,trig}} < 8.0$ GeV/$c$ and $2.5 < p_{\text{T,assoc}} < 4.0$ GeV/$c$, with statistical (systematic) uncertainties shown as vertical lines (shaded boxes). The multiplicity classes are plotted from the most central (left) to the least central (right). The total fit to the data (Eq. 7) is shown as a solid line, and the UE estimate with the $v_{2}$ assumption is shown as a dashed line. | 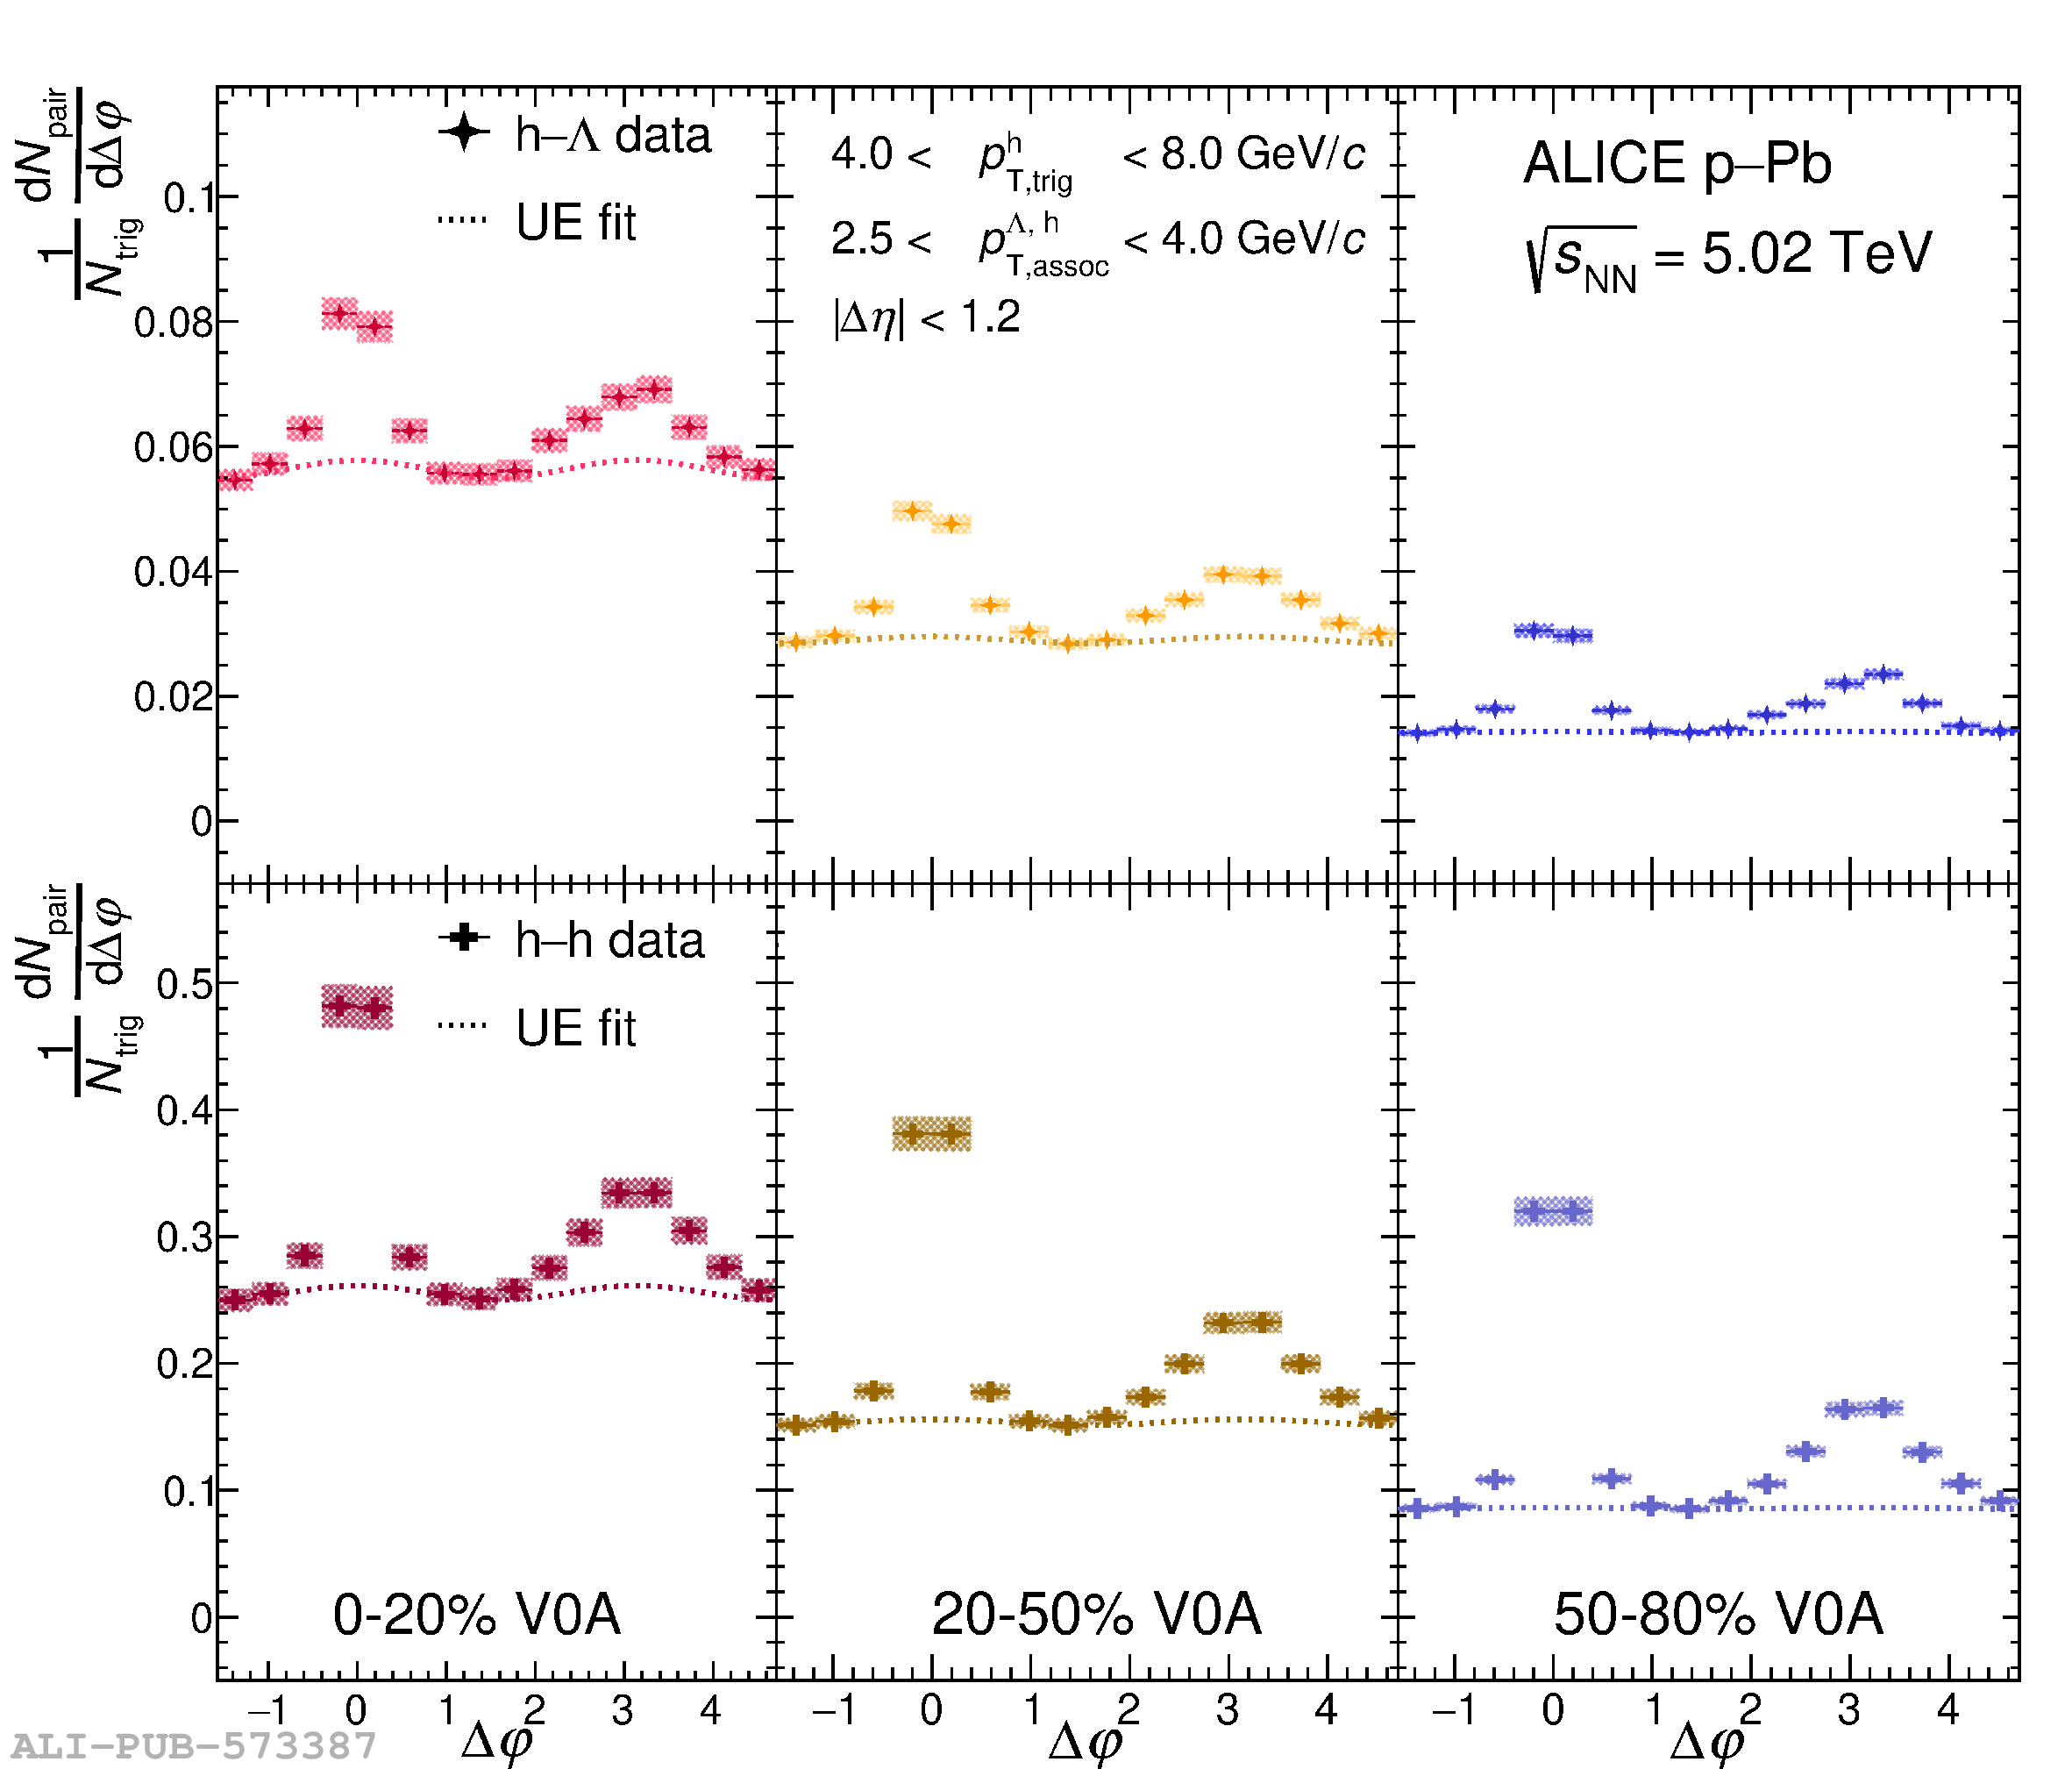 |