The lower limit of the first-order flow angle fluctuations, upper limit of the first-order flow magnitude fluctuations, and the flow vector fluctuations as a function of centrality for the $3.0<\pt<4.0$ GeV/c. The lower and upper limits are denoted by the arrows. The top panel shows the absolute contribution and the bottom panel the contribution relative to the overall flow vector fluctuations. Comparisons to AMPT are shown as coloured bands. | 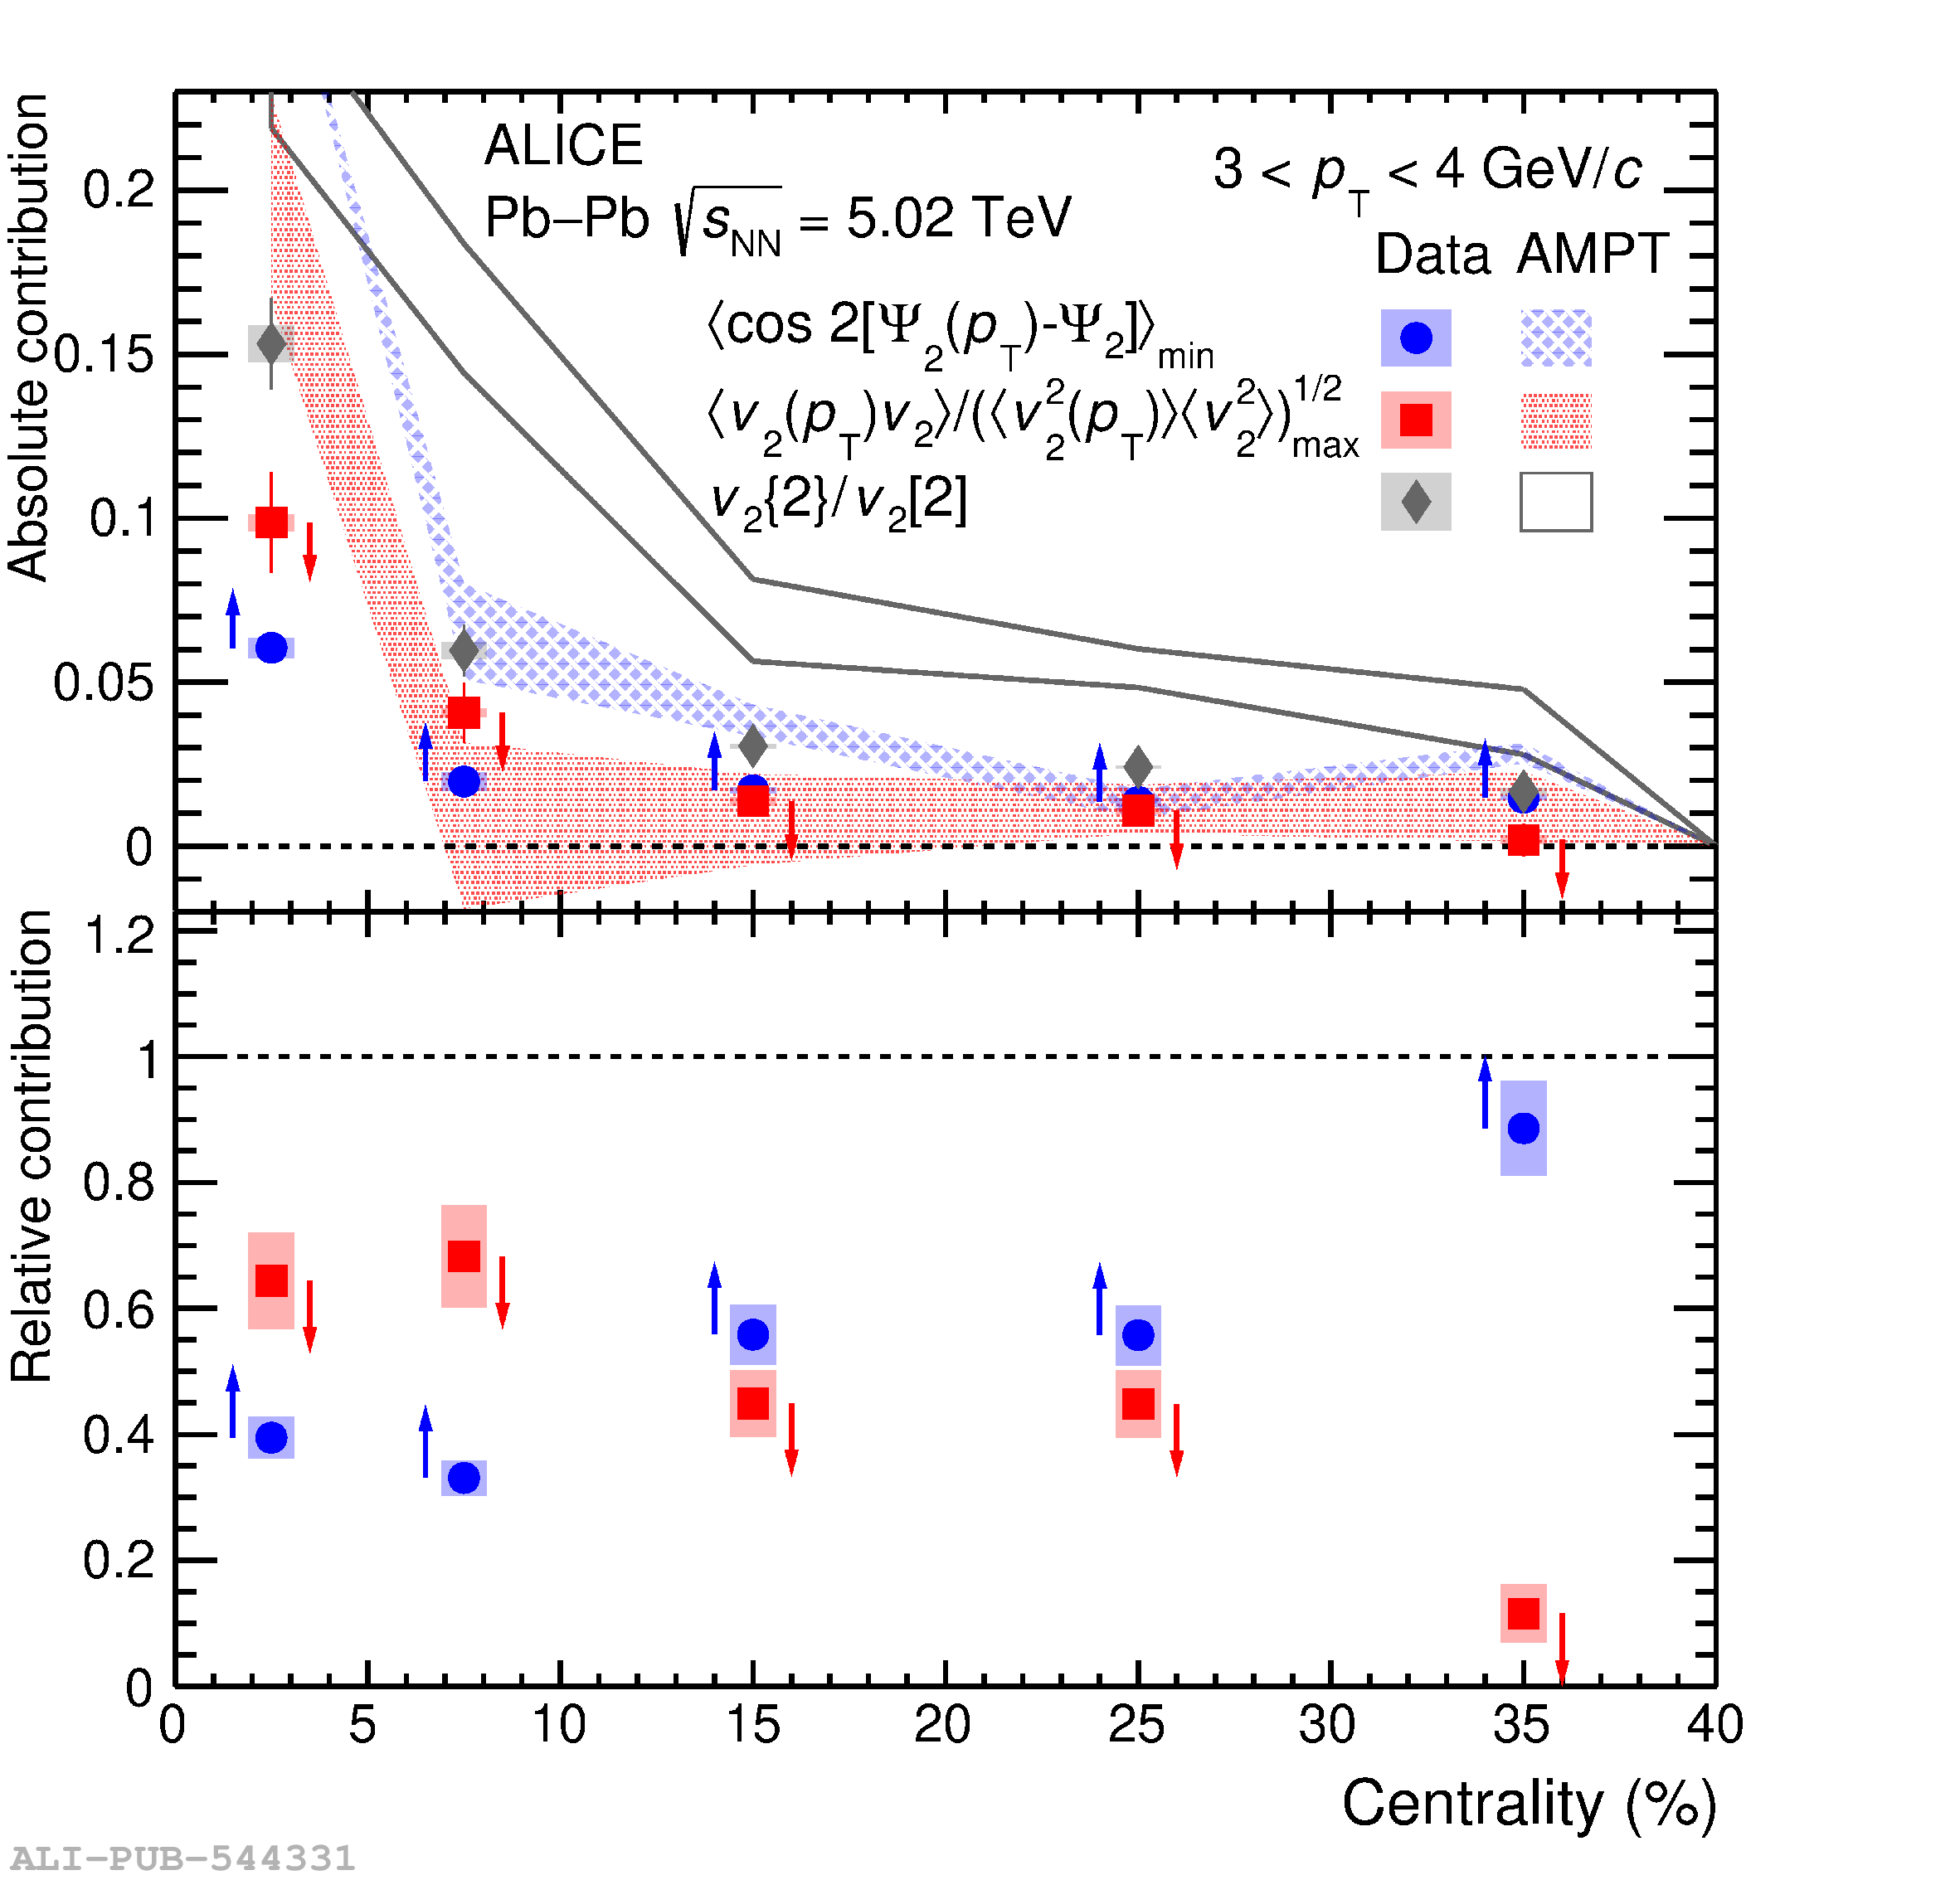 |