Observation of flow angle and flow magnitude fluctuations in Pb-Pb collisions at $\sqrt{s_{\rm NN}}$ = 5.02 TeV at the CERN Large Hadron Collider

This Letter reports on the first measurements of transverse momentum dependent flow angle $\Psi_n$ and flow magnitude $v_n$ fluctuations, determined using new four-particle correlators. The measurements are performed for various centralities in Pb-Pb collisions at a centre-of-mass energy per nucleon pair of $\sqrt{s_{\rm NN}}$ = 5.02 TeV with ALICE at the CERN Large Hadron Collider. Both flow angle and flow magnitude fluctuations are observed in the presented centrality ranges and are strongest in the most central collisions and for a transverse momentum $p_{\rm T}>2$ GeV/$c$. Comparison with theoretical models, including iEBE-VISHNU, MUSIC, and AMPT, show that the measurements exhibit unique sensitivities to the initial state of heavy-ion collisions.


Phys. Rev. C 107 (2023) L051901
HEP Data
e-Print: arXiv:2206.04574 | PDF | inSPIRE
CERN-EP-2022-121
Figure group

Figure 1

The flow angle fluctuation $A_2^{\rm F}$ in Pb$-$Pb collisions at $\sqrt{s_{\rm NN}}$ = 5.02 TeV as a function of the transverse momentum, $\pt$, in centrality classes 0$-$5% (left), 10$-$20% (middle), and 30$-$40% (right). Comparison with iEBE-VISHNU with TRENTO initial conditions and $\eta/s(T)$, MUSIC with Glauber initial conditions and $\eta/s=0.08$, MUSIC with TRENTO initial conditions and $\eta/s=0.08,0.12,0.16$, and AMPT are shown as coloured bands.

Figure 2

The flow magnitude fluctuation $M_2^{\rm f}$ in Pb$-$Pb collisions at $\sqrt{s_{\rm NN}}$ = 5.02 TeV as a function of the transverse momentum, $\pt$, in centrality classes 0$-$5% (left), 10$-$20% (middle), and 30$-$40% (right). Comparison with iEBE-VISHNU with TRENTO initial conditions and $\eta/s(T)$, MUSIC with Glauber initial conditions and $\eta/s=0.08$, MUSIC with TRENTO initial conditions and $\eta/s=0.08,0.12,0.16$, and AMPT are shown as coloured bands.

Figure 3

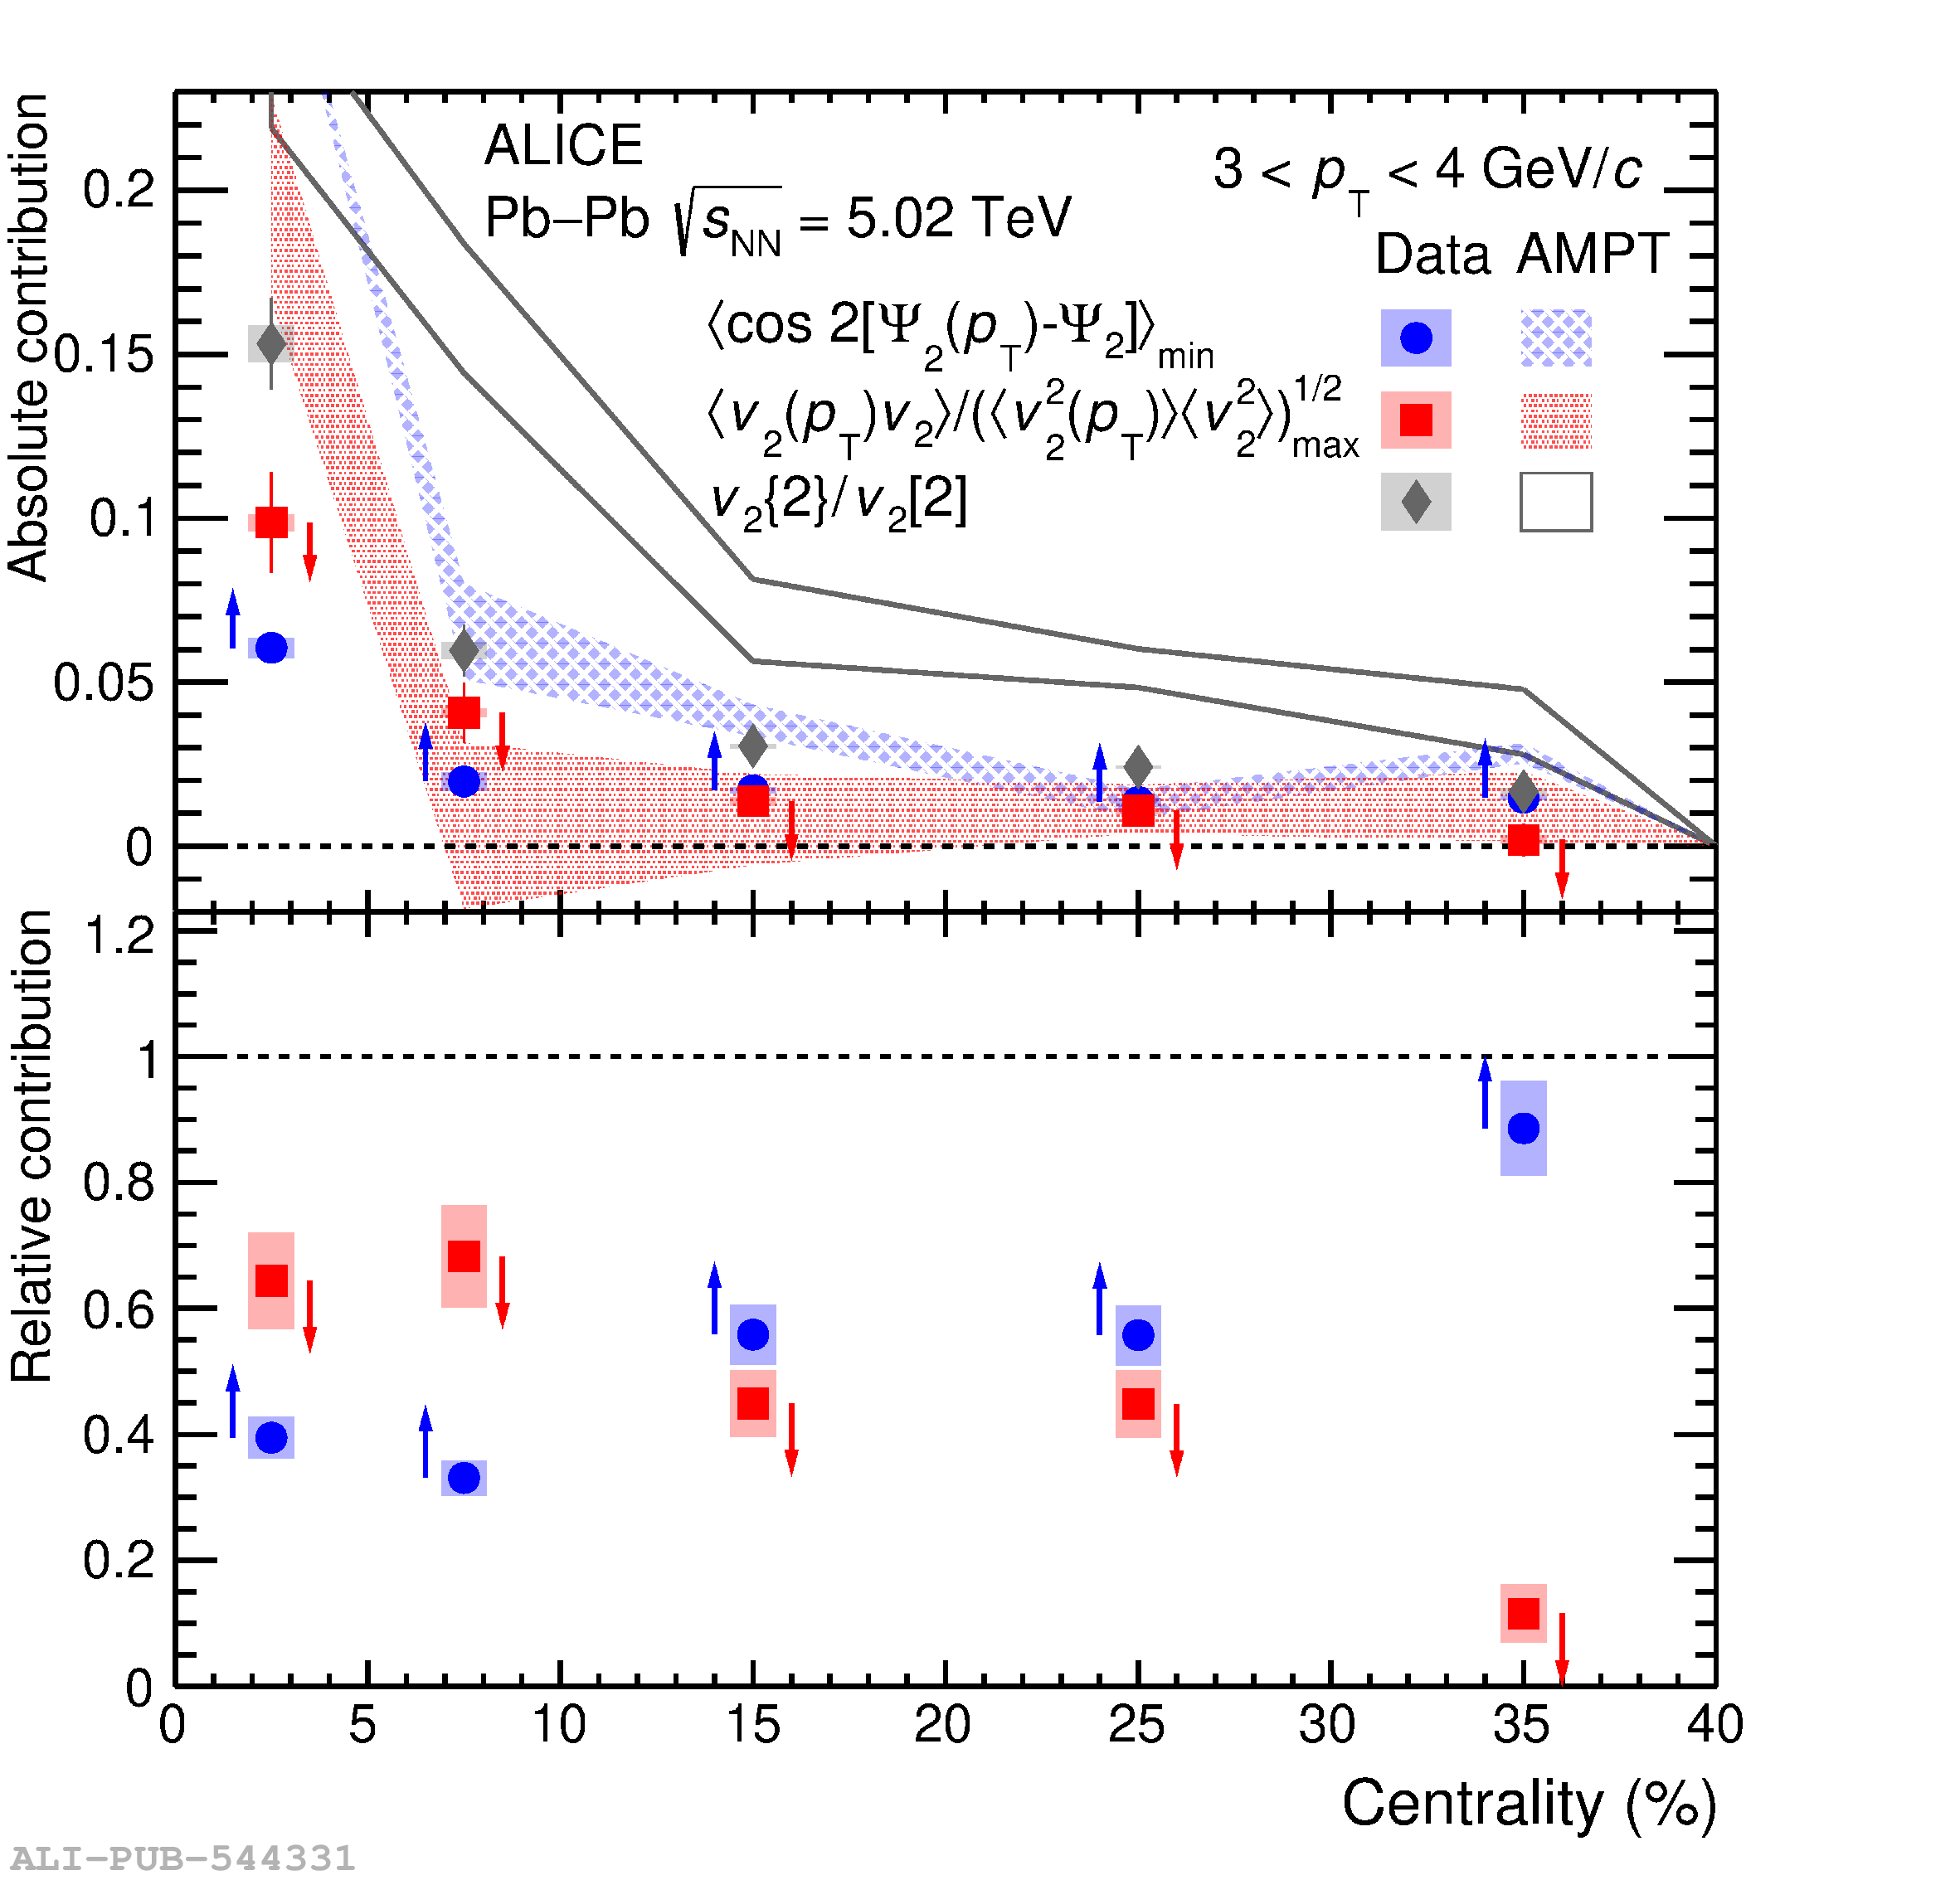
The lower limit of the first-order flow angle fluctuations, upper limit of the first-order flow magnitude fluctuations, and the flow vector fluctuations as a function of centrality for the $3.0<\pt<4.0$ GeV/c. The lower and upper limits are denoted by the arrows. The top panel shows the absolute contribution and the bottom panel the contribution relative to the overall flow vector fluctuations. Comparisons to AMPT  are shown as coloured bands.