($K^-p$ $\oplus$ $K^+\overline{p}$) correlation functions obtained in Pb-Pb collisions at $\sqrt{s_{\mathrm{NN}}}$ in the 60-70% (left), 70-80% (middle) and 80-90% (right) centrality intervals. The measurement is shown by the black markers, the vertical error bars and the boxes represent the statistical and systematic uncertainties respectively. The red and blue bands in the upper panels represent the model calculations and their systematic uncertainty as described in the text. The $r_\mathrm{core}$ and $r_{\rm eff}$ values of the source are reported with their statistical and systematical uncertainties, respectively. Bottom panels represent the data-to-model comparison as described in the text. | 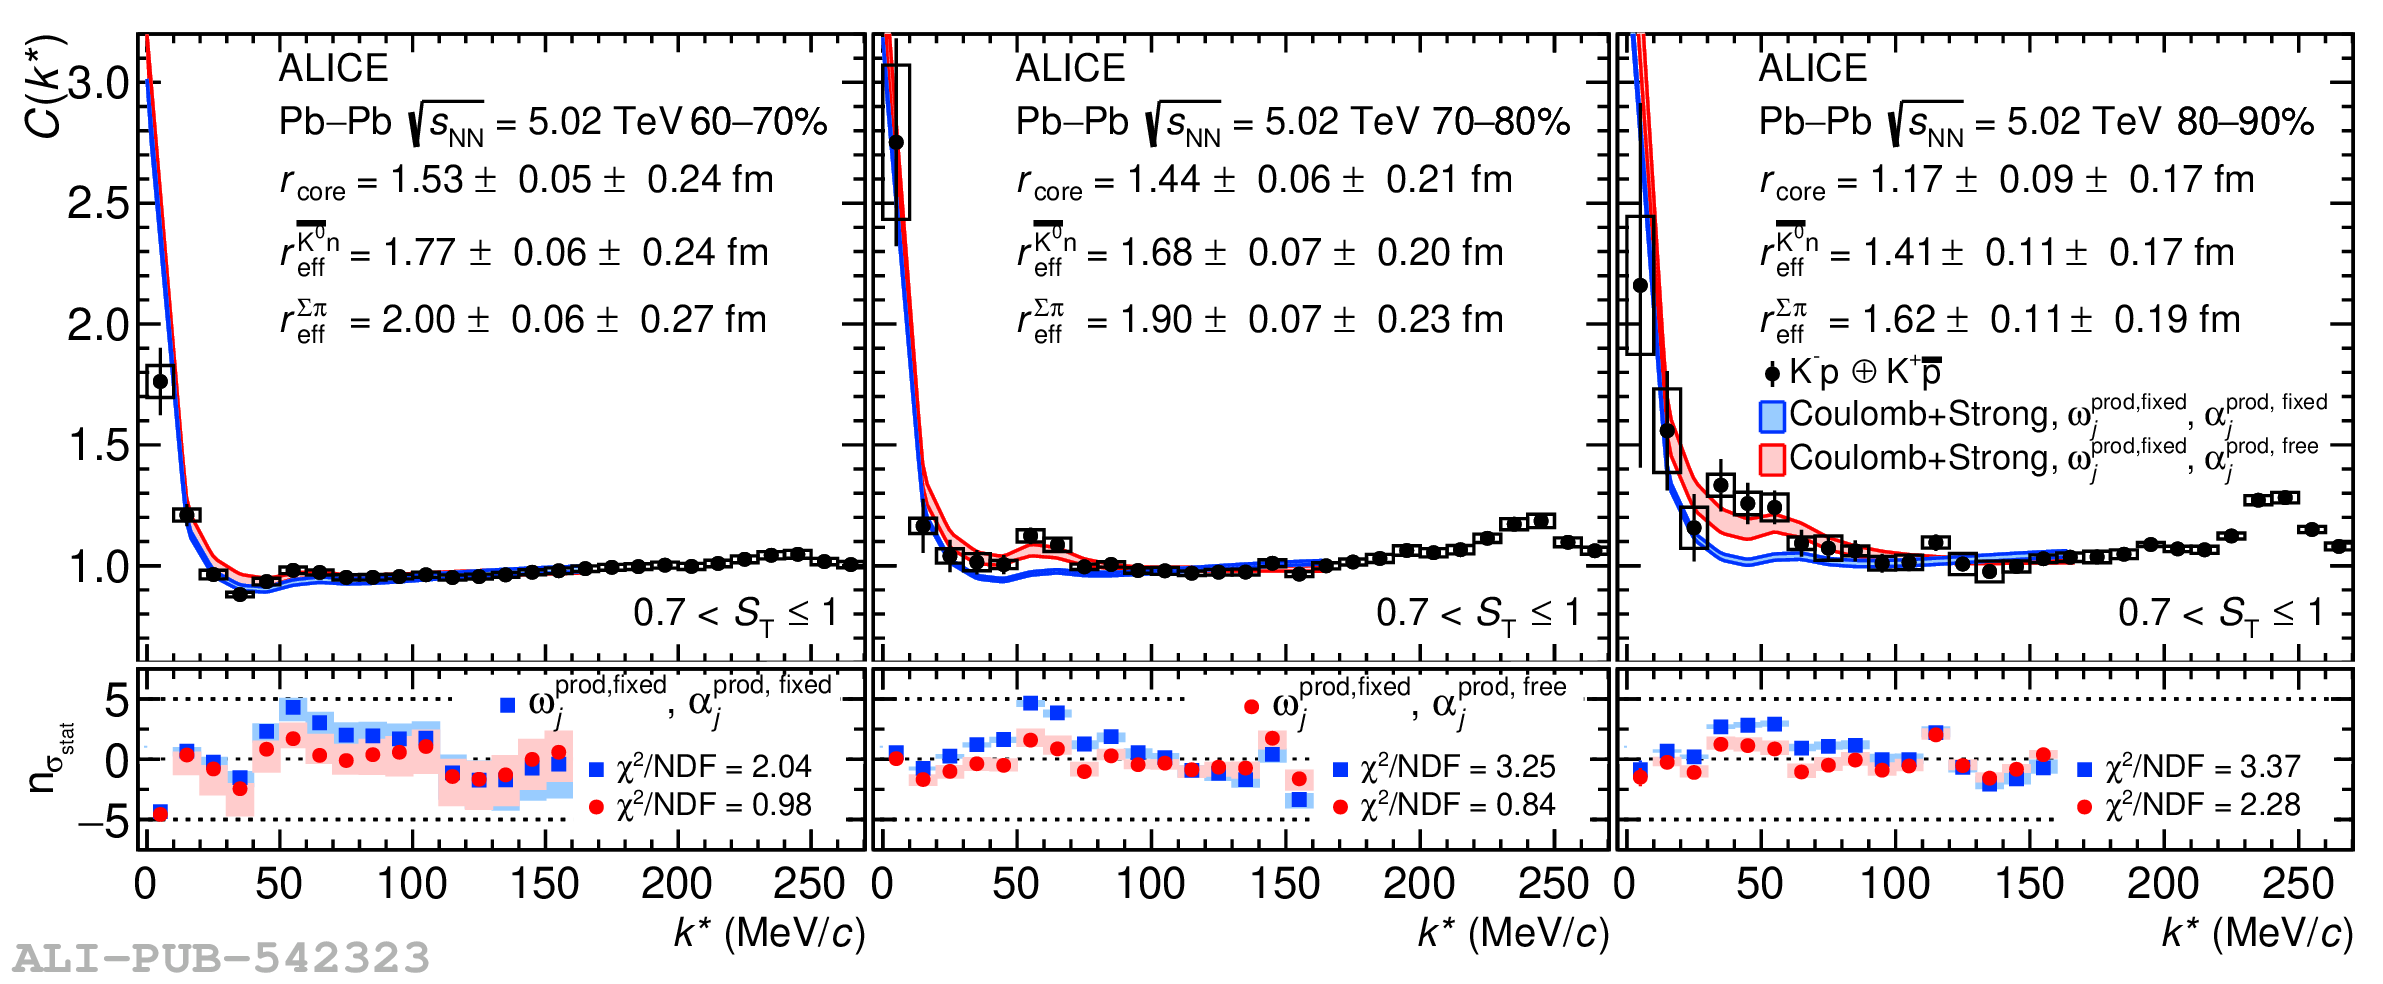 |