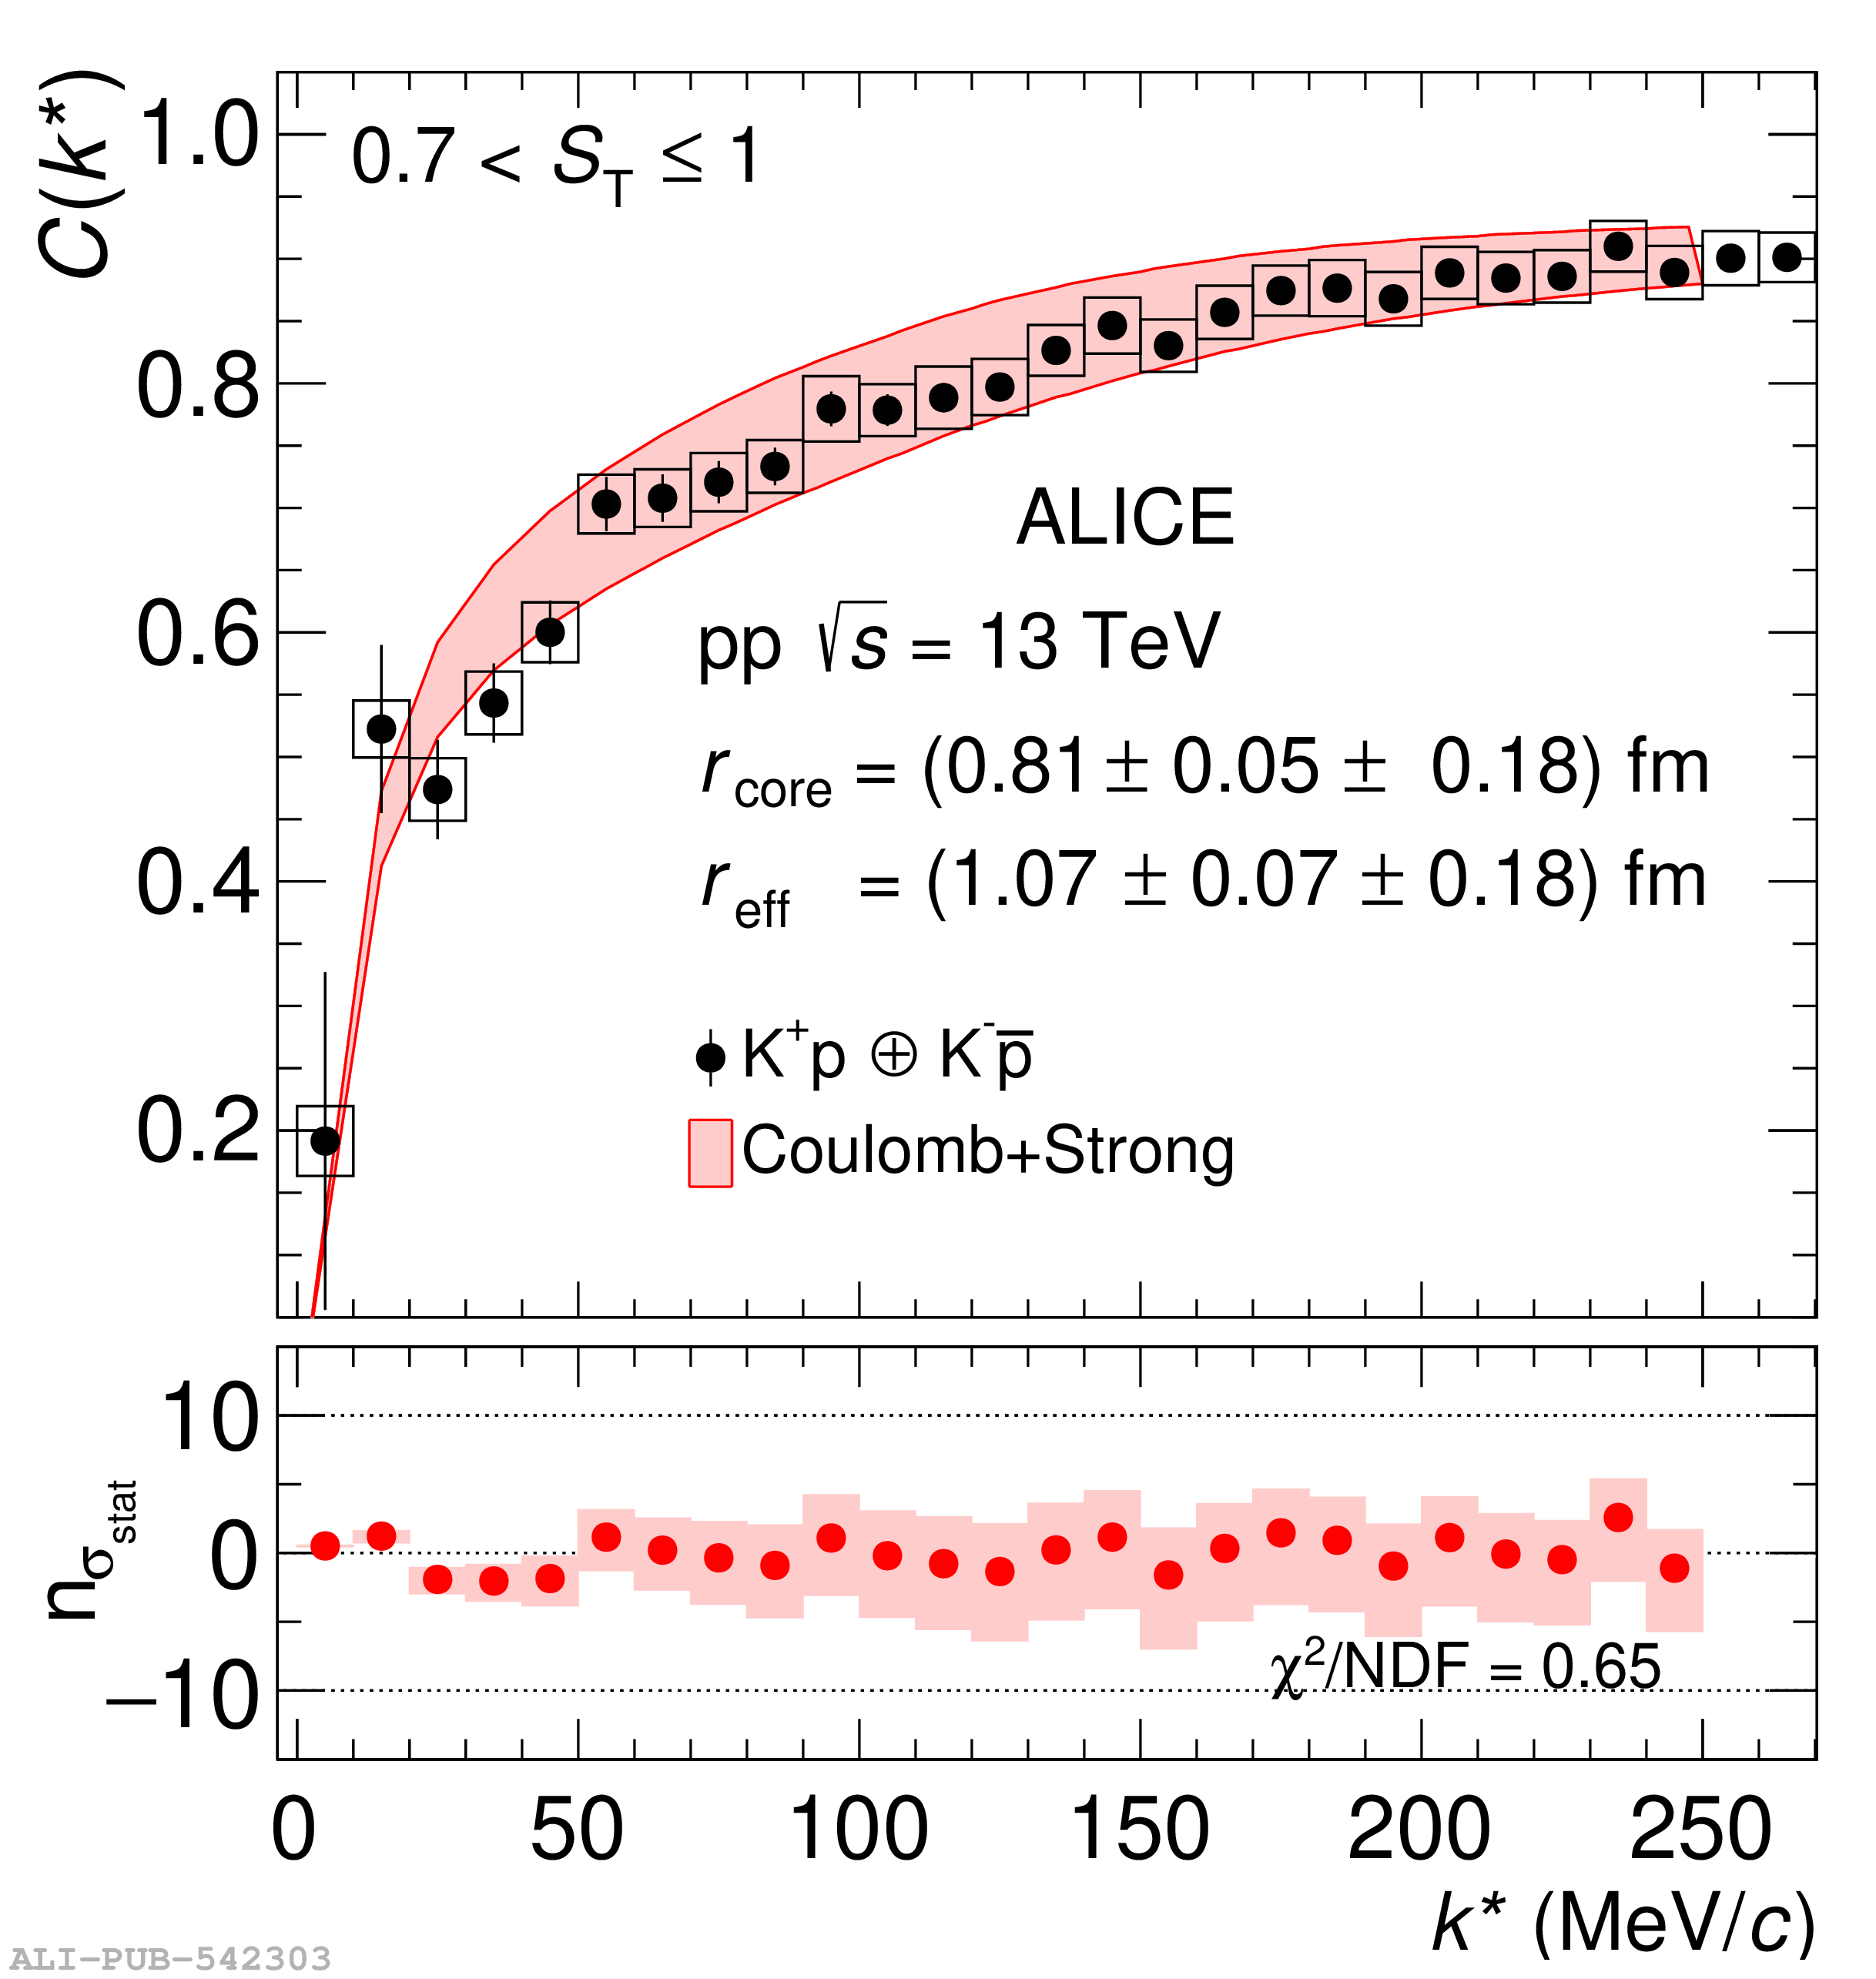
$K^+p$ ($K^+p$ $\oplus$ $K^-\overline{p}$) correlation function obtained in pp collisions at $\sqrt{s}$ = 13 TeV. The measured data points are taken from Ref.[38] and are corrected for finite experimental momentum resolution and for residual correlations as described in Section 4.1. Measured data are shown by the black markers, the vertical error bars and the boxes represent the statistical and systematic uncertainties, respectively. The red band in the upper panel represents the model calculation and its systematic uncertainty as described in the text. The $r_\mathrm{core}$ and $r_{\rm eff}$ values of the source are reported with their statistical and systematical uncertainties, respectively. Bottom panels represent the data-to-model comparison.
|  |