The interaction between $\Lambda$ baryons and kaons/antikaons is a crucial ingredient for the strangeness $S=0$ and $S=-2$ sector of the meson$-$baryon interaction at low energies. In particular, the $\Lambda{\mathrm{\overline{K}}}$ might help in understanding the origin of states such as the $\Xi\mathrm{(1620)}$, whose nature and properties are still under debate. Experimental data on $\Lambda$$-$${\mathrm{K}}$ and $\Lambda$$-$${\mathrm{\overline{K}}}$ systems are scarce, leading to large uncertainties and tension between the available theoretical predictions constrained by such data. In this Letter we present the measurements of $\Lambda$$-$K$^+\oplus \overline{\Lambda}$$-$K$^-$ and $\Lambda$$-$K$^-\oplus \overline{\Lambda}$$-$K$^+$ correlations obtained in the high-multiplicity triggered data sample in pp collisions at $\sqrt{s}=13$ TeV recorded by ALICE at the LHC. The correlation function for both pairs is modeled using the Lednicky$-$Lyuboshits analytical formula and the corresponding scattering parameters are extracted. The $\Lambda$$-$K$^-\oplus \overline{\Lambda}$$-$K$^+$ correlations show the presence of several structures at relative momenta $k^*$ above 200 MeV/$c$, compatible with the $\Omega$ baryon, the $\Xi\mathrm{(1690)}$, and $\Xi\mathrm{(1820)}$ resonances decaying into $\Lambda$$-$K$^-$ pairs. The low $k^*$ region in the $\Lambda$$-$K$^-\oplus \overline{\Lambda}$$-$K$^+$ also exhibits the presence of the $\Xi\mathrm{(1620)}$ state, expected to strongly couple to the measured pair. The presented data allow to access the $\Lambda$K$^+$ and $\Lambda$K$^-$ strong interaction with an unprecedented precision and deliver the first experimental observation of the $\Xi\mathrm{(1620)}$ decaying into $\Lambda$K$^-$.
Phys. Lett. B 845 (2023) 138145
HEP Data
e-Print: arXiv:2305.19093 | PDF | inSPIRE
CERN-EP-2023-106
Figure group
Figure 1
Upper: measured correlation function for $\Lambda K^-$ pairs (empty points) with statistical (line) and systematic (gray boxes) uncertainties. Lower: invariant mass spectrum of $\Lambda K^-$ pairs used to build the measured correlation function. Only the statistical uncertainties are shown. The upper x-axis indicates the energy at rest $E=\sqrt{(k^{\ast})^2+m_\Lambda ^2}+\sqrt{(k^{\ast})^2+m_K ^2}$ of the pair written as a function of the relative momentum of the $\Lambda K^-$ pair. The quantity $E$ corresponds to the invariant mass $M$ of the $\Lambda K^-$ pairs. The colored vertical dashed lines indicate the values of the relative momentum \kstar (upper panel) and the value of the energy $E$ at rest of each resonance (lower panel) corresponding to its nominal mass extracted in the final femtoscopic fit. | 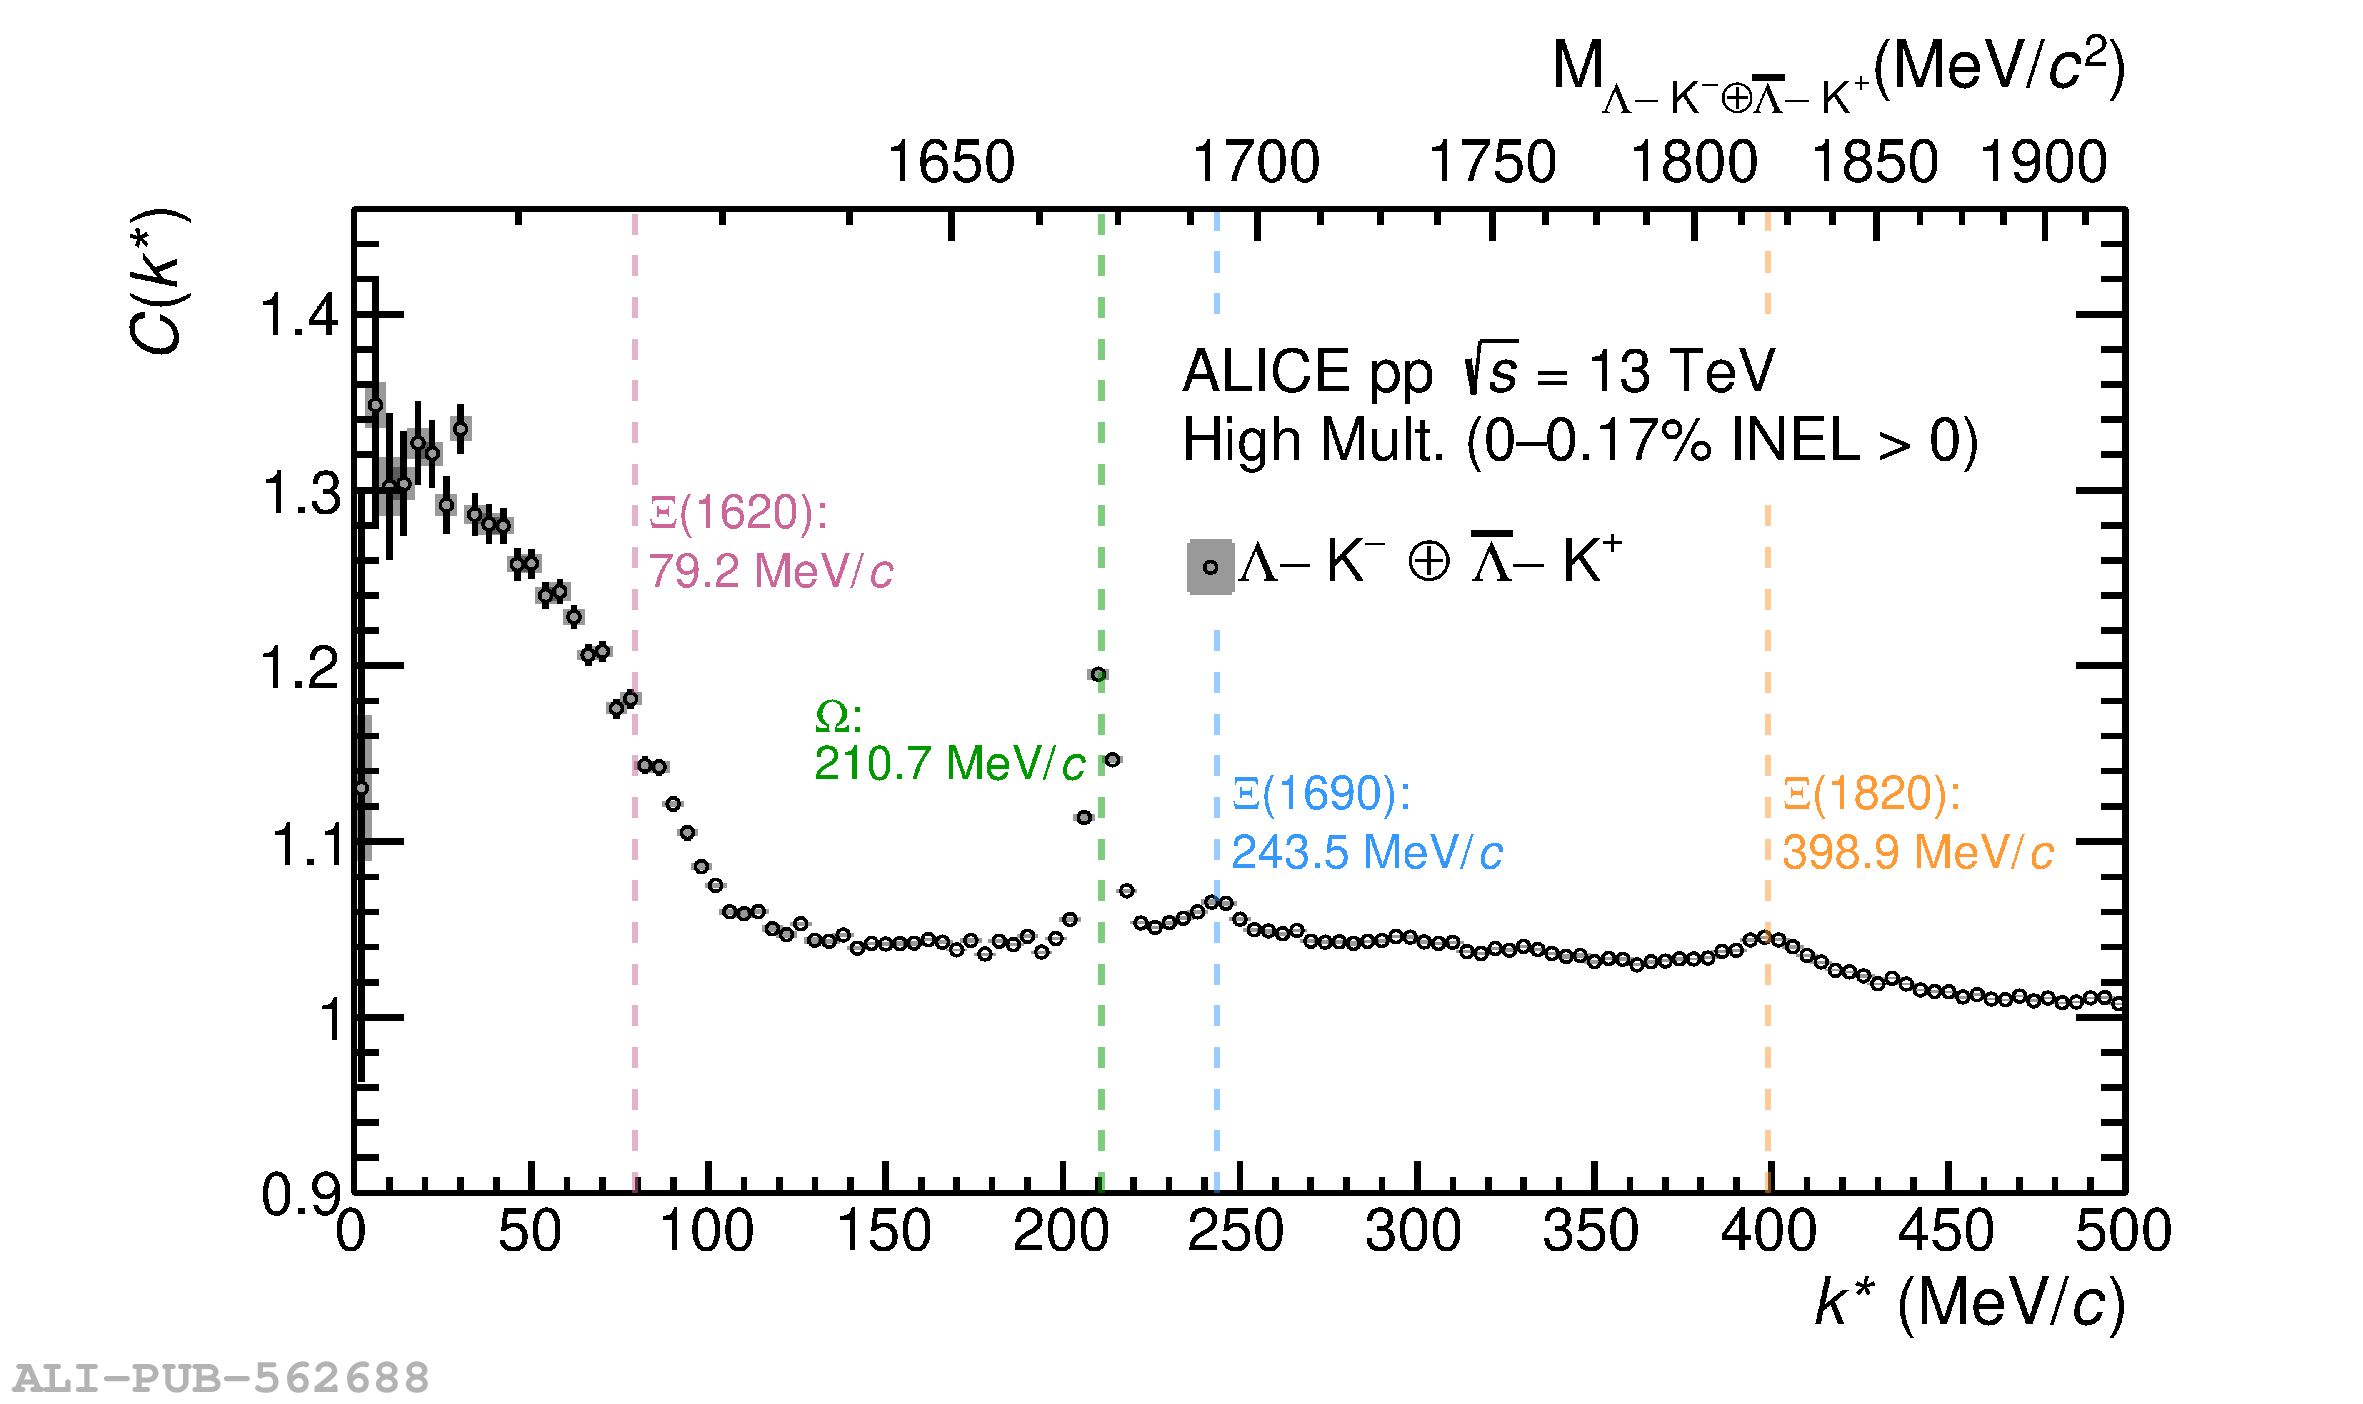  |
Figure 2
Measured correlation function of $\Lambda K^+$ pairs. Statistical (bars) and systematic (boxes) uncertainties are shown separately. The light cyan band represents the total fit obtained using Eq.2 from which the normalization $N_D$, and the scattering parameters ($\Re f_0$, $\Im f_0$, and $d_0$) are extracted. The orange band represents the $C_\mathrm{background}(k^{\ast})$ contribution, modeled as described in Section 3, and multiplied by the constant $N_D$. Lower panel: $n_\sigma$ deviation between data and model in terms of numbers of standard deviations. |  |
Figure 3
Measured correlation function of $\Lambda K^-$ pairs. Statistical (bars) and systematic (boxes) uncertainties are shown separately. The light cyan band represents the total fit obtained using Eq.2 from which the normalization $N_D$, the non-resonant scattering parameters ($\Re f_0$, $\Im f_0$ and $d_0$) and the properties of the $\Xi$ (1620) state are extracted. The violet band represents the $C_\mathrm{LL} ^\mathrm{res}(k^{\ast})$ correlation multiplied by the corresponding weight $(1-\omega)$, while the olive green band is the $\omega C_\mathrm{LL} ^\mathrm{ non-res}(k^{\ast})$. The orange band represents the $C_\mathrm{background}(k{\ast}^)$ modeled using the Monte Carlo simulations multiplied by the constant $N_D$. Lower panel: $n_\sigma$ deviation between data and model in terms of numbers of standard deviations. | 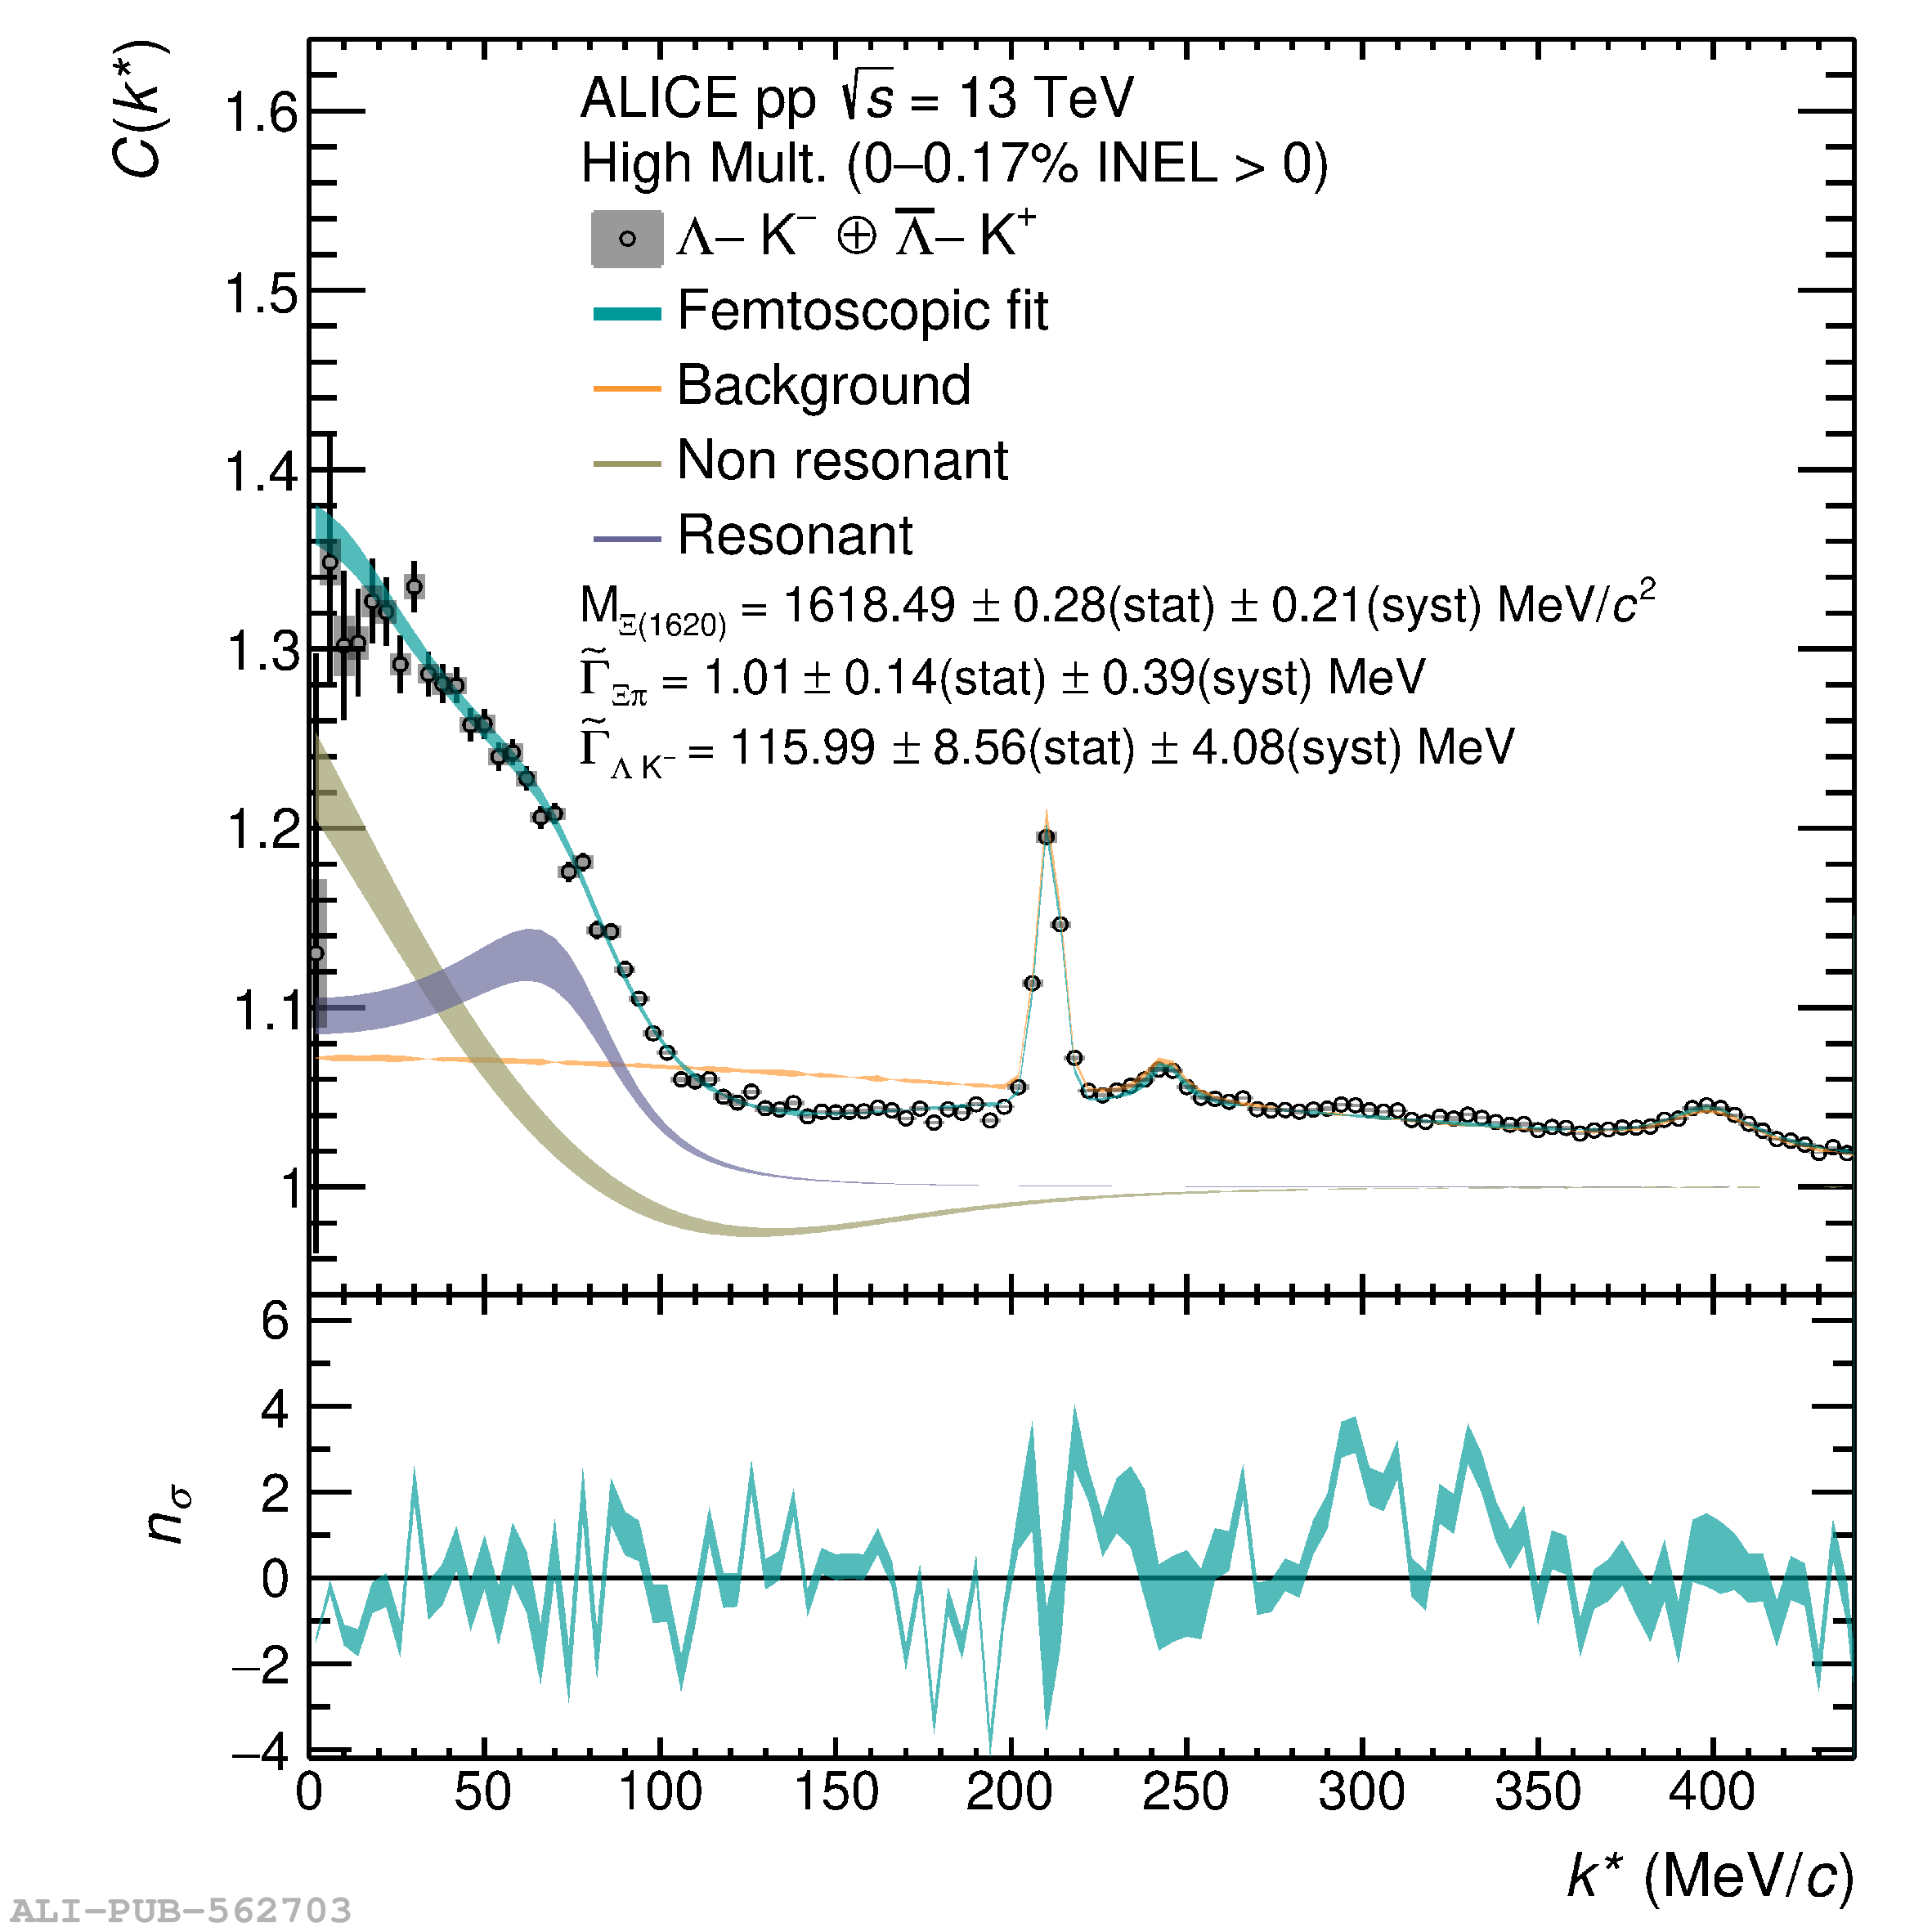 |
Figure 4
Left: extracted $\Re f_0$ and $\Im f_0$ for the $\Lambda K^+$ (red diamonds) and $\Lambda K^-$ (red dots) interaction in pp collisions, compared to Pb-Pb results (blue) and available models (orange , magenta , green , and light cyan ). Statistical (bars) and systematic (boxes) uncertainties are shown. Right: extracted effective range $d_0$ obtained in this work (red) and in Pb-Pb collisions (blue) . | 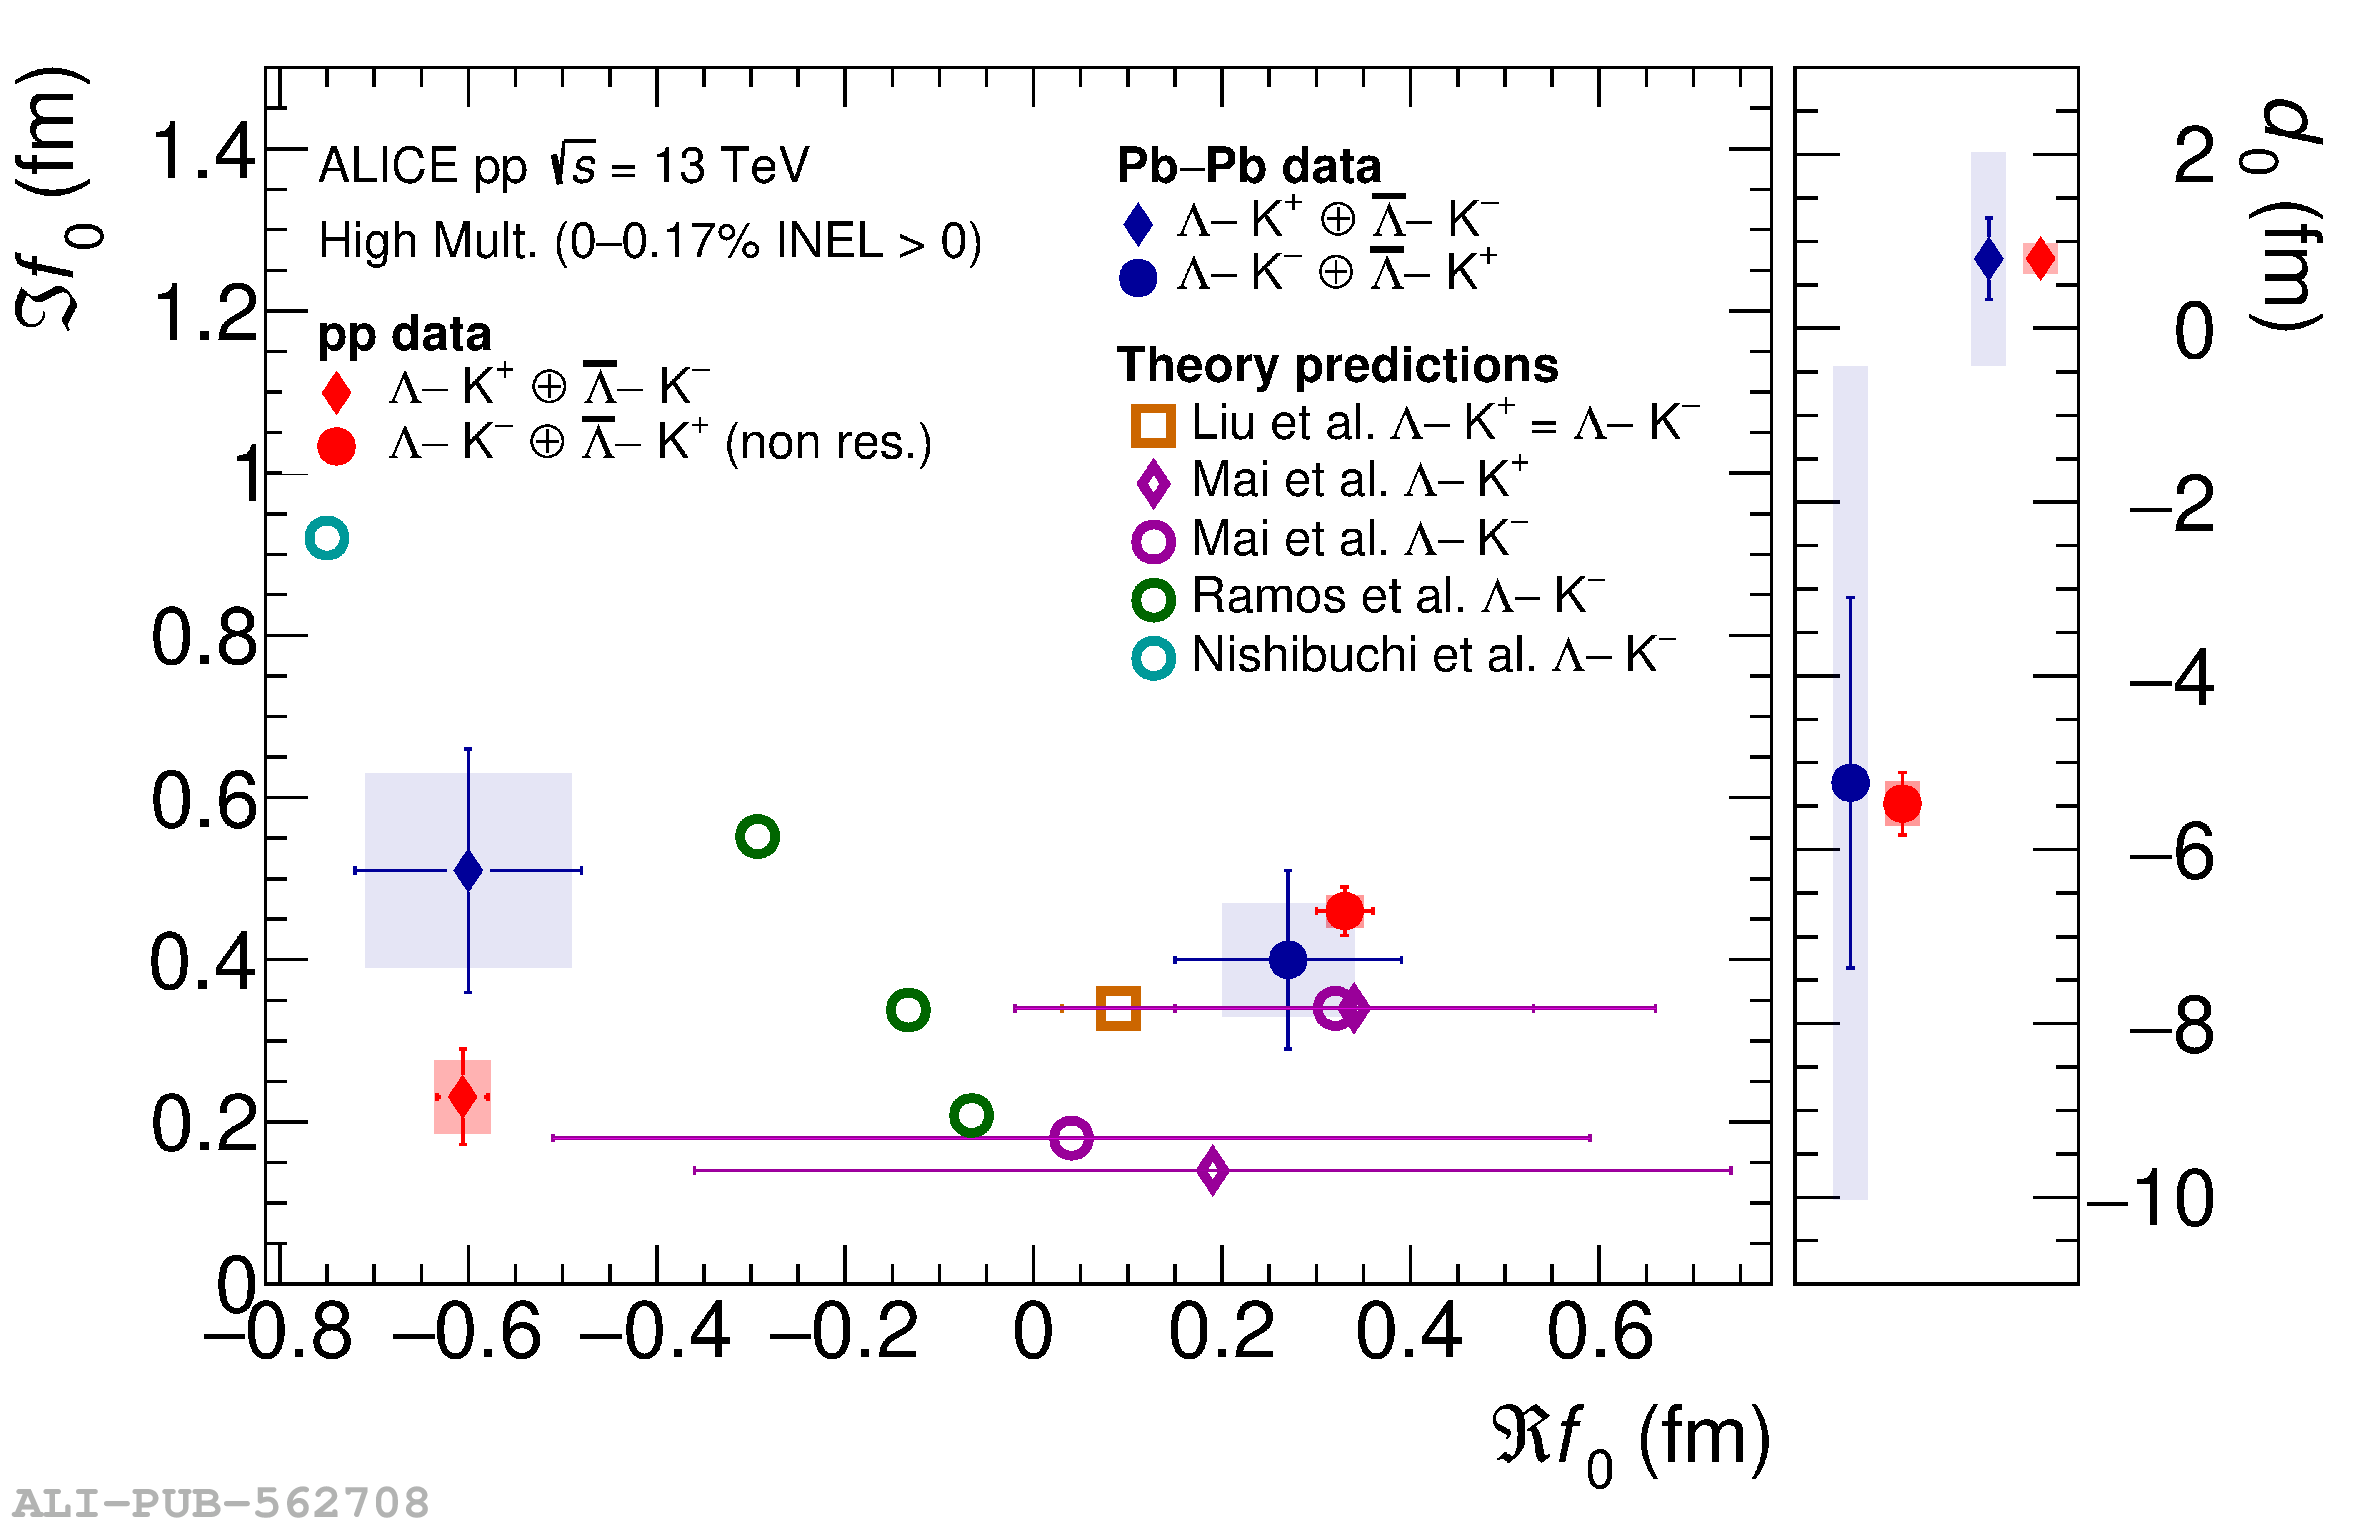 |