Measured correlation function of $\Lambda K^-$ pairs. Statistical (bars) and systematic (boxes) uncertainties are shown separately. The light cyan band represents the total fit obtained using Eq.2 from which the normalization $N_D$, the non-resonant scattering parameters ($\Re f_0$, $\Im f_0$ and $d_0$) and the properties of the $\Xi$ (1620) state are extracted. The violet band represents the $C_\mathrm{LL} ^\mathrm{res}(k^{\ast})$ correlation multiplied by the corresponding weight $(1-\omega)$, while the olive green band is the $\omega C_\mathrm{LL} ^\mathrm{ non-res}(k^{\ast})$. The orange band represents the $C_\mathrm{background}(k{\ast}^)$ modeled using the Monte Carlo simulations multiplied by the constant $N_D$. Lower panel: $n_\sigma$ deviation between data and model in terms of numbers of standard deviations. | 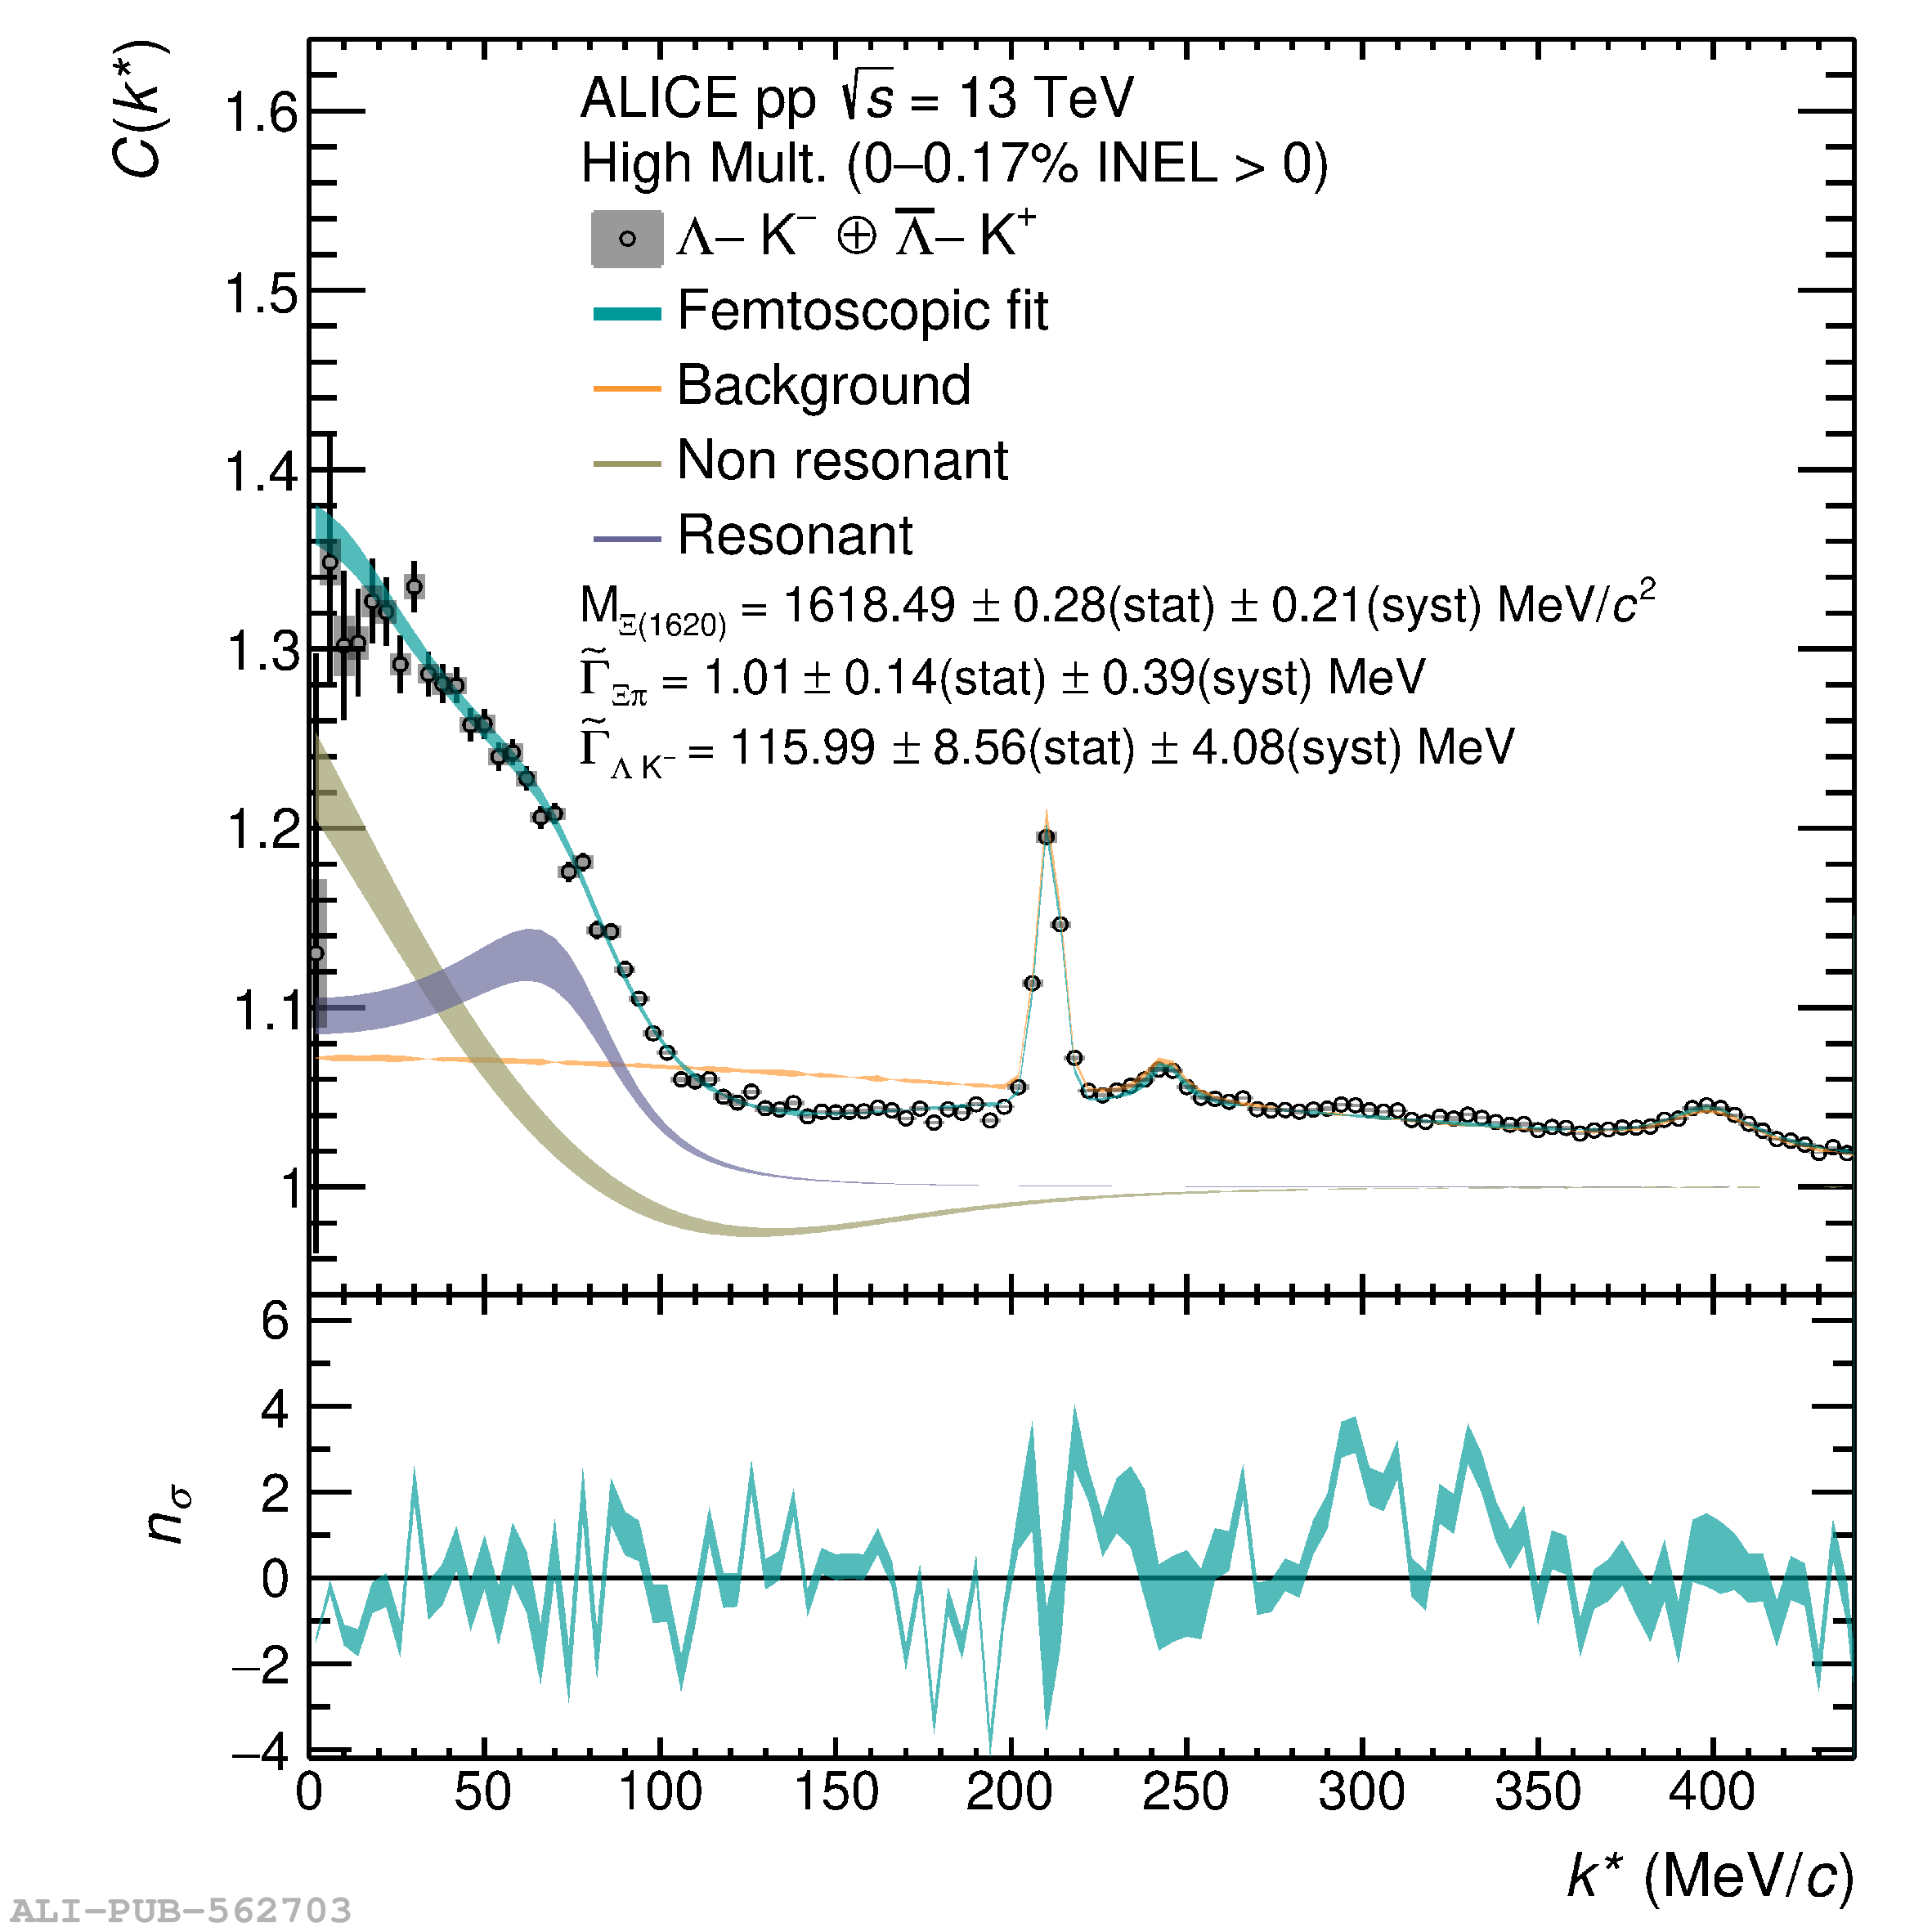 |