A newly developed observable for correlations between symmetry planes, which characterize the direction of the anisotropic emission of produced particles, is measured in Pb-Pb collisions at $\sqrt{s_{\rm NN}} = 2.76$ TeV with ALICE. This so-called Gaussian Estimator allows for the first time the study of these quantities without the influence of correlations between different flow amplitudes. The centrality dependence of various correlations between two, three and four symmetry planes is presented. The ordering of magnitude between these symmetry plane correlations is discussed and the results of the Gaussian Estimator are compared with measurements of previously used estimators. The results utilizing the new estimator lead to significantly smaller correlations than reported by studies using the Scalar Product method. Furthermore, the obtained symmetry plane correlations are compared to state-of-the-art hydrodynamic model calculations for the evolution of heavy-ion collisions. While the model predictions provide a qualitative description of the data, quantitative agreement is not always observed, particularly for correlators with significant non-linear response of the medium to initial state anisotropies of the collision system. As these results provide unique and independent information, their usage in future Bayesian analysis can further constrain our knowledge on the properties of the QCD matter produced in ultrarelativistic heavy-ion collisions.
Eur. Phys. J. C 83 (2023) 576
HEP Data
e-Print: arXiv:2302.01234 | PDF | inSPIRE
CERN-EP-2023-012
Figure group
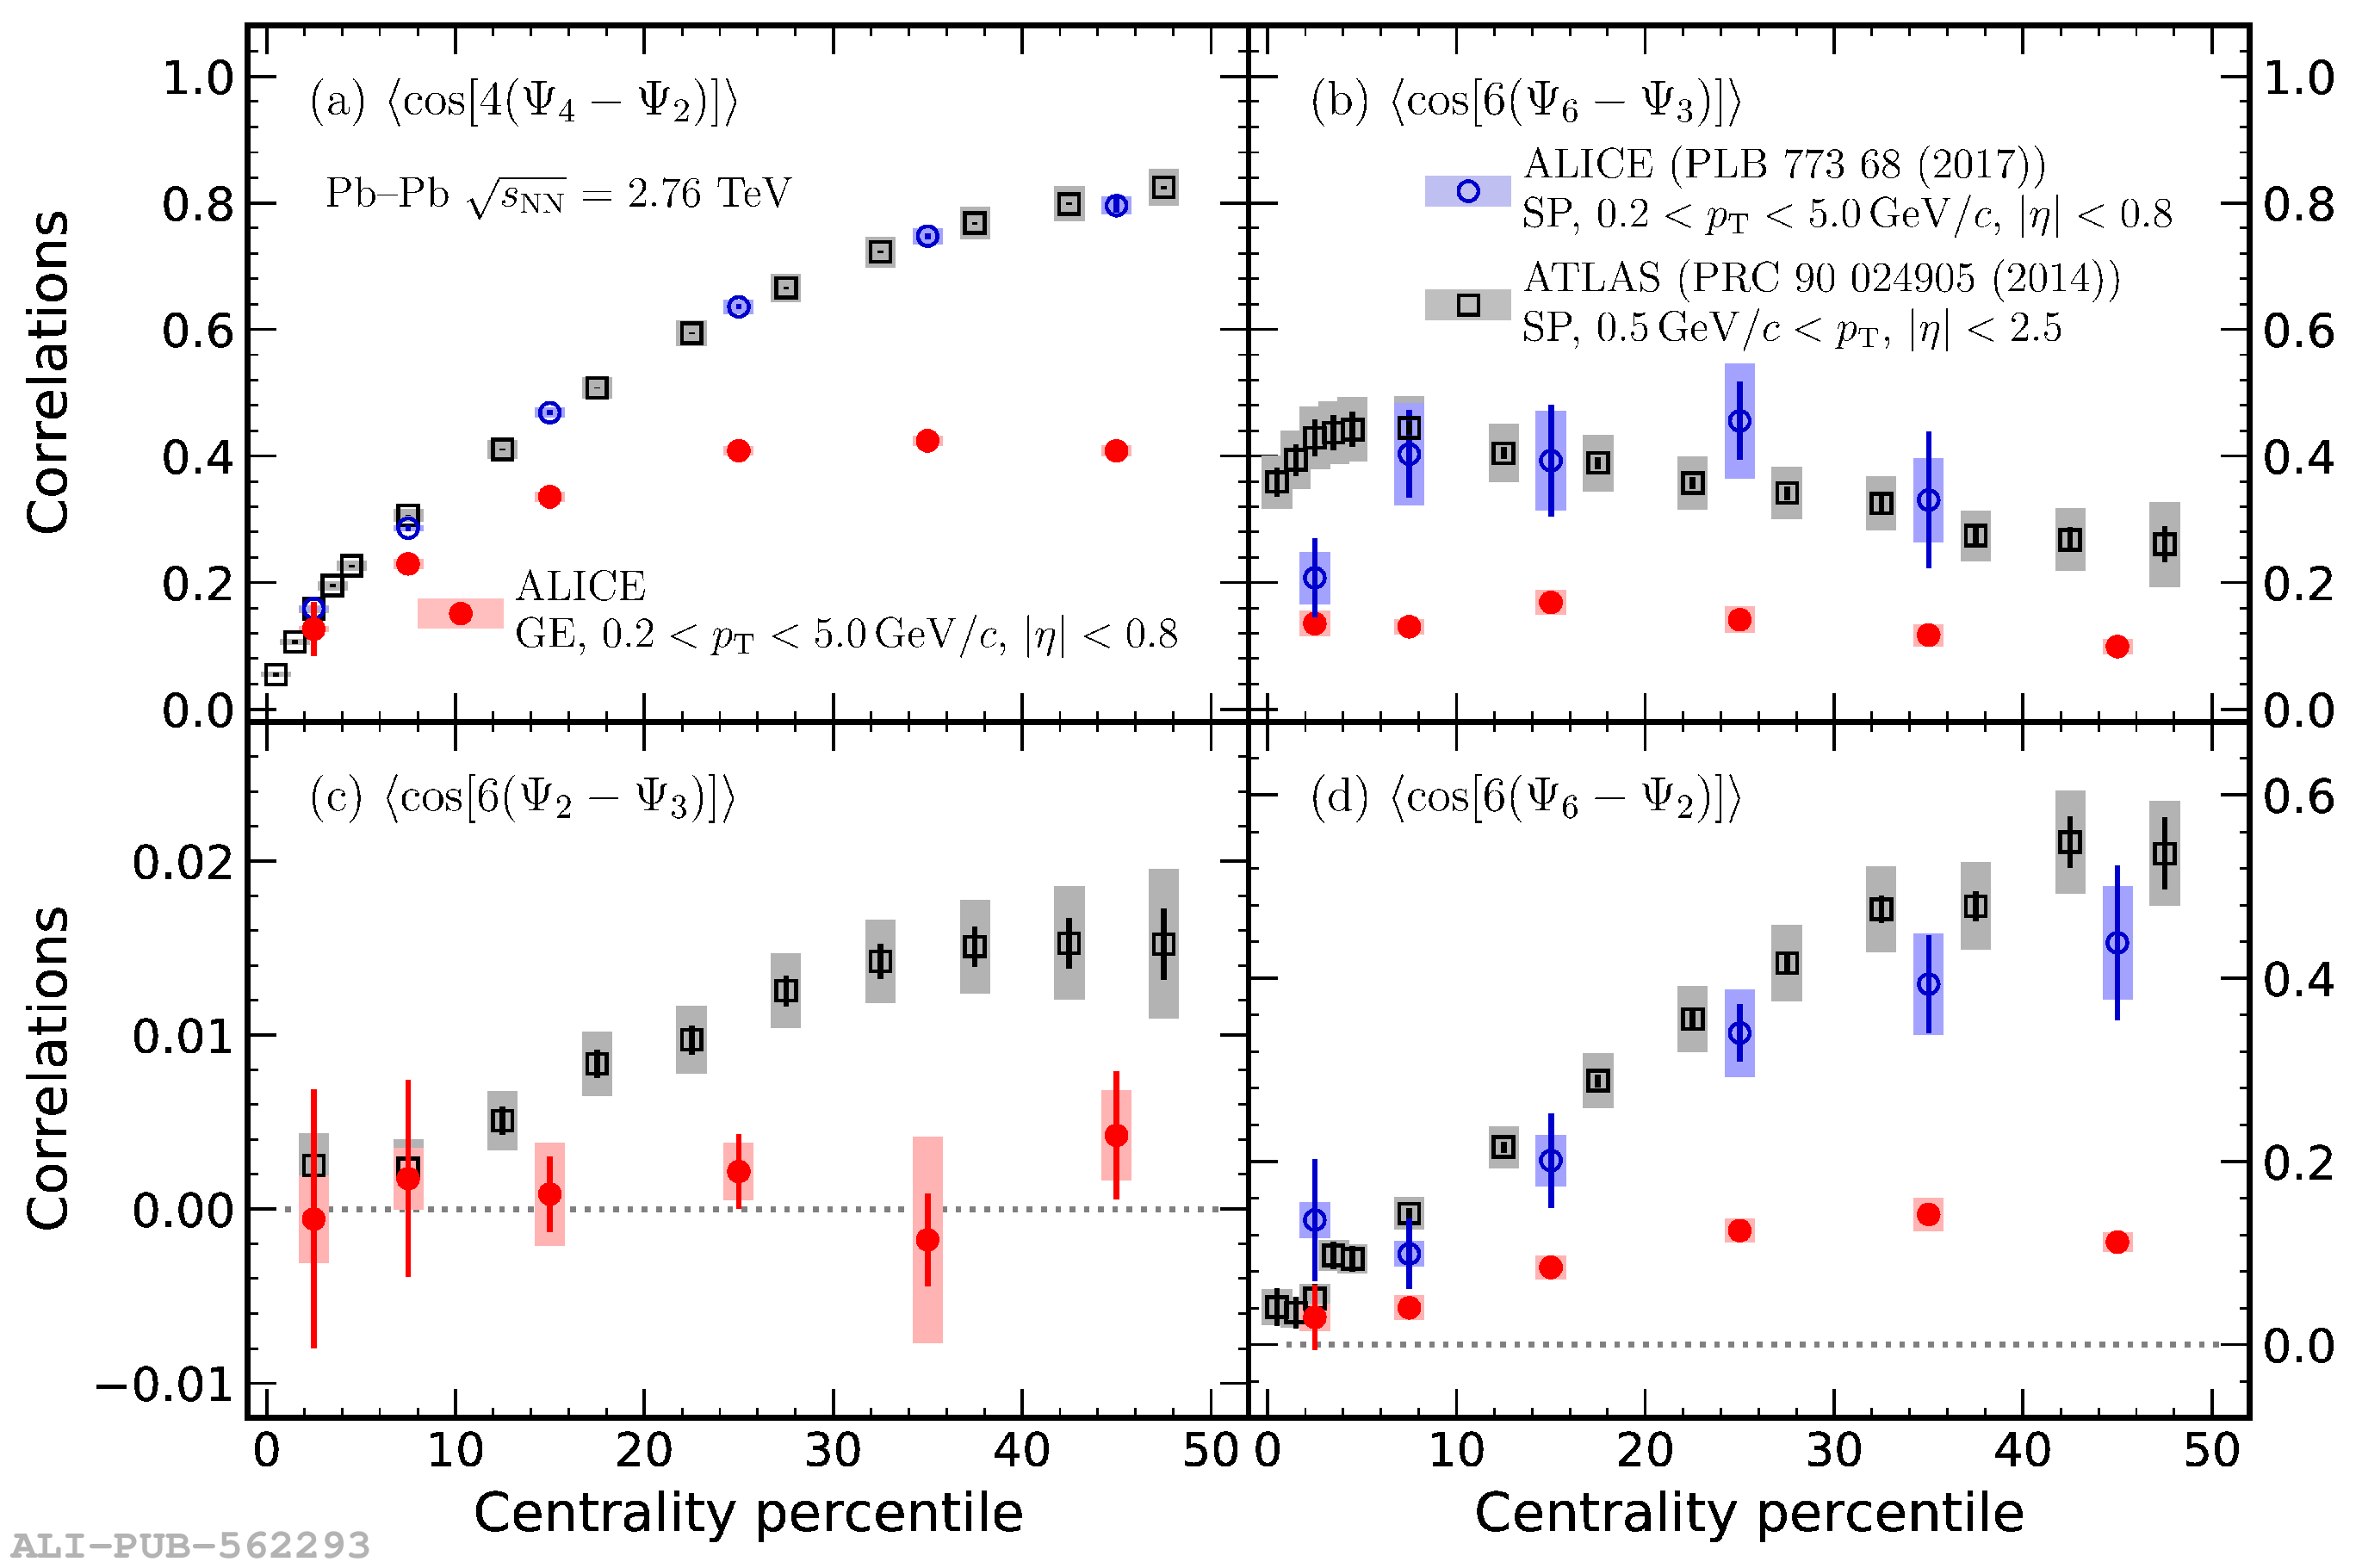

Figure 4
Experimental data for correlations between two symmetry planes compared to theoretical predictions in the initial and final state obtained with T$_\text{R}$ENTo: and T$_\text{R}$ENTo+VISH(2+1)+UrQMD [80-84], respectively. For $\langle\cos\left[6\left(\Psi_2-\Psi_3\right)\right]\rangle_\text{GE}$ (c), the initial state predictions calculated via eccentricities and energy density cumulants, $\langle \cos [6(\phi_2-\phi_3)]\rangle_{\text{GE}}$ and $\langle \cos[6(\Phi_2-\Phi_3)]\rangle_{\text{GE}}$, fully overlap. Statistical (systematic) uncertainties of the ALICE data are shown as lines (boxes). The statistical uncertainties of the models are represented by the colored bands. |  |
Figure 5
Experimental data for correlations between three (a-d) and four (e) symmetry planes compared with theoretical predictions in the initial and final state obtained with T$_\text{R}$ENTo: and T$_\text{R}$ENTo+VISH(2+1)+UrQMD [80-84], respectively. Statistical (systematic) uncertainties of the ALICE data are shown as lines (boxes). The statistical uncertainties of the models are represented by the colored bands. | 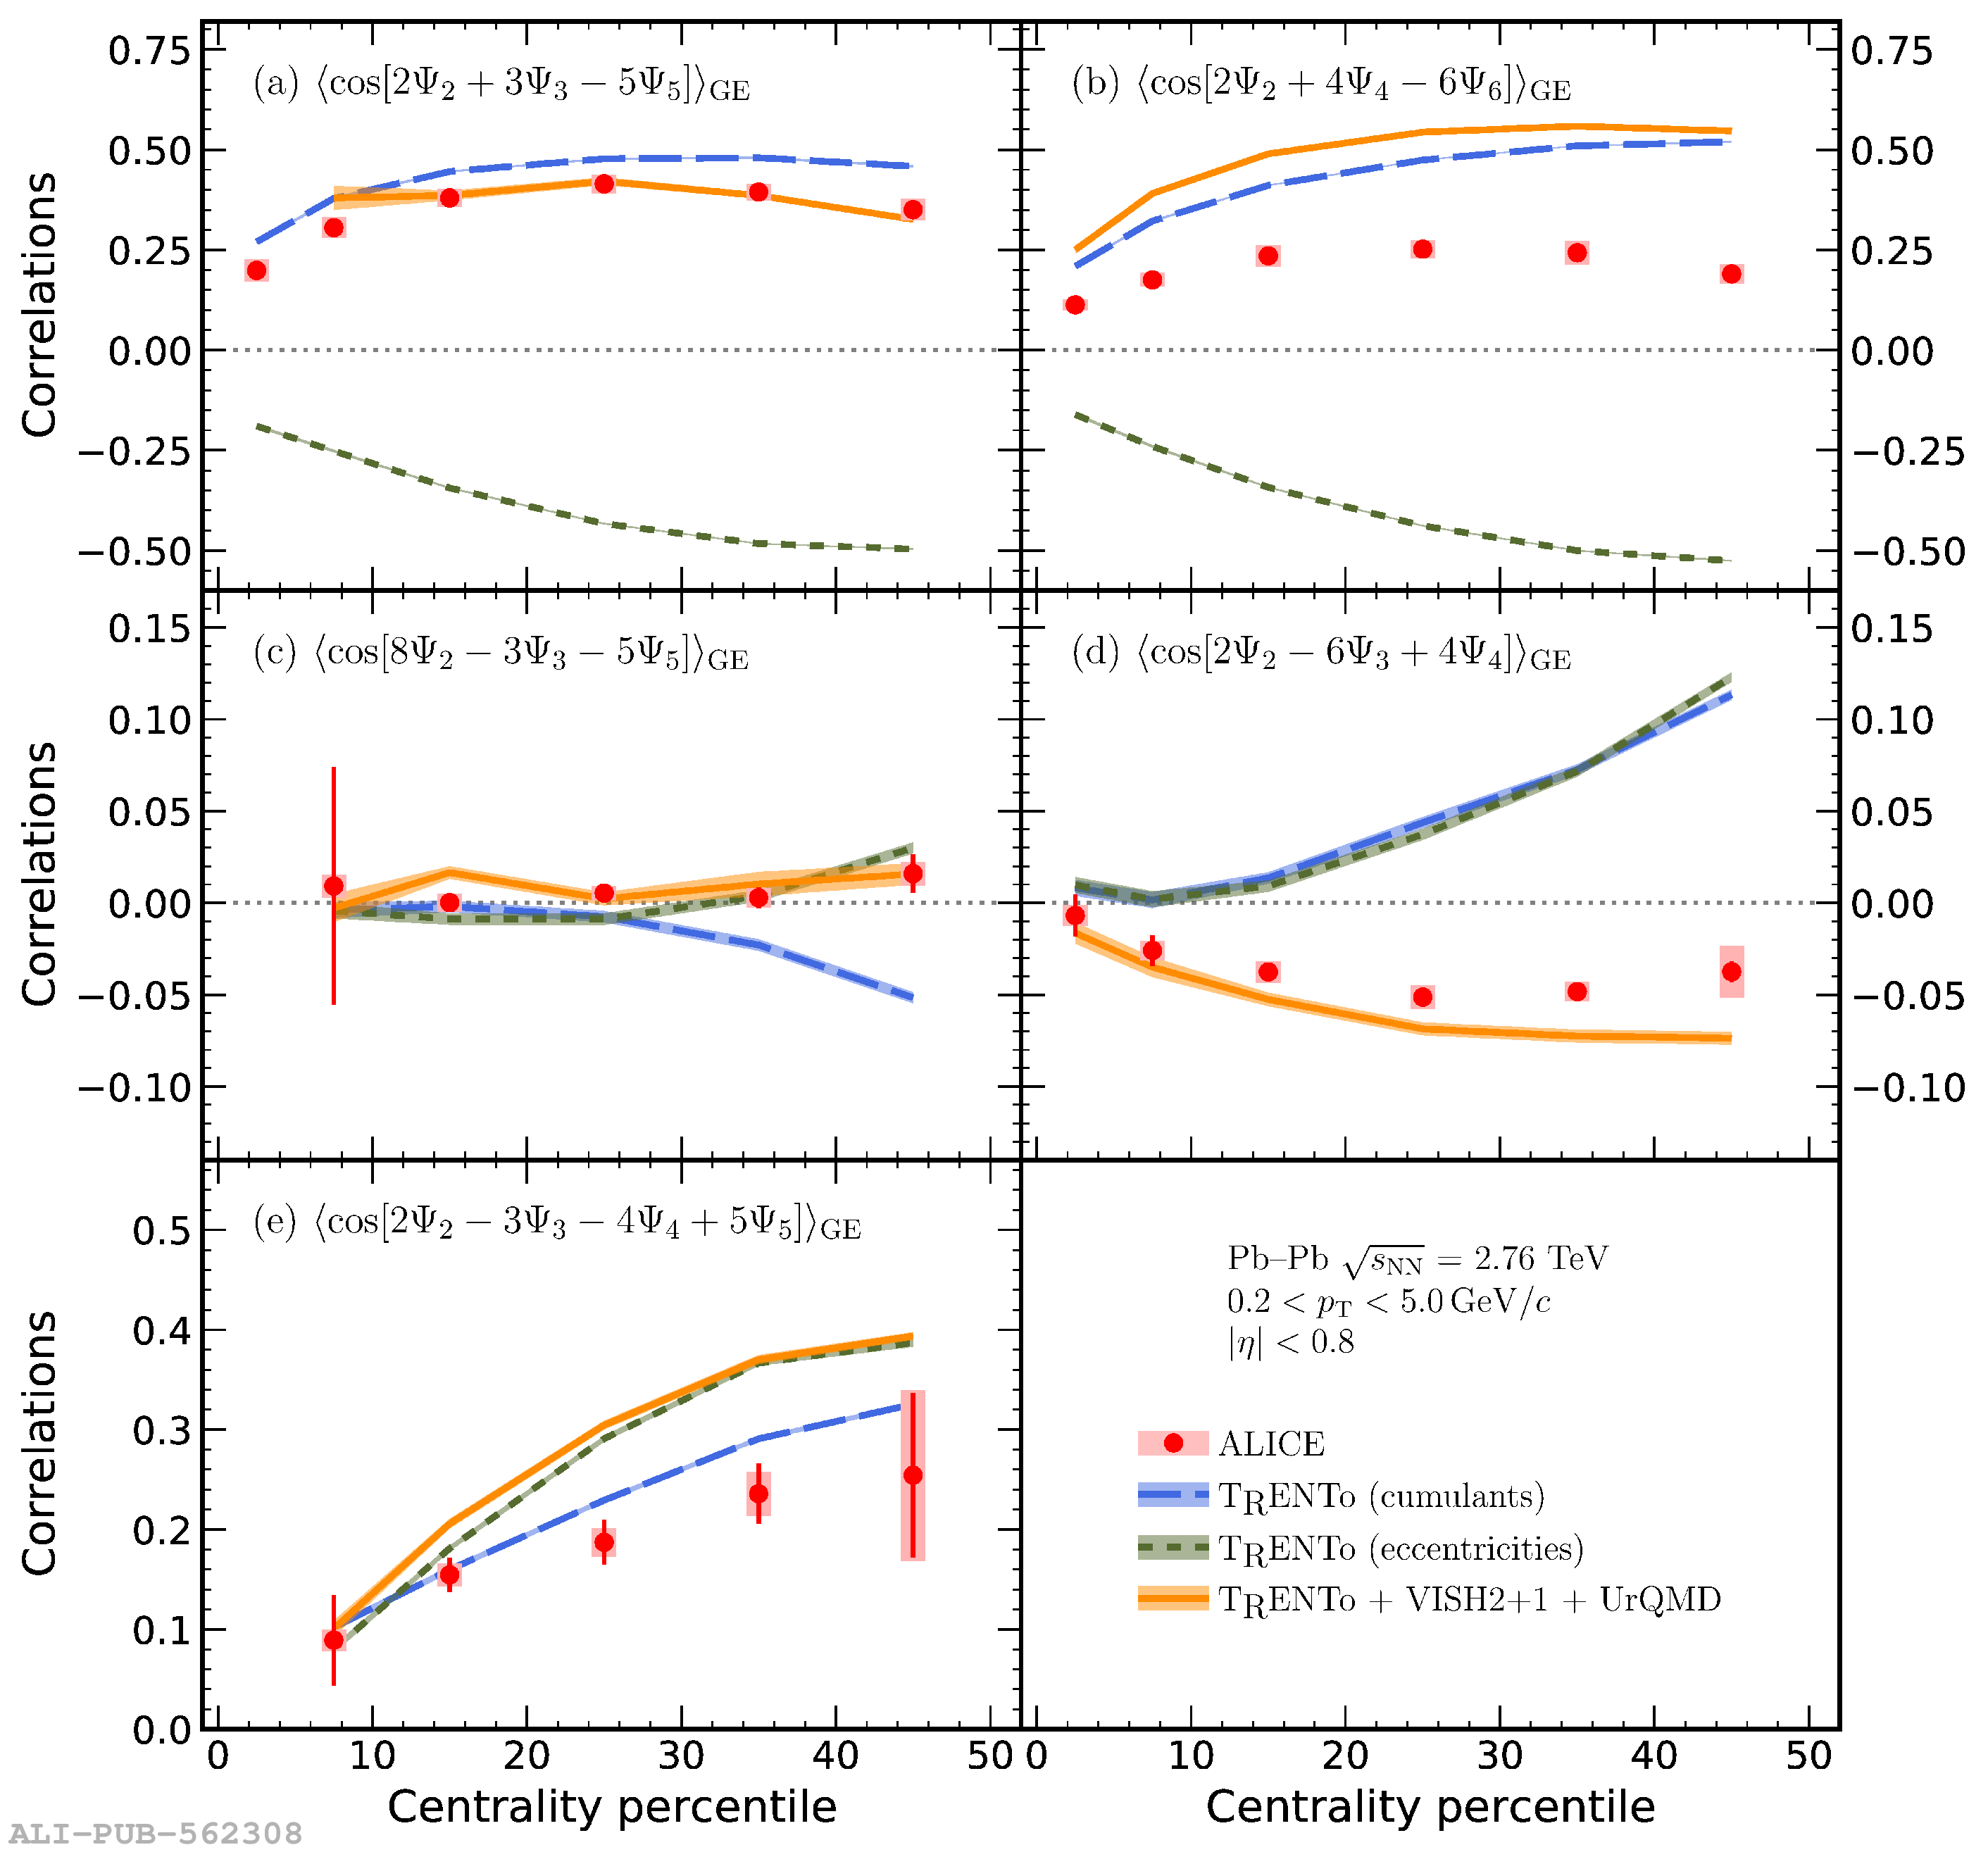 |