Experimental data for correlations between three (a-d) and four (e) symmetry planes compared with theoretical predictions in the initial and final state obtained with T$_\text{R}$ENTo: and T$_\text{R}$ENTo+VISH(2+1)+UrQMD [80-84], respectively. Statistical (systematic) uncertainties of the ALICE data are shown as lines (boxes). The statistical uncertainties of the models are represented by the colored bands. | 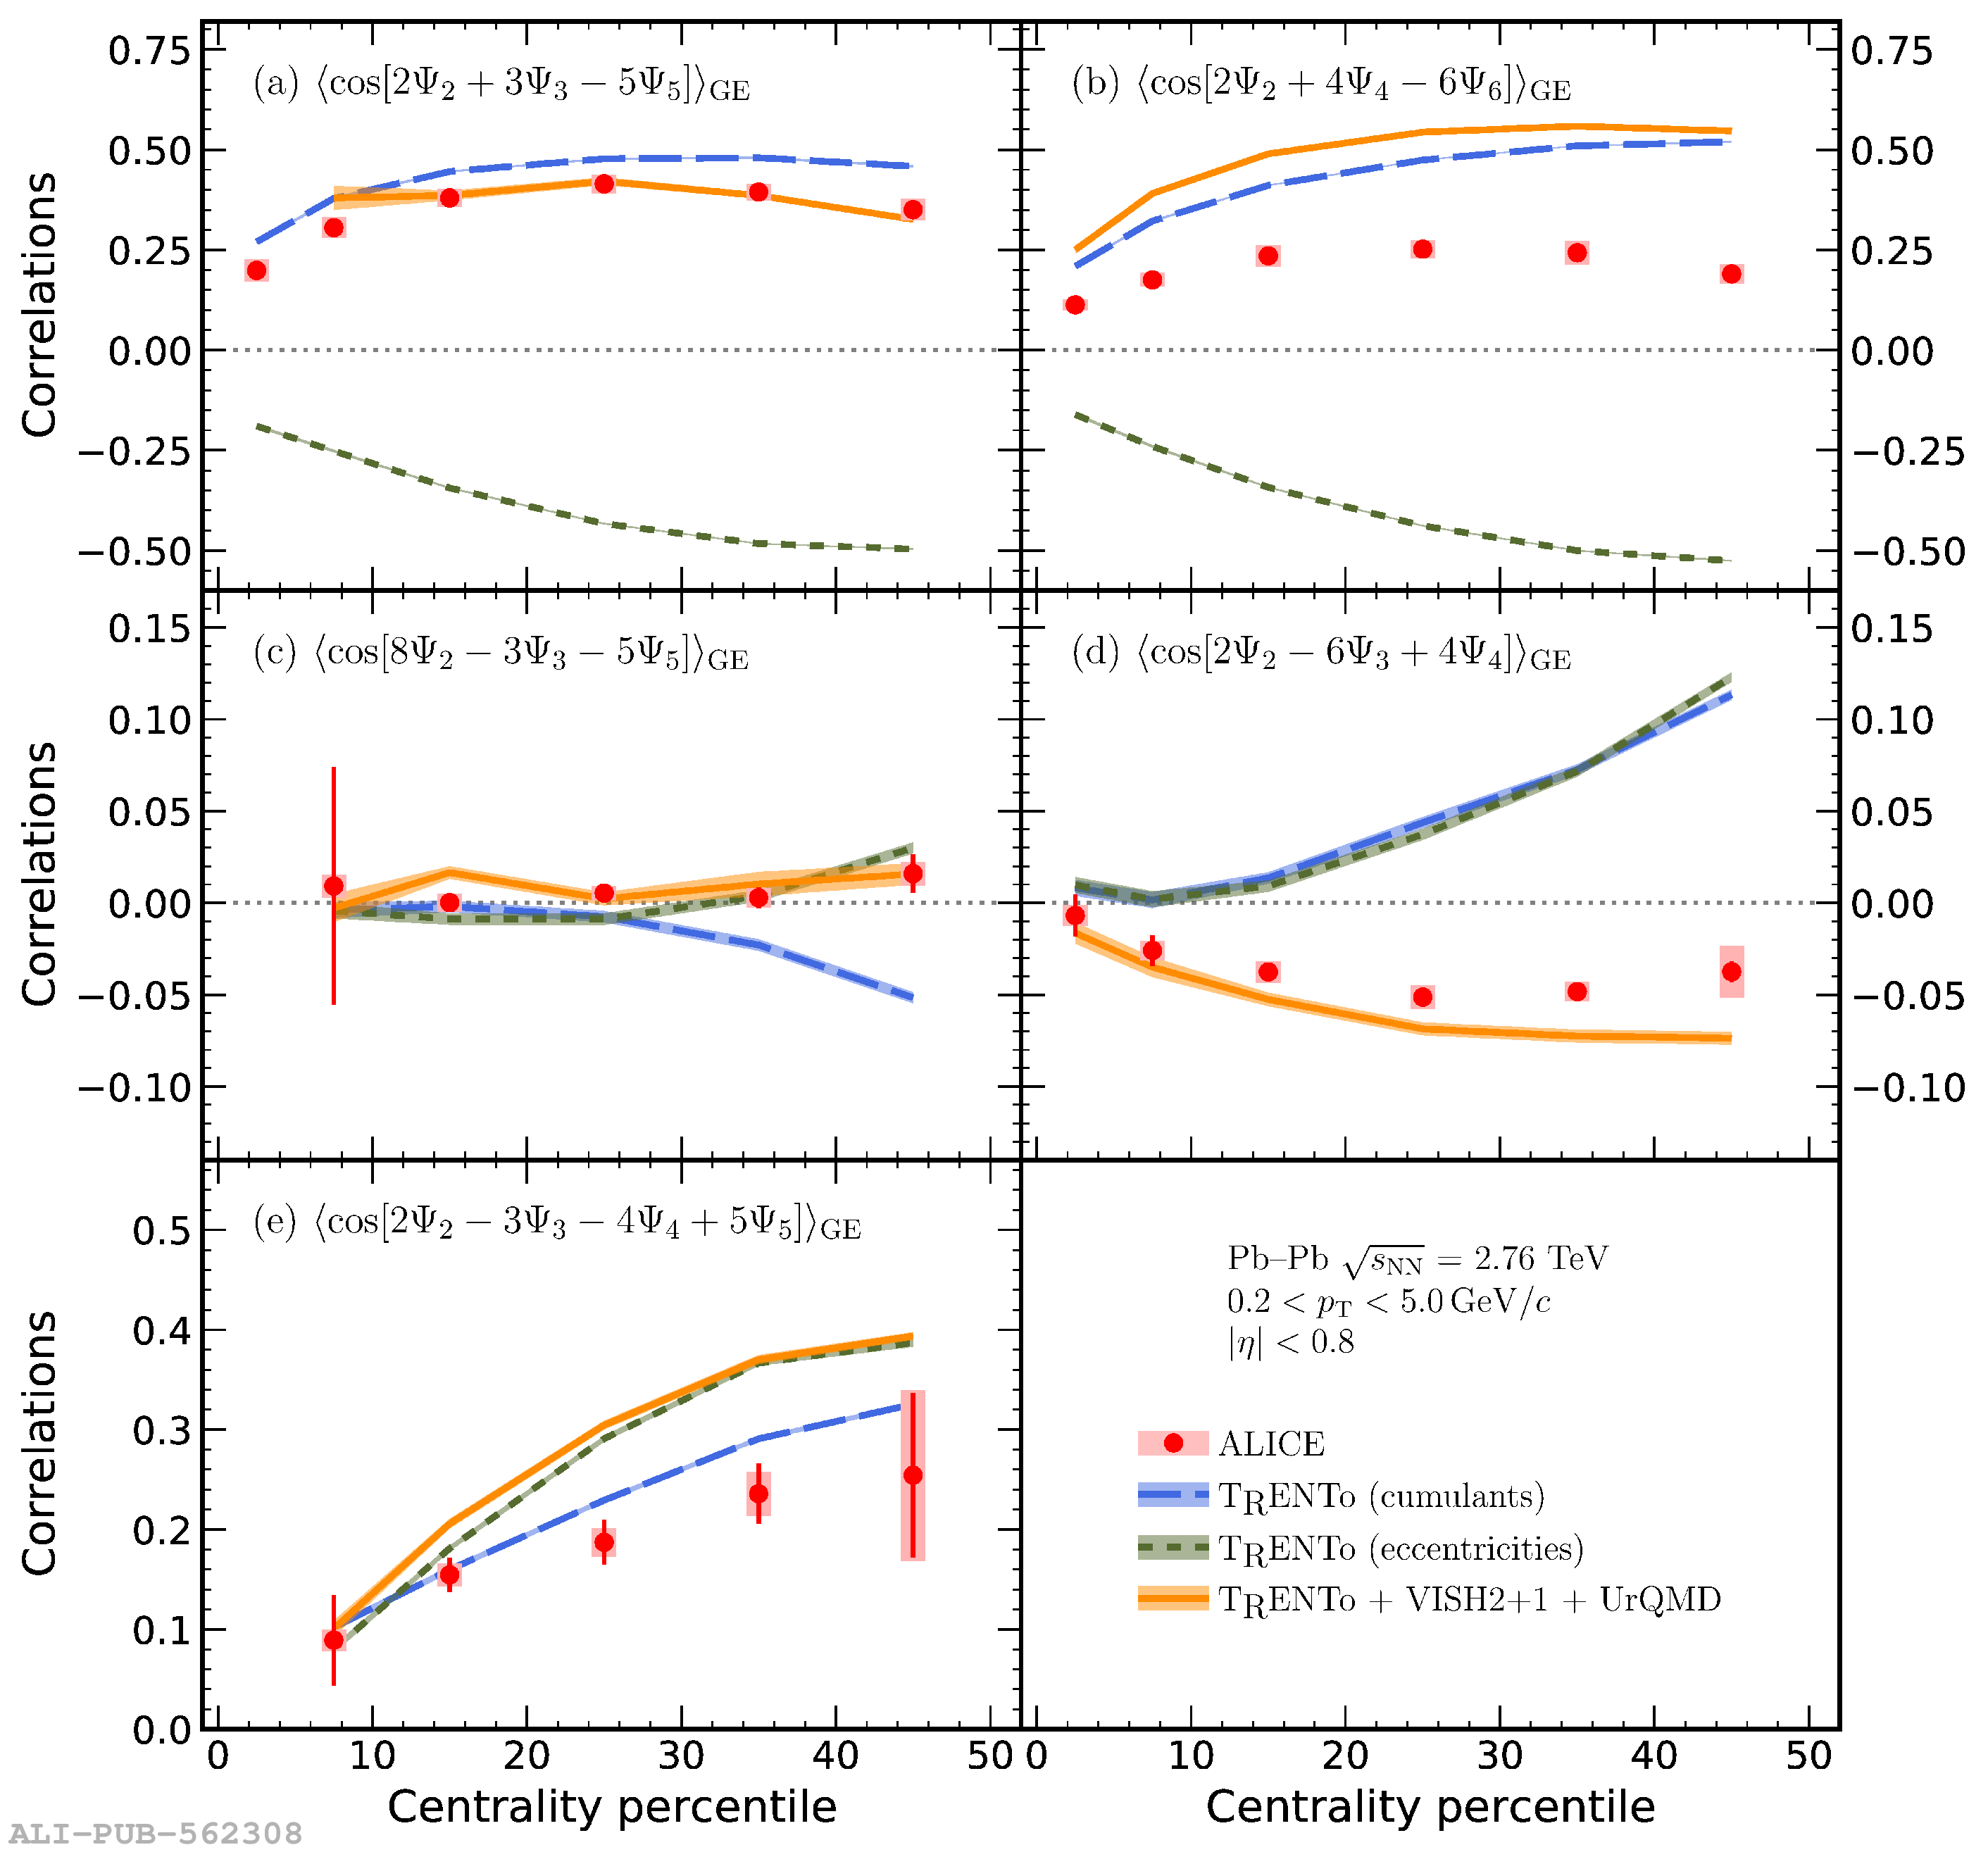 |