Inelastic cross section for \ahe\ on protons (left) and on $^{4}$He (right). The green band shows the scaled ALICE measurement (see text for details), the red line represents the original \geant parameterization and the black line on the left plot the parameterization employed in Ref. . The width of the green band represents standard deviation uncertainty. The blue band on the x axis indicates the kinetic energy range corresponding to the ALICE measurement for \sigmainel. | 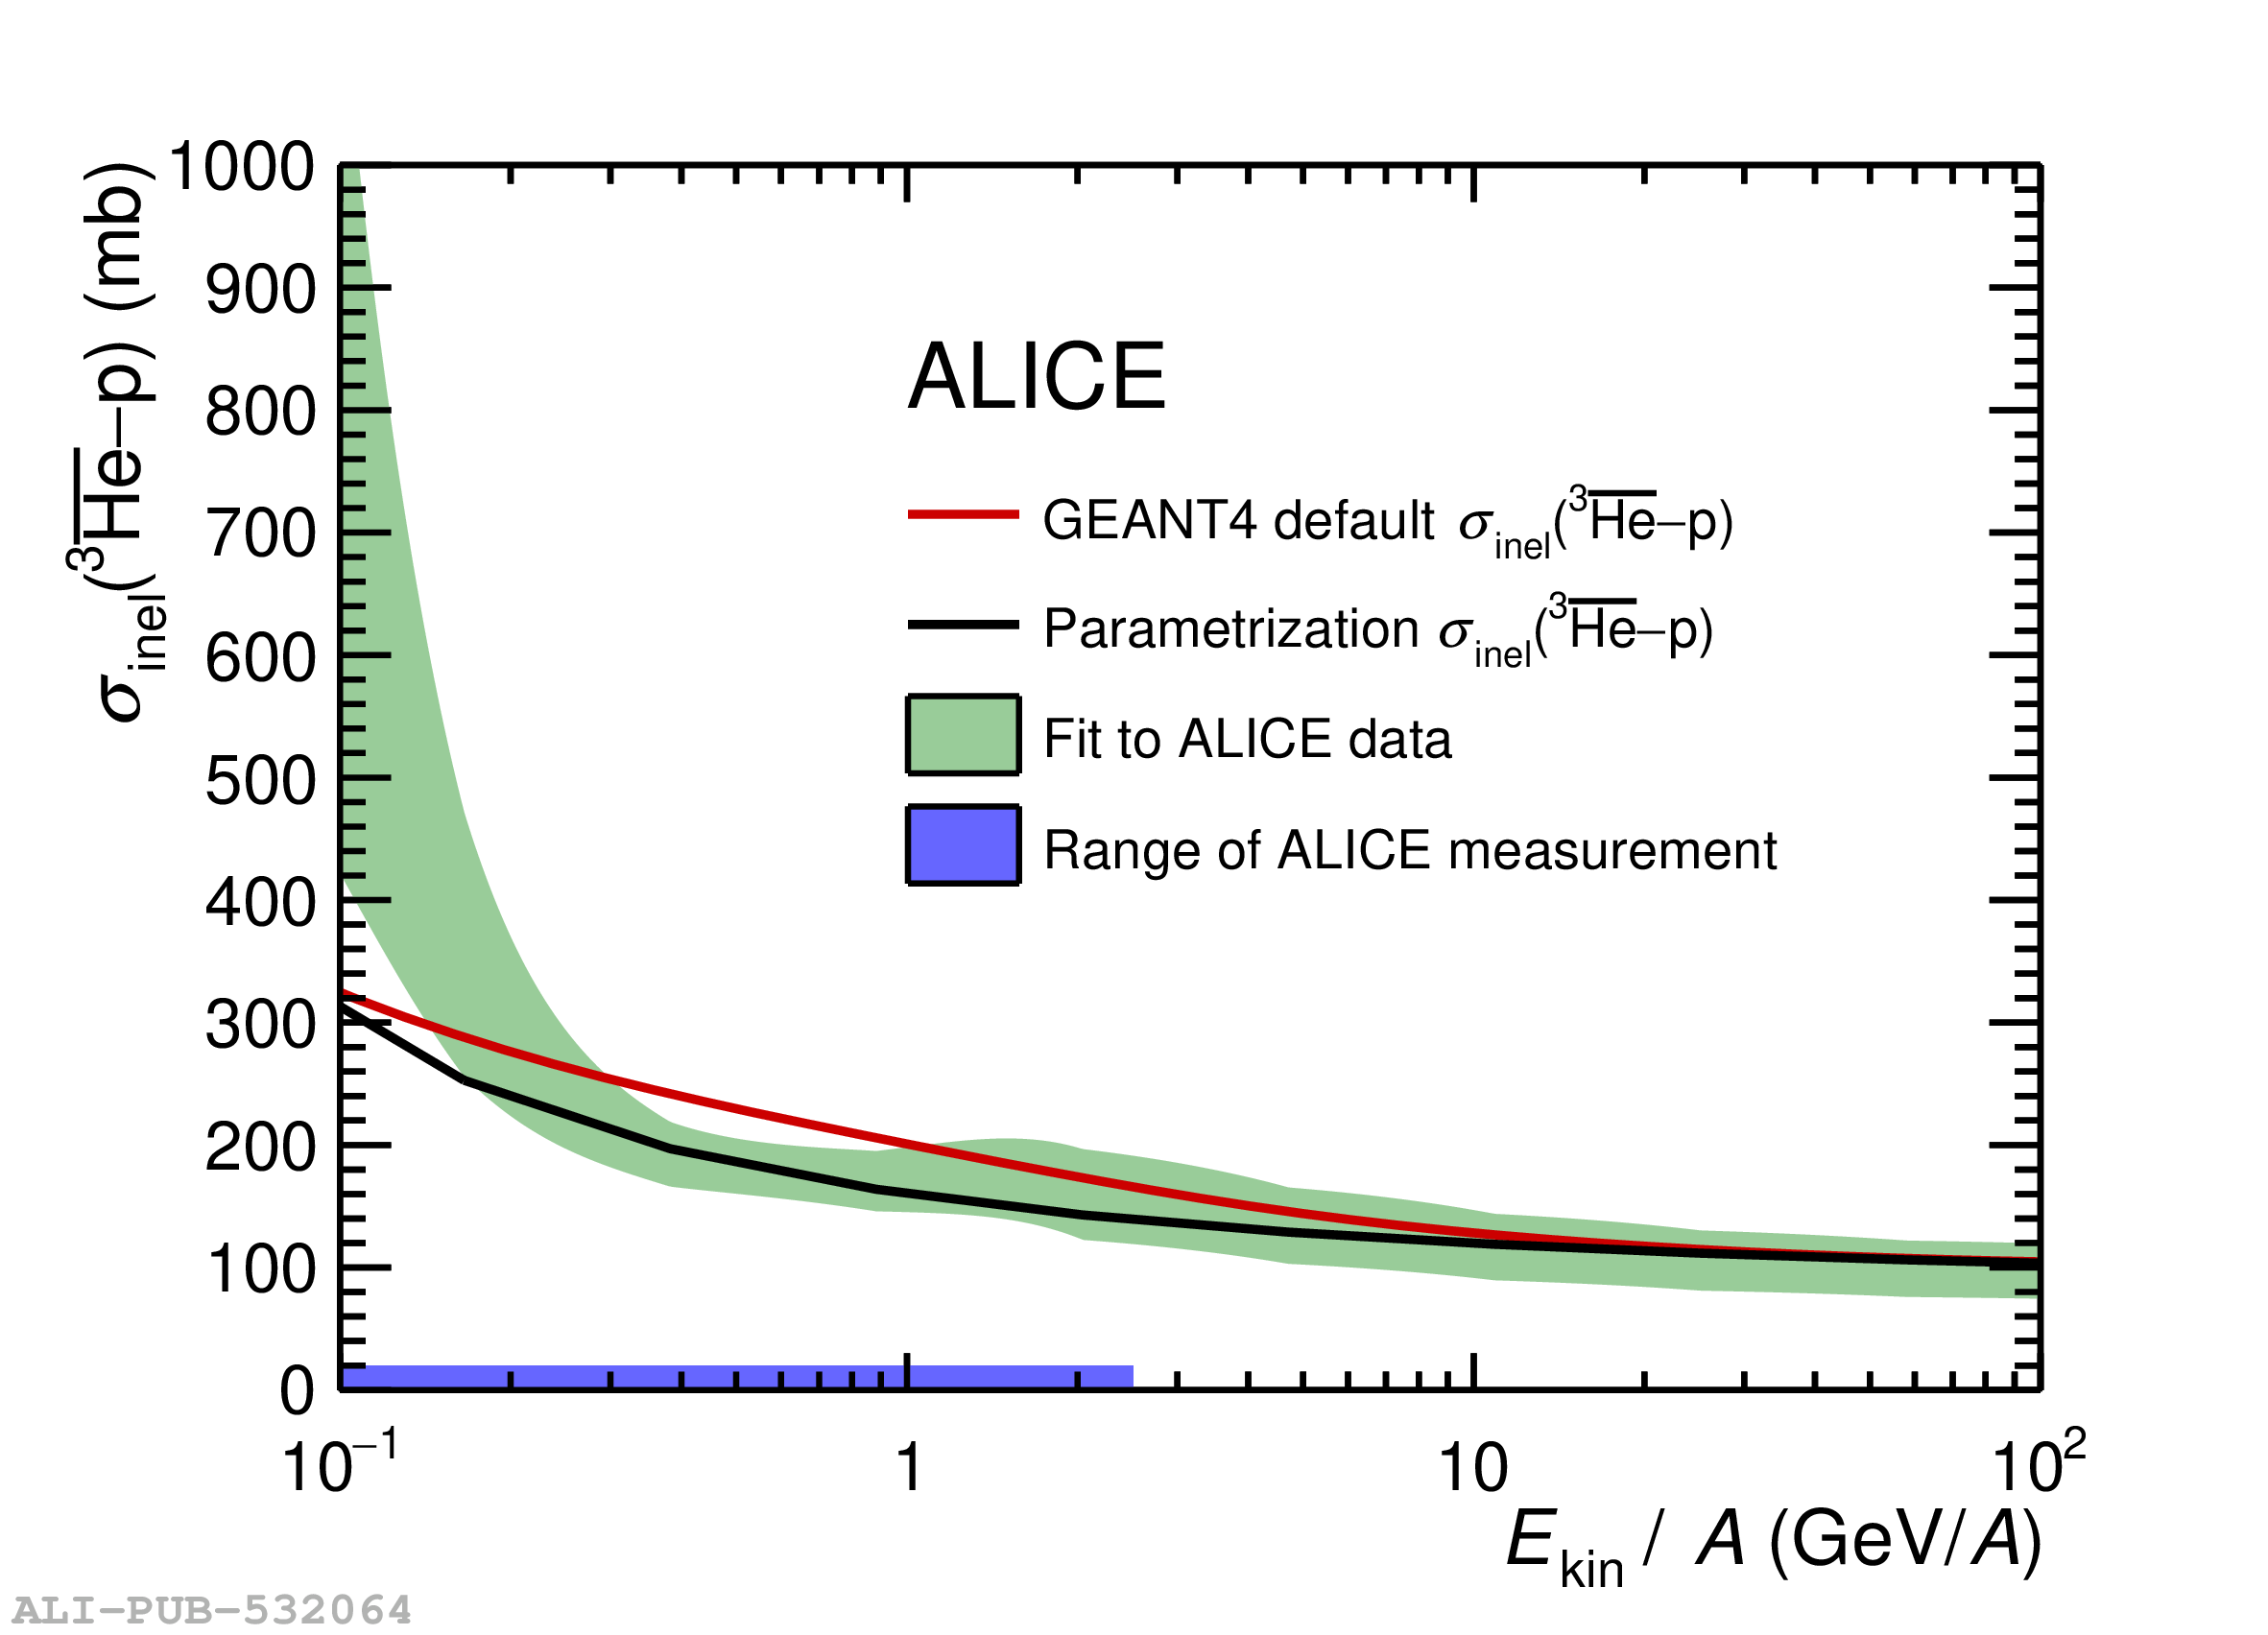  |