Description of the steps followed for the extraction of \sigmainel. (a) Schematic of the ALICE detectors at midrapidity in the plane perpendicular to the beam axis, with the collision point located in the middle; the ITS, TPC, TRD and TOF detectors are shown in green, blue, yellow and orange, respectively. A \ahe\ which annihilates in the TPC gas is shown in red, and a \he\ that does not undergo an inelastic reaction and reaches the TOF detector in blue; the dashed curves represent charged (anti)particles produced in the \ahe\ annihilation. (b) Identification of (anti)nuclei by means of their specific energy loss d$E$/d$x$ and momentum measurement in the TPC. The red points show all (anti)$^{3}$He nuclei reconstructed with the TPC detector, blue points correspond to (anti)$^{3}$He with TOF information; other (anti)particles are shown in black. (c) Experimental results for the raw ratio of \ahe\ to \he\ in pp collisions at $\sqrt{s} = 13$ TeV as a function of rigidity. The vertical lines and boxes represent statistical and systematic uncertainties in terms of standard deviations, respectively. The black and red lines show the results from the Monte Carlo simulations with varied \sigmainel. (d) Experimental ratio of \ahe\ with TOF information over \ahe\ reconstructed in the TPC in the 10\% most central Pb--Pb collisions at $\sqrt{s_{\rm NN}} = 5.02$ TeV as a function of rigidity. The black and red lines show the results from the Monte Carlo simulations with varied \sigmainel. (e) The raw ratio of \ahe\ to \he\ in a particular rigidity interval as a function of \sigmainel\ for $\langle A\rangle = 17.4$. The fit to the results from Monte Carlo simulations (black points) shows the dependence of the observable on \sigmainel\ according to the Lambert--Beer formula. The horizontal dashed blue lines show the central value and $1\sigma$ uncertainties for the measured observable and their intersection with the Lambert--Beer function determines \sigmainel\ limits (yellow lines). (f) Extraction of \sigmainel\ for $\langle A\rangle = 34.7$ analogous to the panel e, with \sigmainel\ limits shown as magenta lines. | 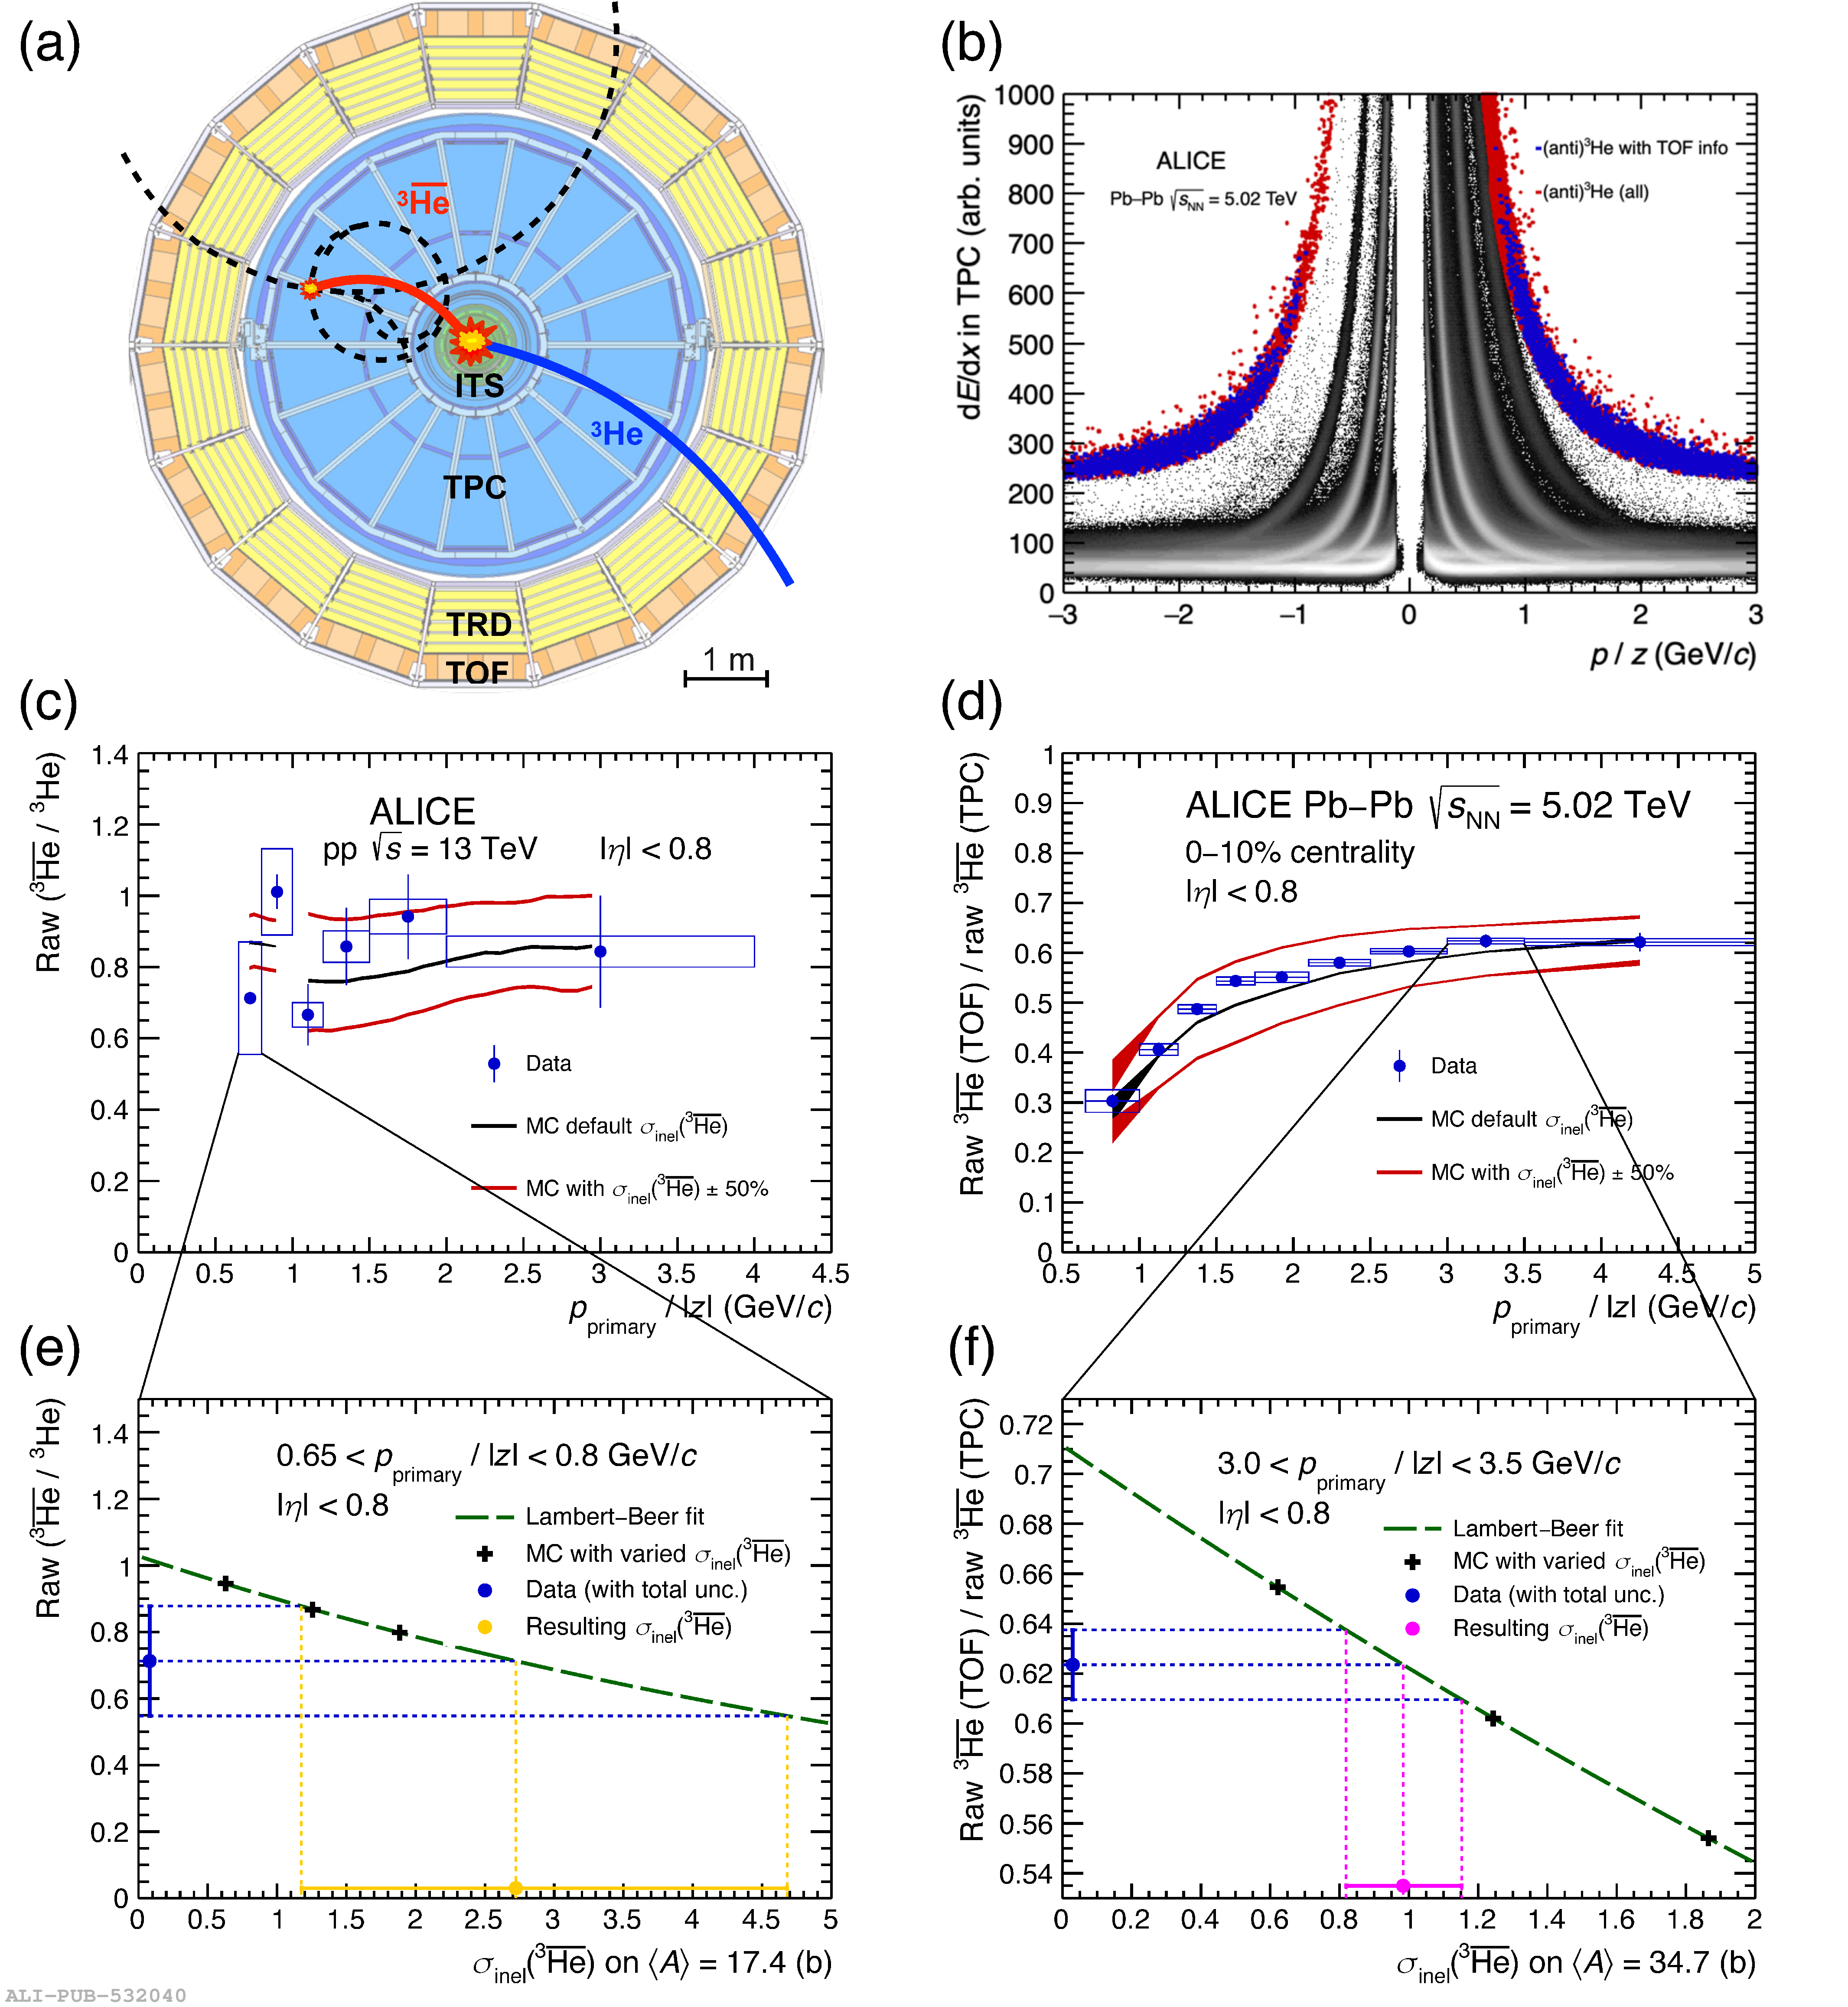 |