The cross section for coherent photonuclear production of J/$\psi$ is presented as a function of the electromagnetic dissociation (EMD) of Pb. The measurement is performed with the ALICE detector in ultra-peripheral Pb-Pb collisions at a centre-of-mass energy per nucleon pair of $\sqrt{s_{\mathrm{NN}}}=5.02$ TeV. Cross sections are presented in five different J/$\psi$ rapidity ranges within $|y|<~4$, with the J/$\psi$ reconstructed via its dilepton decay channels. In some events the J/$\psi$ is not accompanied by EMD, while other events do produce neutrons from EMD at beam rapidities either in one or the other beam direction, or in both. The cross sections in a given rapidity range and for different configurations of neutrons from EMD allow for the extraction of the energy dependence of this process in the range $17 <~ W_{\gamma\, \mathrm{Pb, n}} <~920$ GeV, where $W_{\gamma\, \mathrm{Pb, n}}$ is the centre-of-mass energy per nucleon of the $\gamma\,\mathrm{Pb}$ system. This range corresponds to a Bjorken-$x$ interval spanning about three orders of magnitude: $ 1.1\times10^{-5}<~x<~3.3\times 10^{-2}$. In addition to the ultra-peripheral and photonuclear cross sections, the nuclear suppression factor is obtained. These measurements point to a strong depletion of the gluon distribution in Pb nuclei over a broad, previously unexplored, energy range. These results, together with previous ALICE measurements, provide unprecedented information to probe quantum chromodynamics at high energies.
JHEP 10 (2023) 119
HEP Data
e-Print: arXiv:2305.19060 | PDF | inSPIRE
CERN-EP-2023-100
Figure group
Figure 1
Invariant-mass distributions for events in the 0n0n (left) and XnXn (right) neutron classes measured at mid (top) and forward rapidity (bottom). The solid black markers represent data, the vertical line through each of them is the associated statistical uncertainty. The blue lines depict the fit models, described in the text, which are composed of a signal (shown in magenta) and a background (shown in green) contribution. In the lower left plot the contribution from $\psi^\prime$ is clearly visible (shown in yellow). | 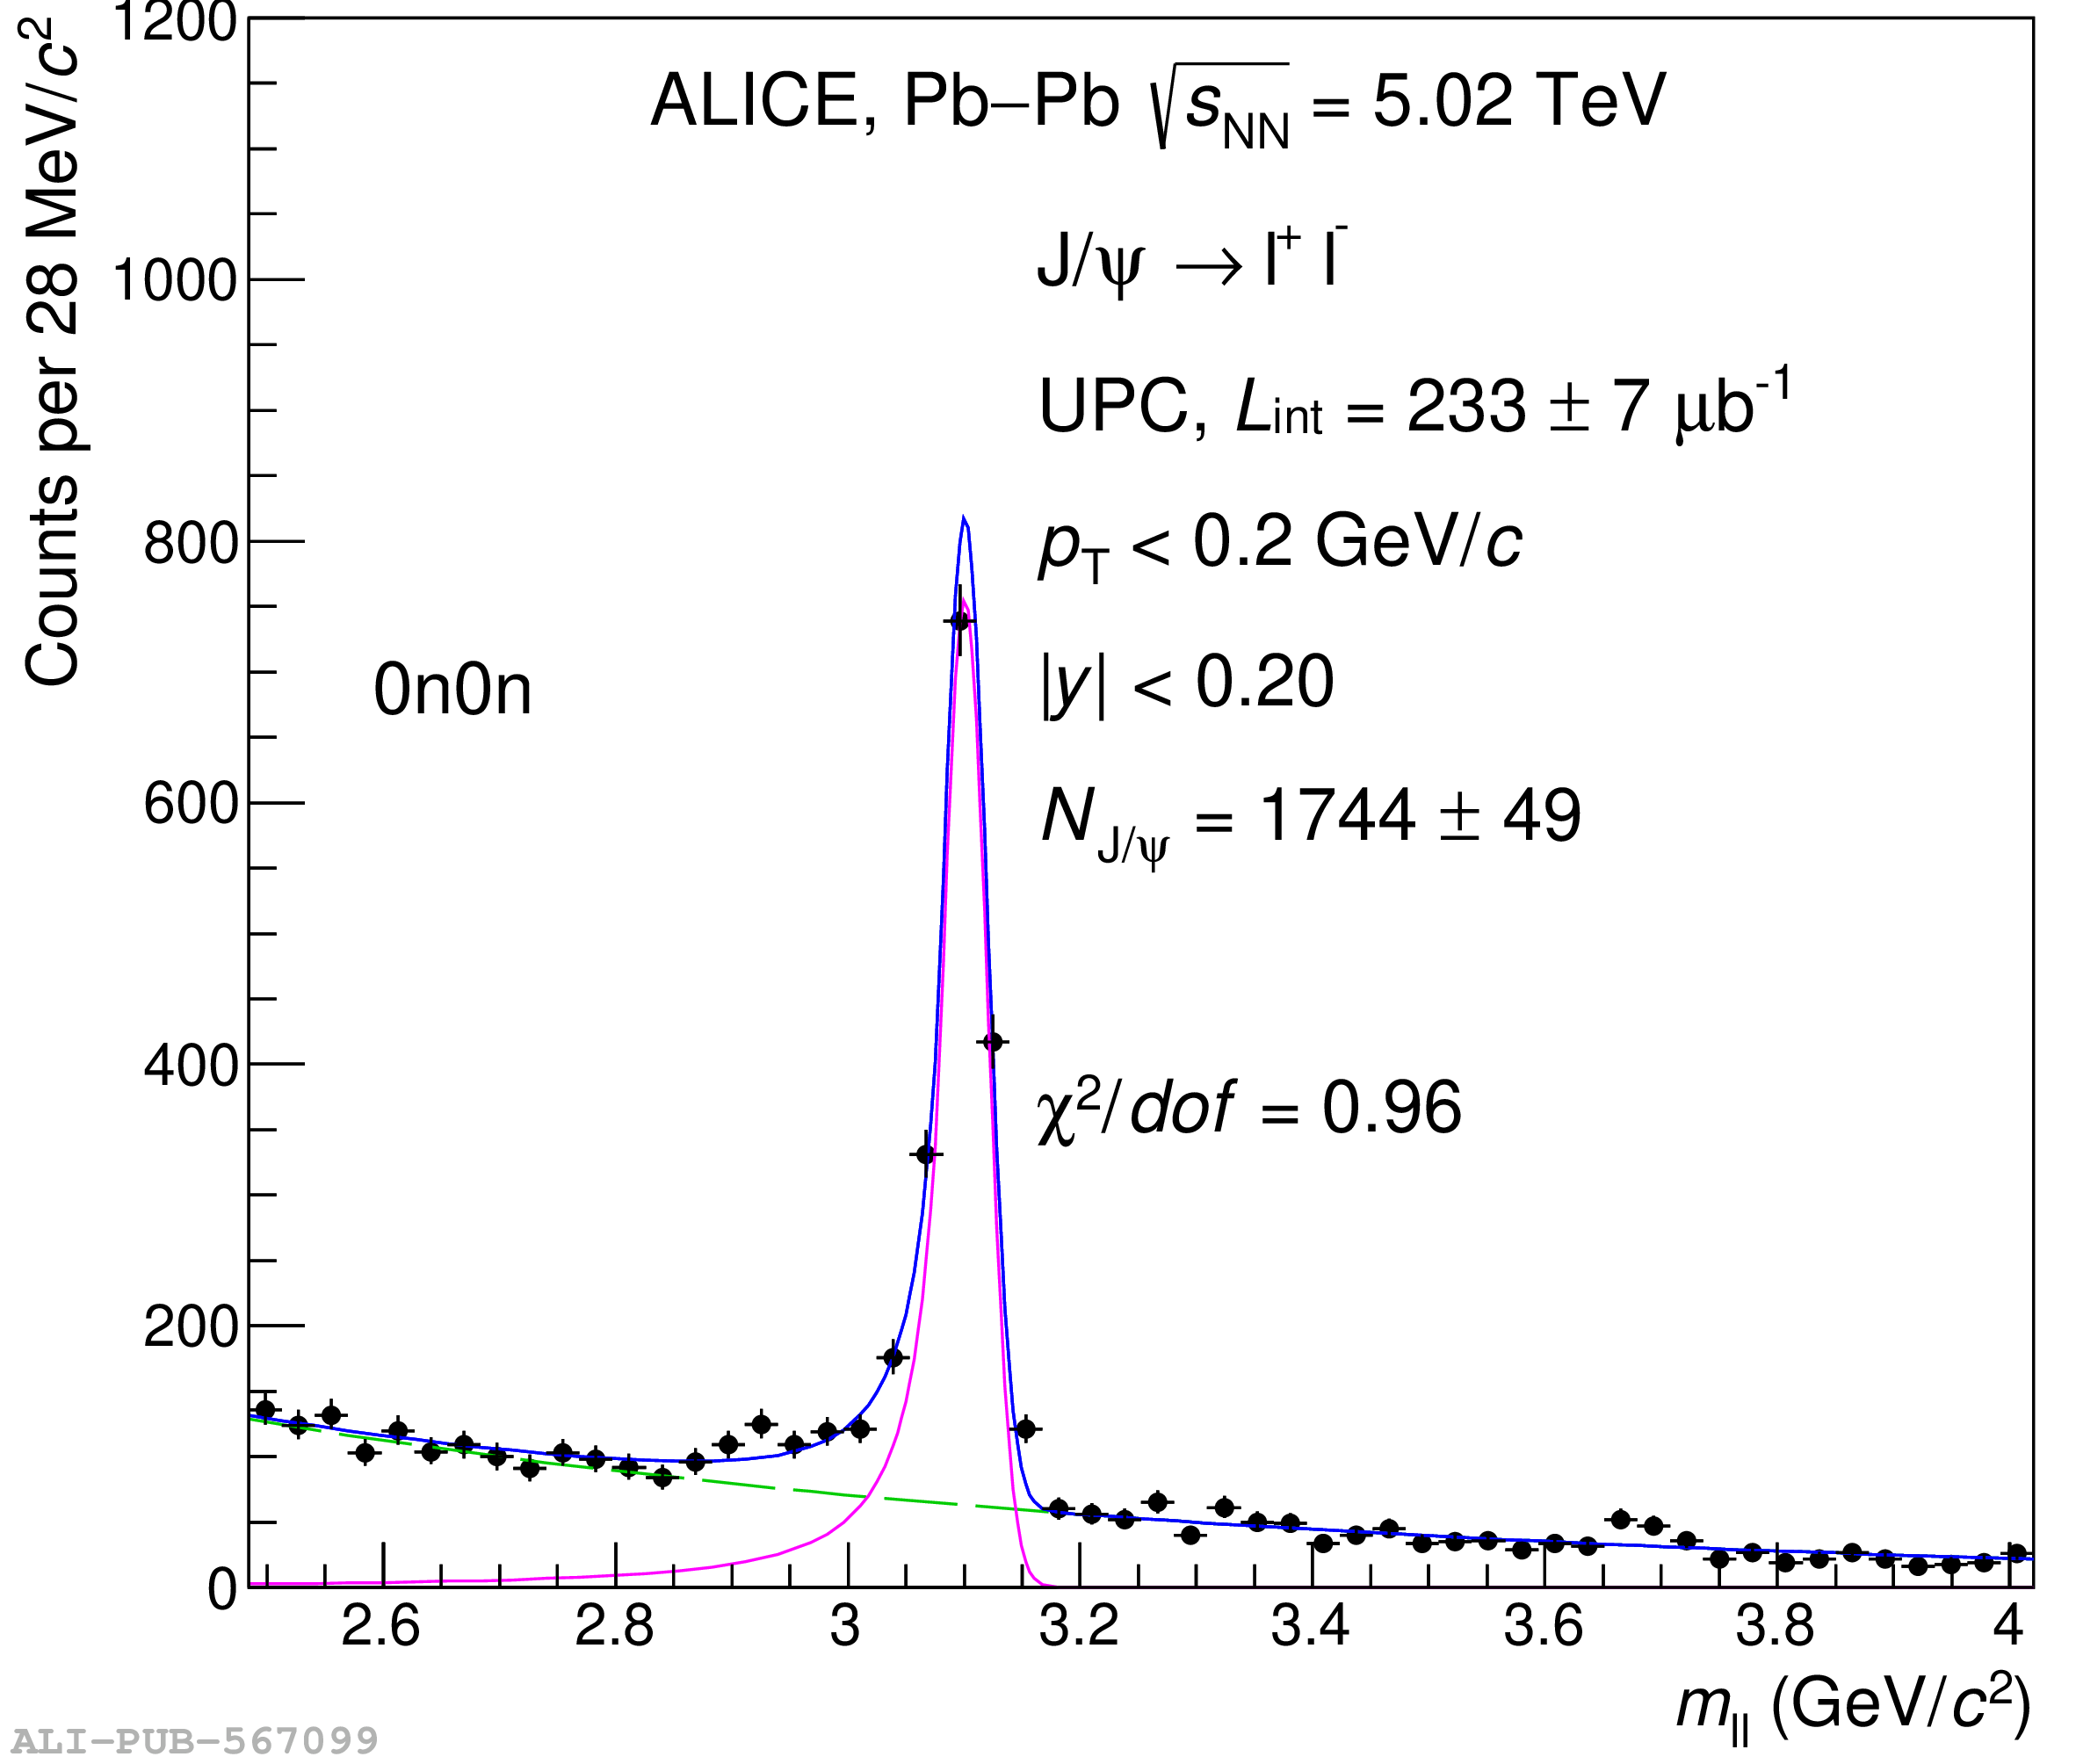   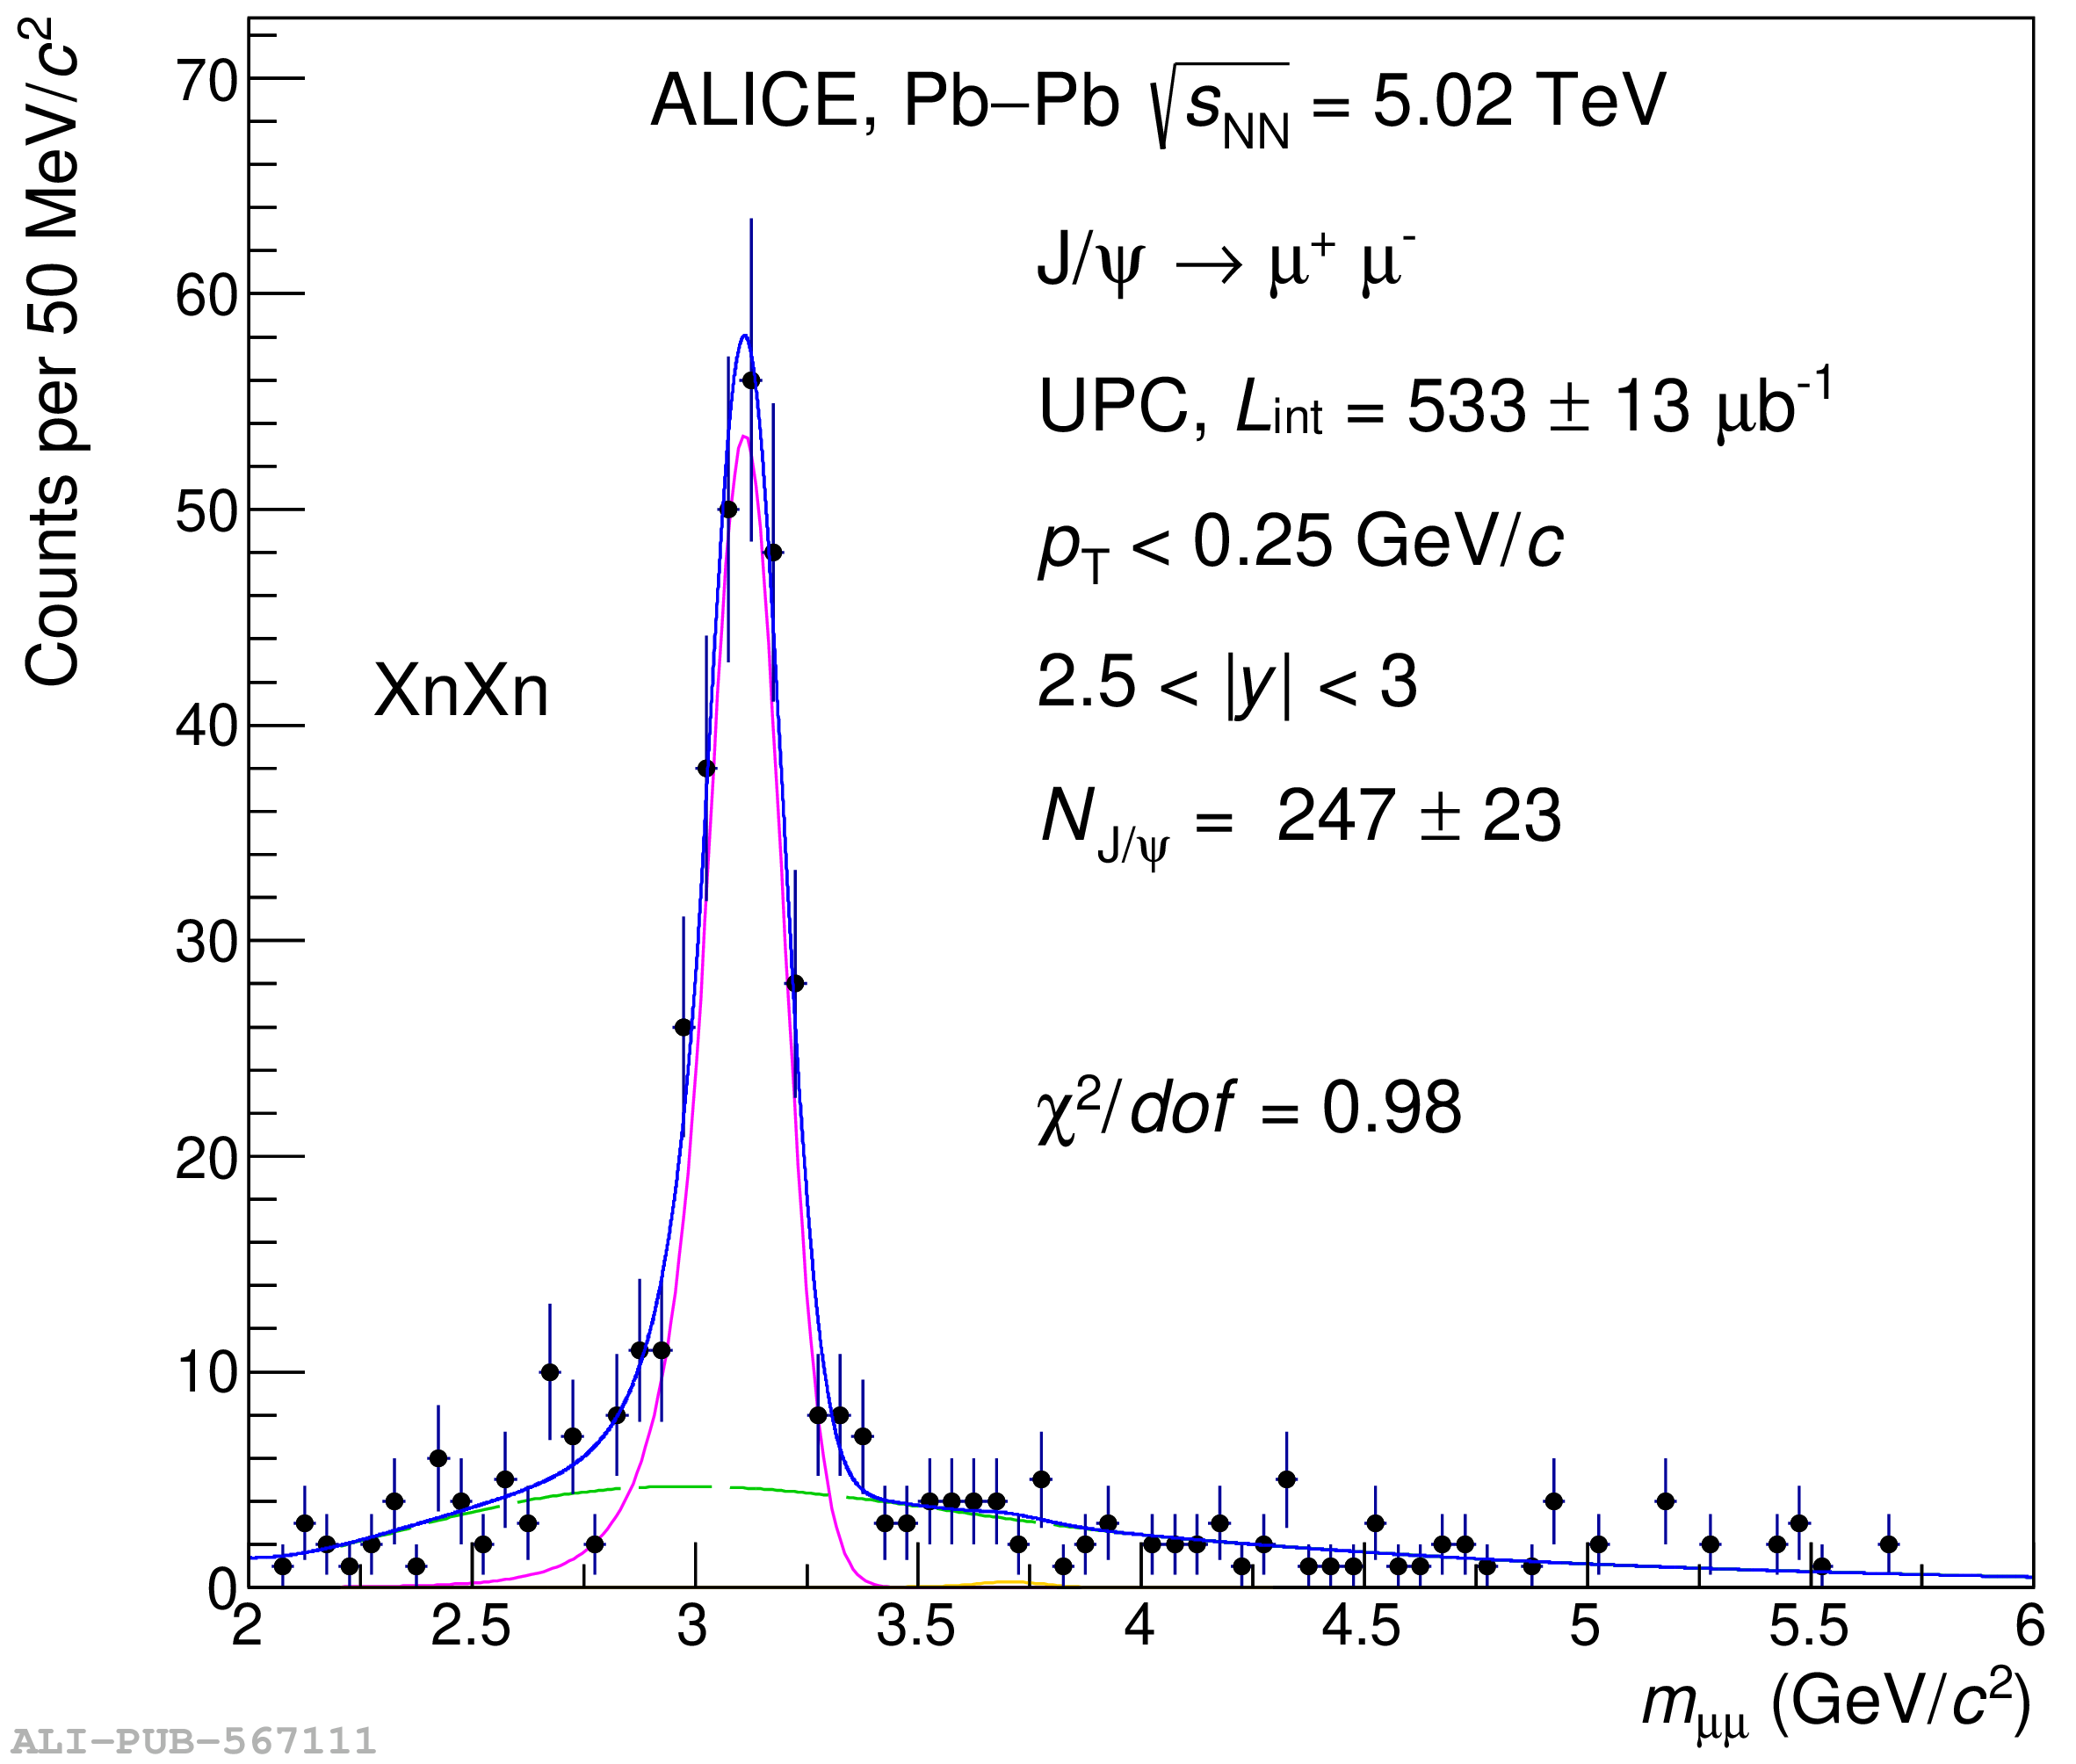 |
Figure 2
Transverse momentum distributions for events of the 0n0n (left) and XnXn (right) neutron classes measured at mid (top) and forward rapidity (bottom). The solid black markers represent data, the vertical line through each of them is the associated statistical uncertainty. The black lines depict the fit model described in the text. | 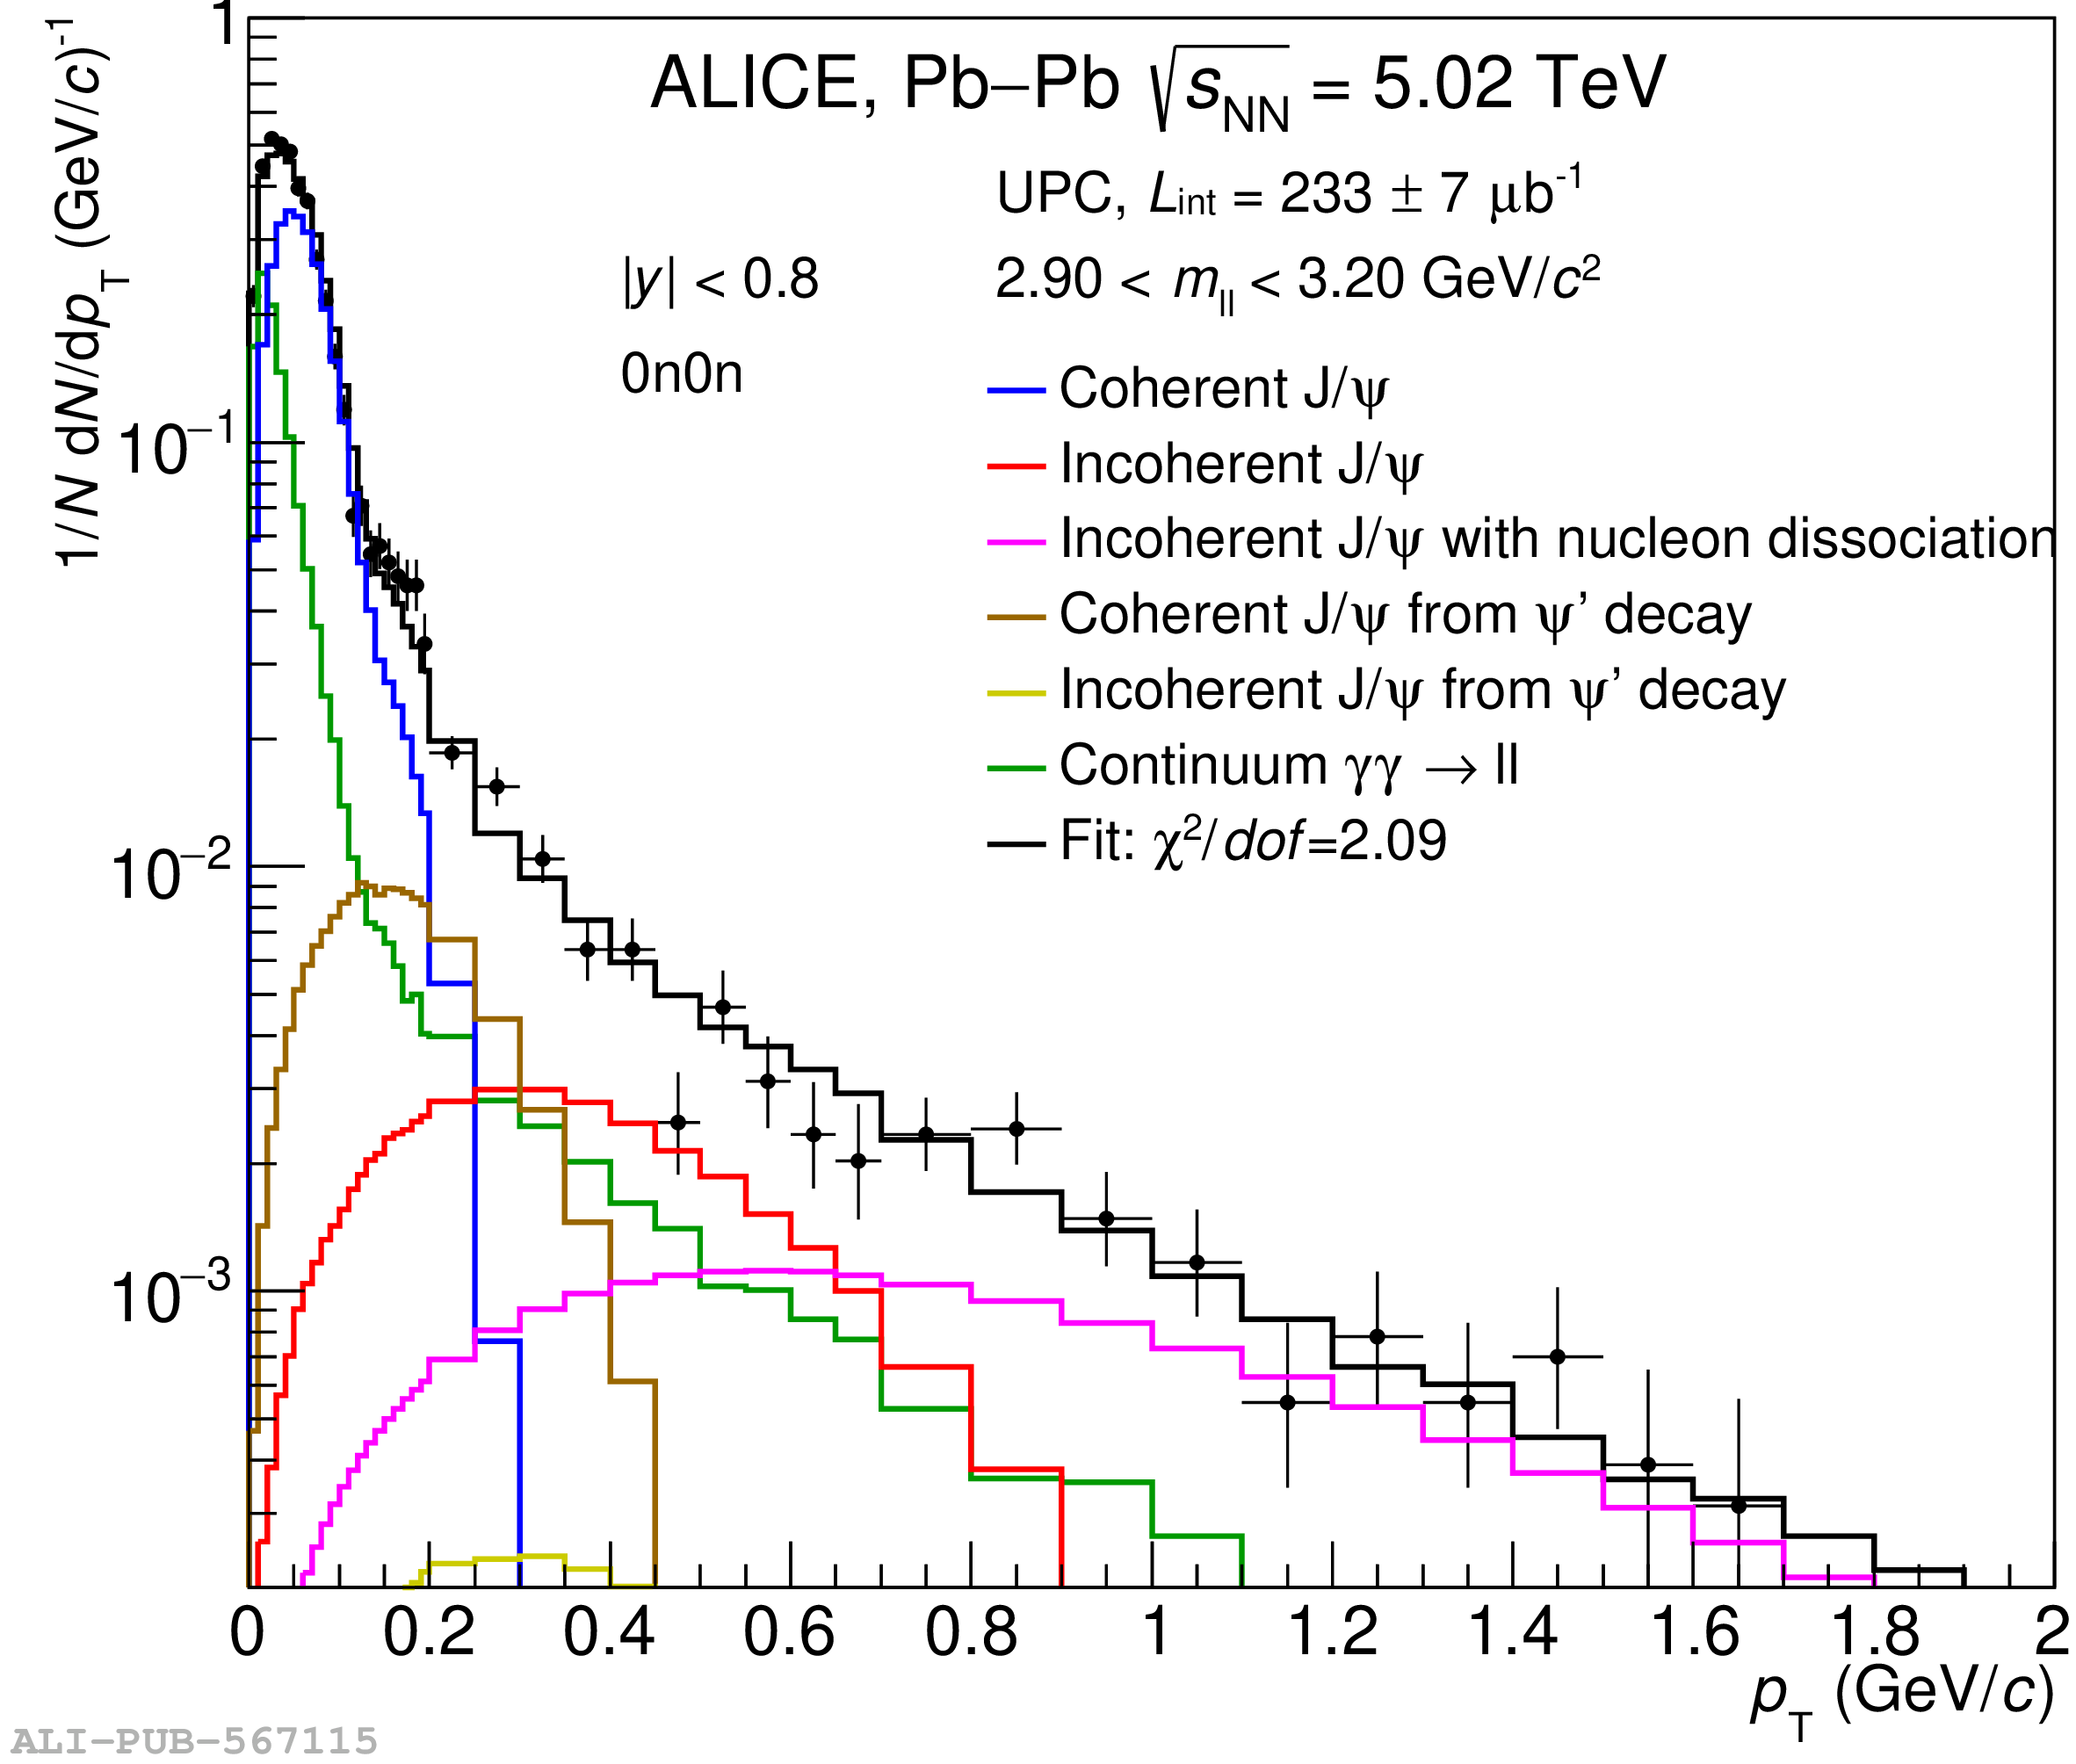 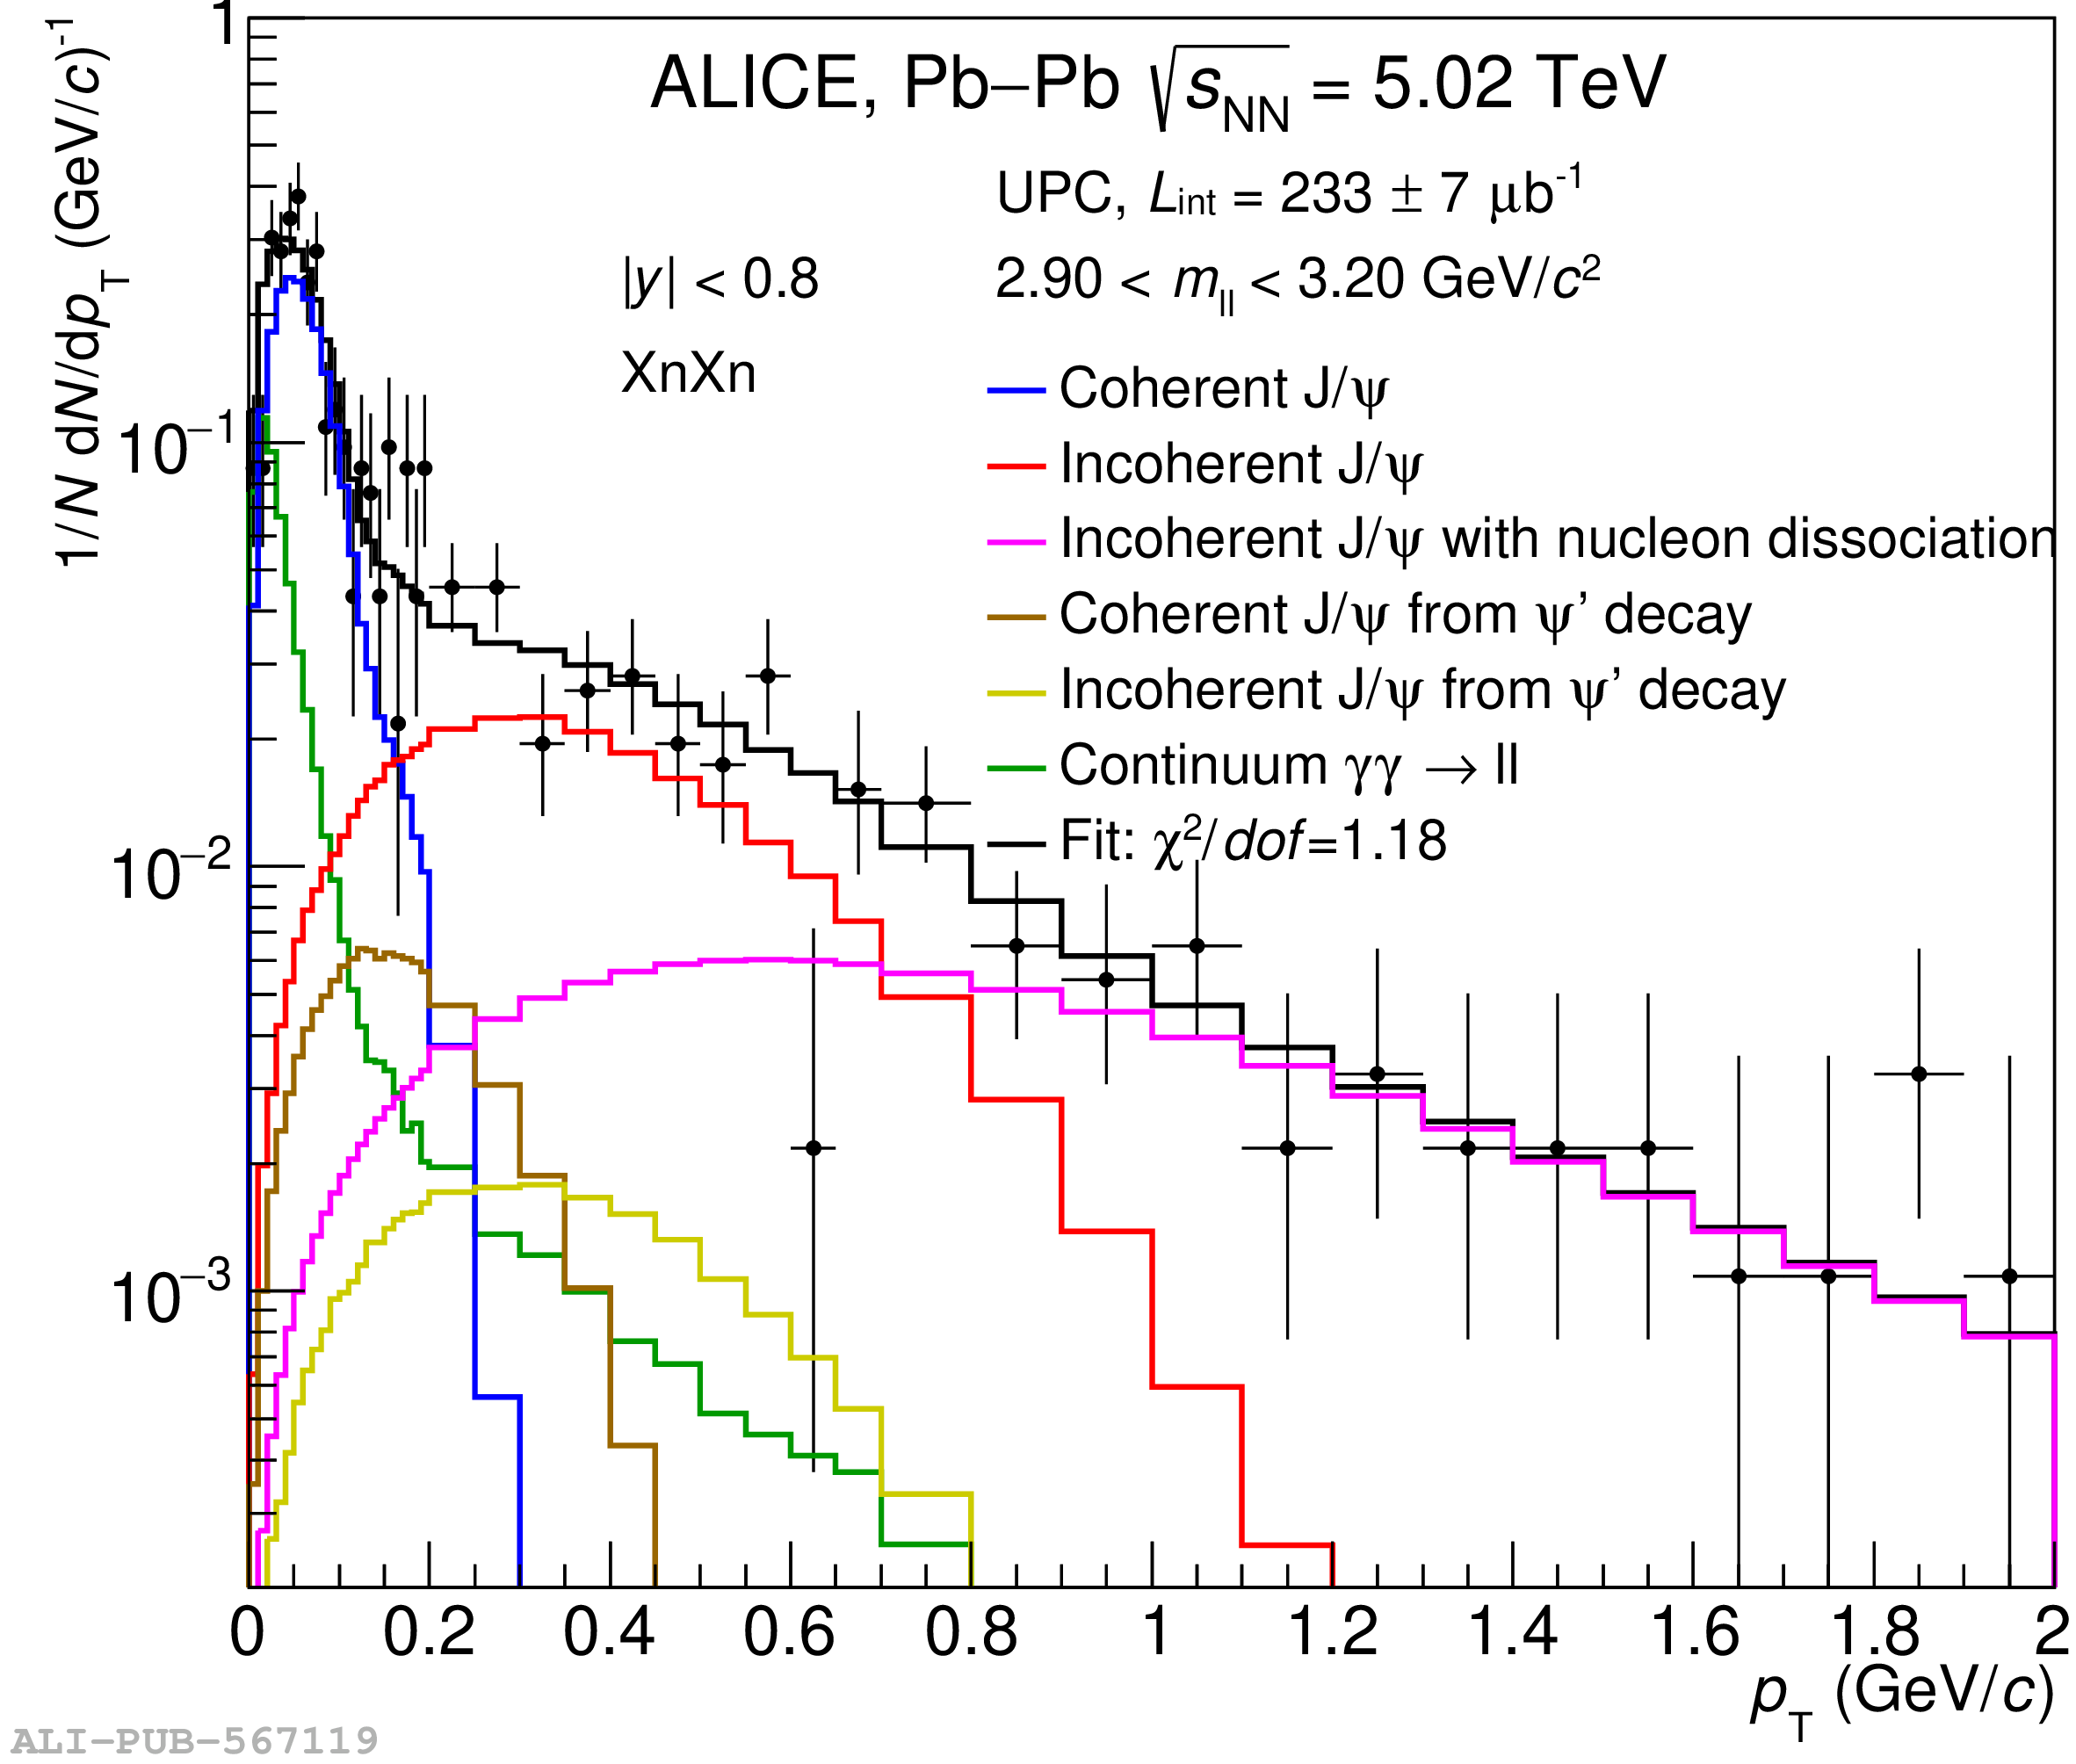 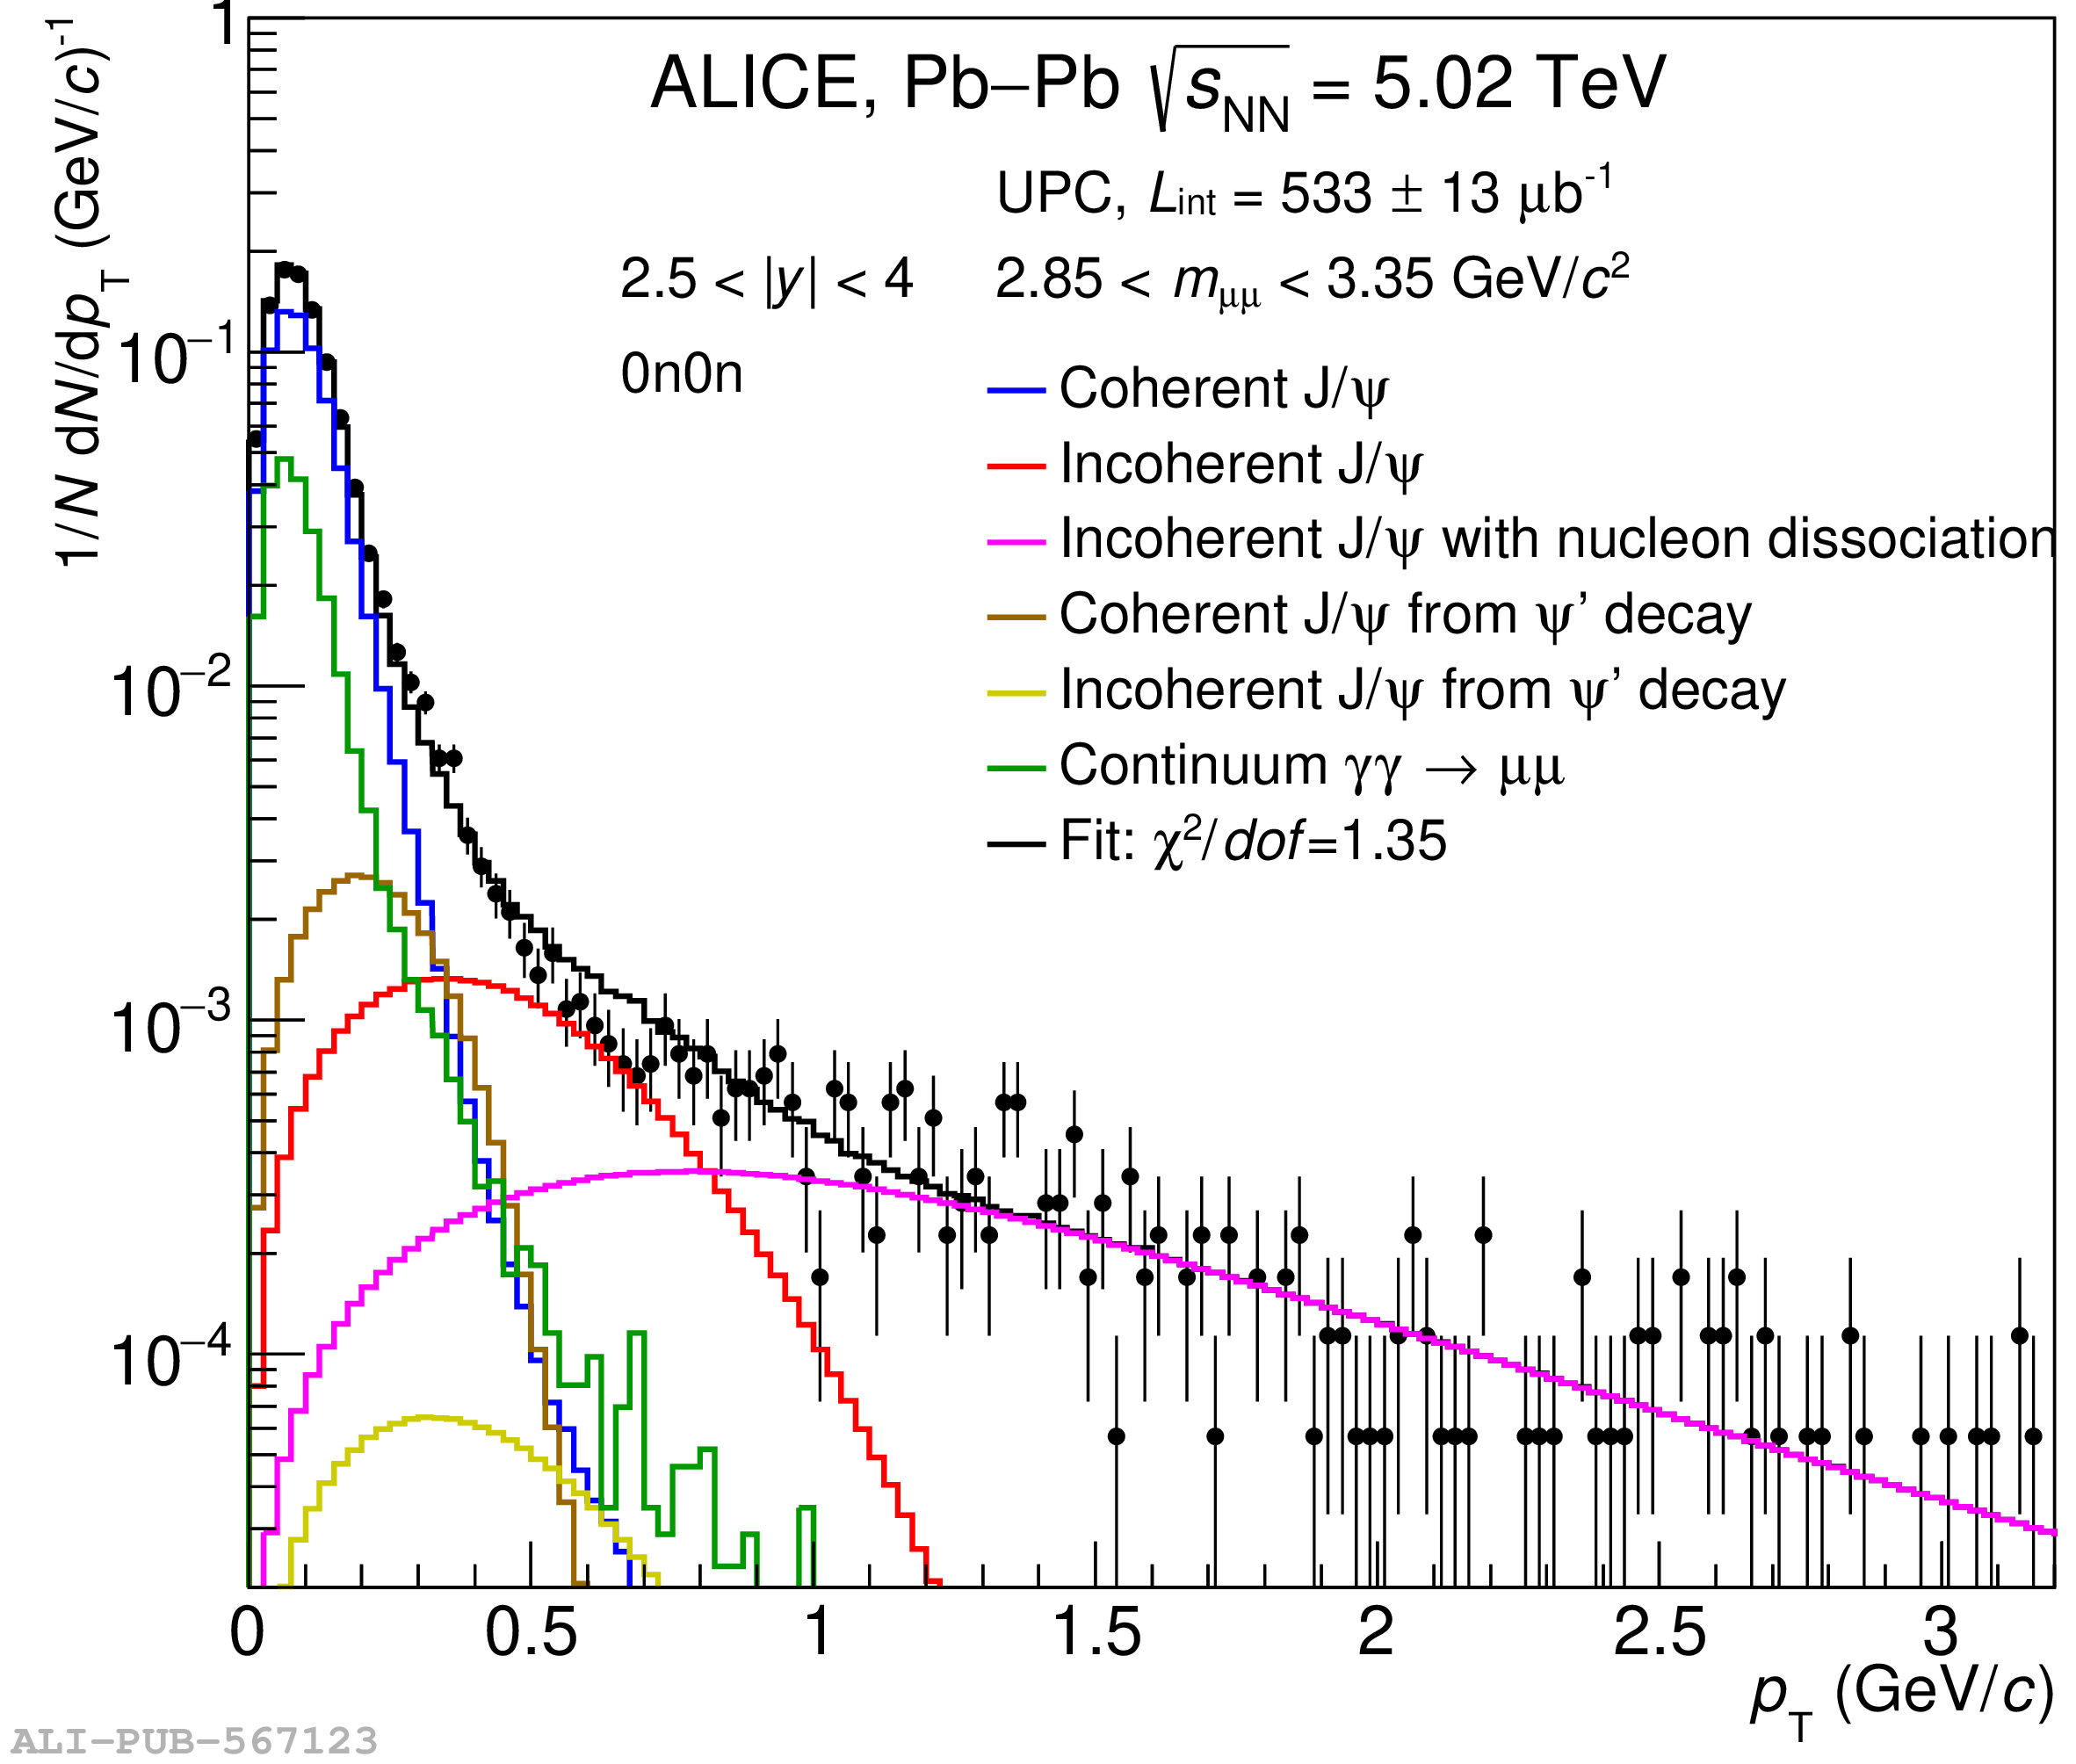  |
Figure 3
Measured cross section for the coherent production of ${\rm J}/\psi$ in UPCs at $\sqrt{s_{\mathrm{NN}}}$ = 5.02 TeV. The solid markers represent the measured cross section (the measurement at $0.2<\lvert y\rvert <0.8$ is shown at negative rapidities and reflected into positive rapidities with an open marker). The vertical line across a marker is the sum in quadrature of the statistical and uncorrelated systematic uncertainty. The width of the boxes depicts the range in rapidity covered by each measurement, while the height of a box is the sum in quadrature of the correlated systematic uncertainties and the effect of migrations across neutron classes. Note that the uncertainties from migrations are anti-correlated between the 0n0n and the other two neutron classes in each rapidity interval. The lines depict the prediction of the different models discussed in Sec. 2. |  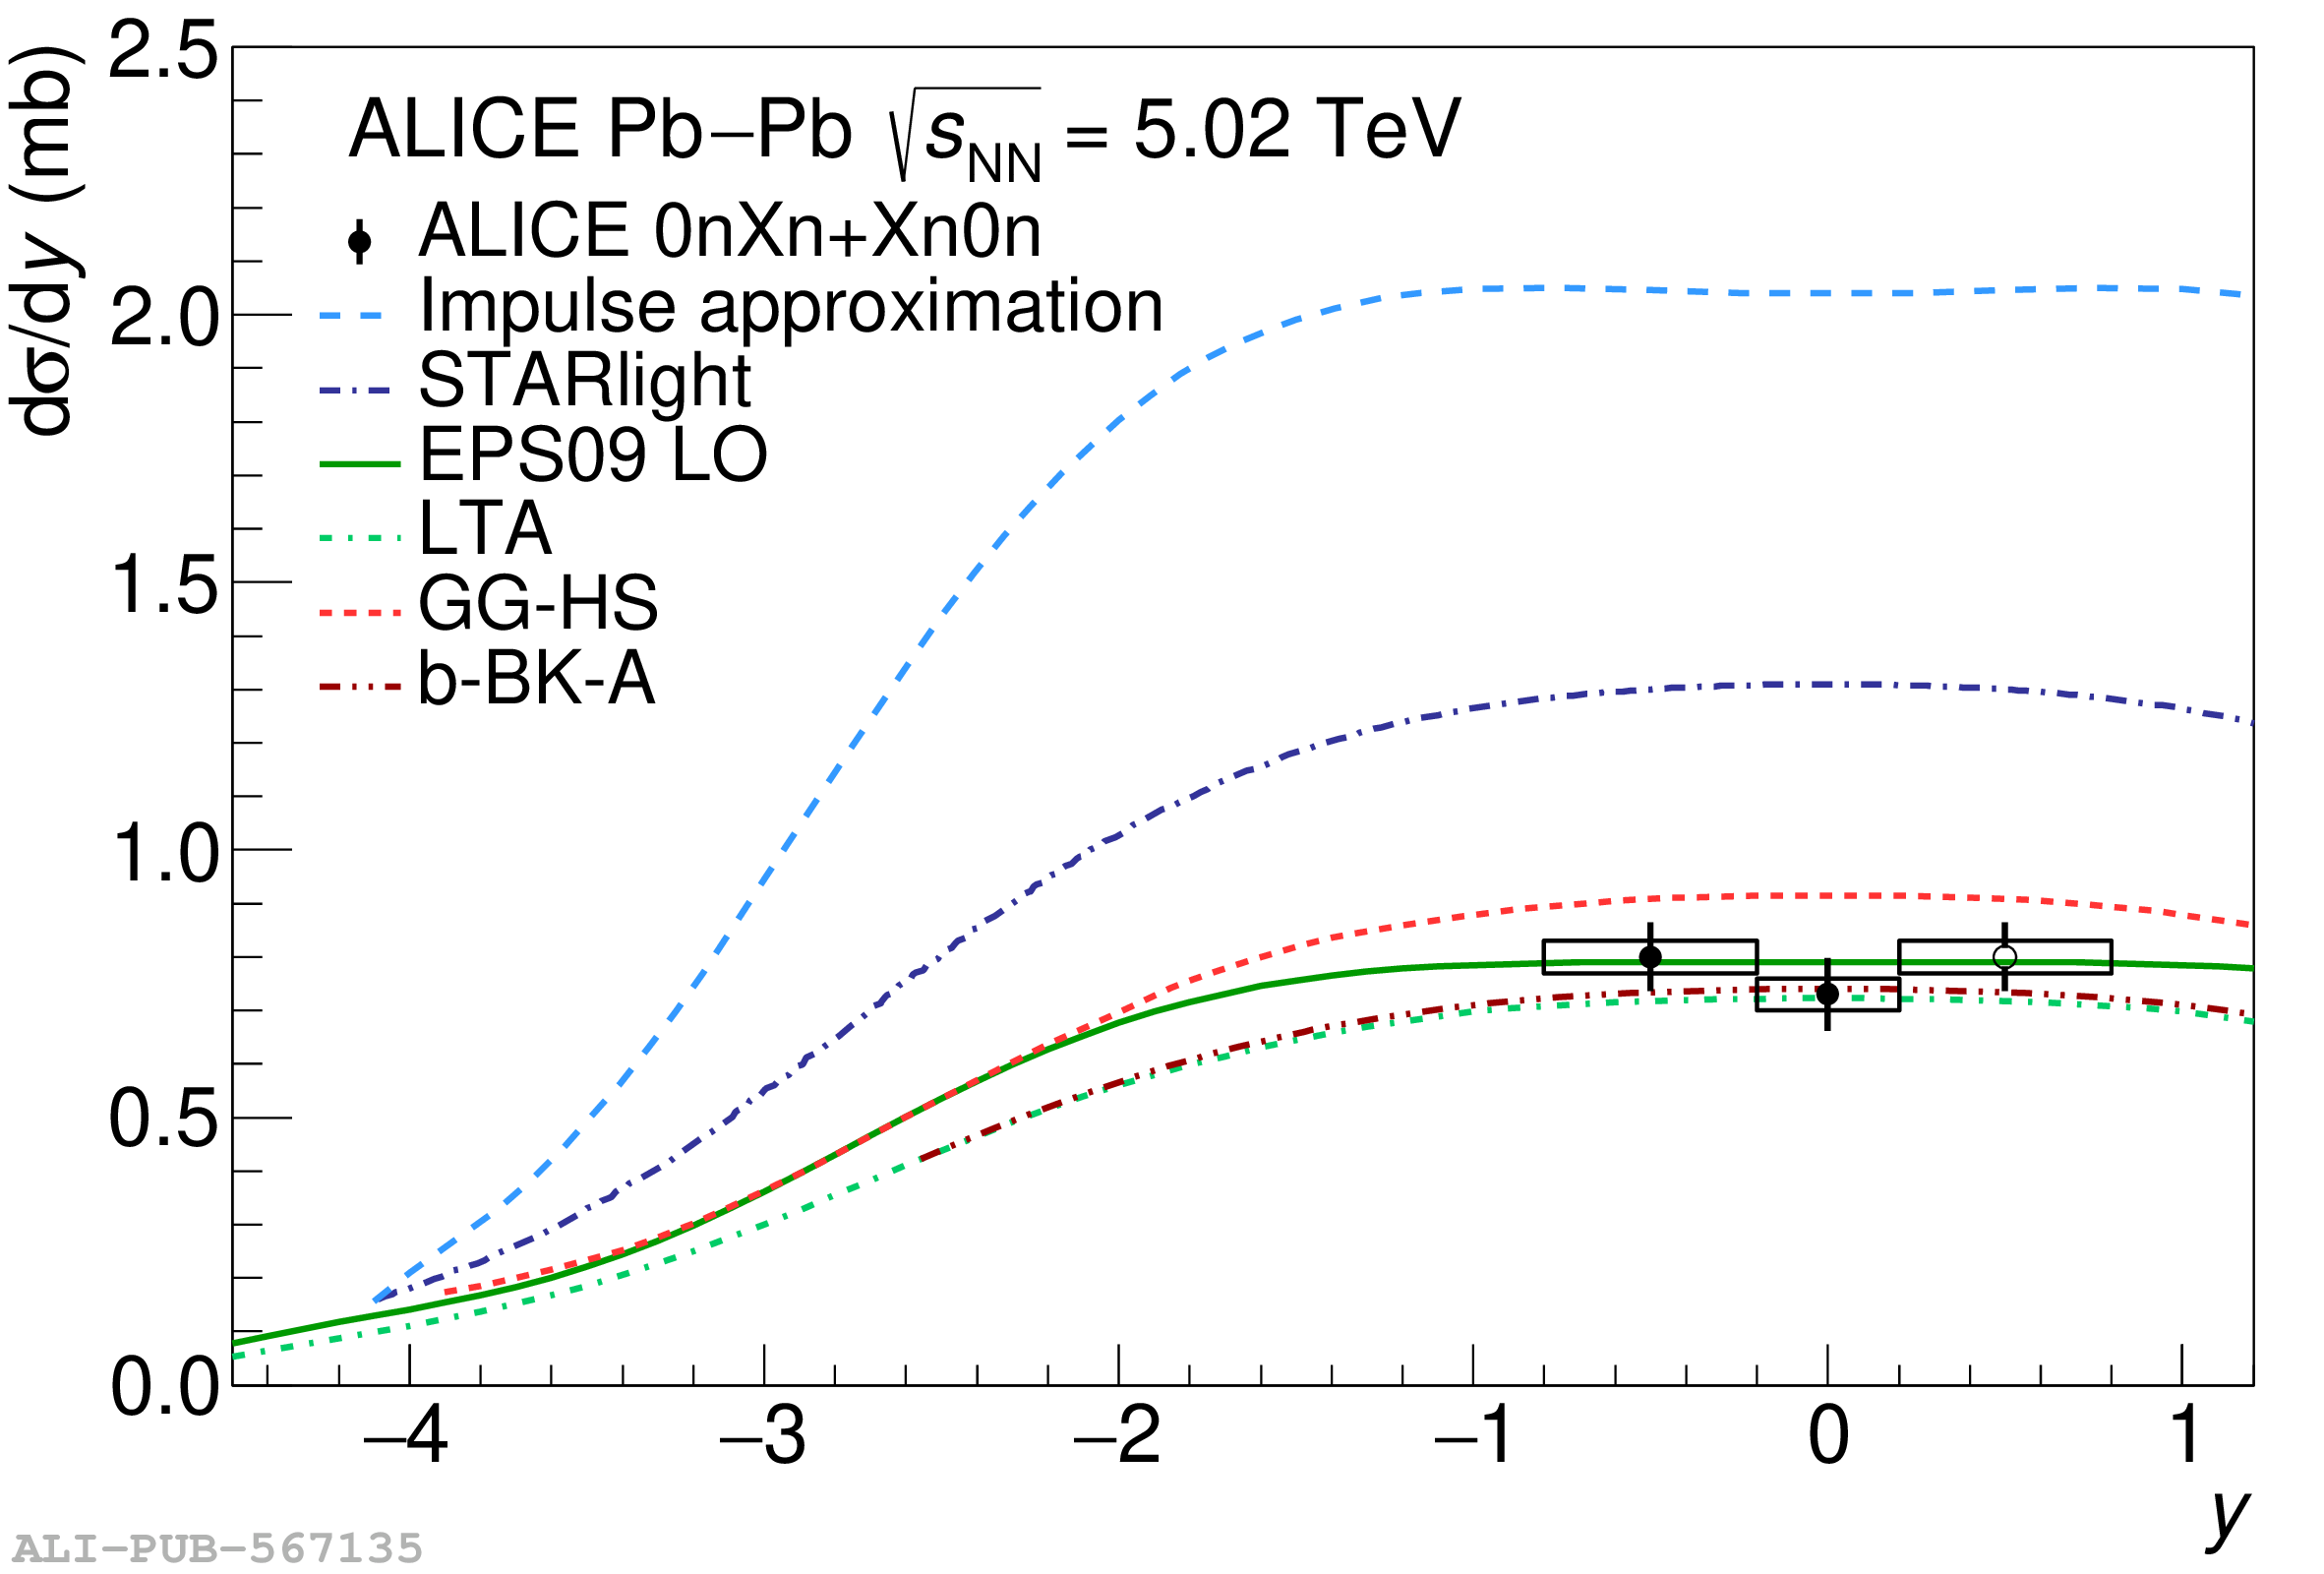 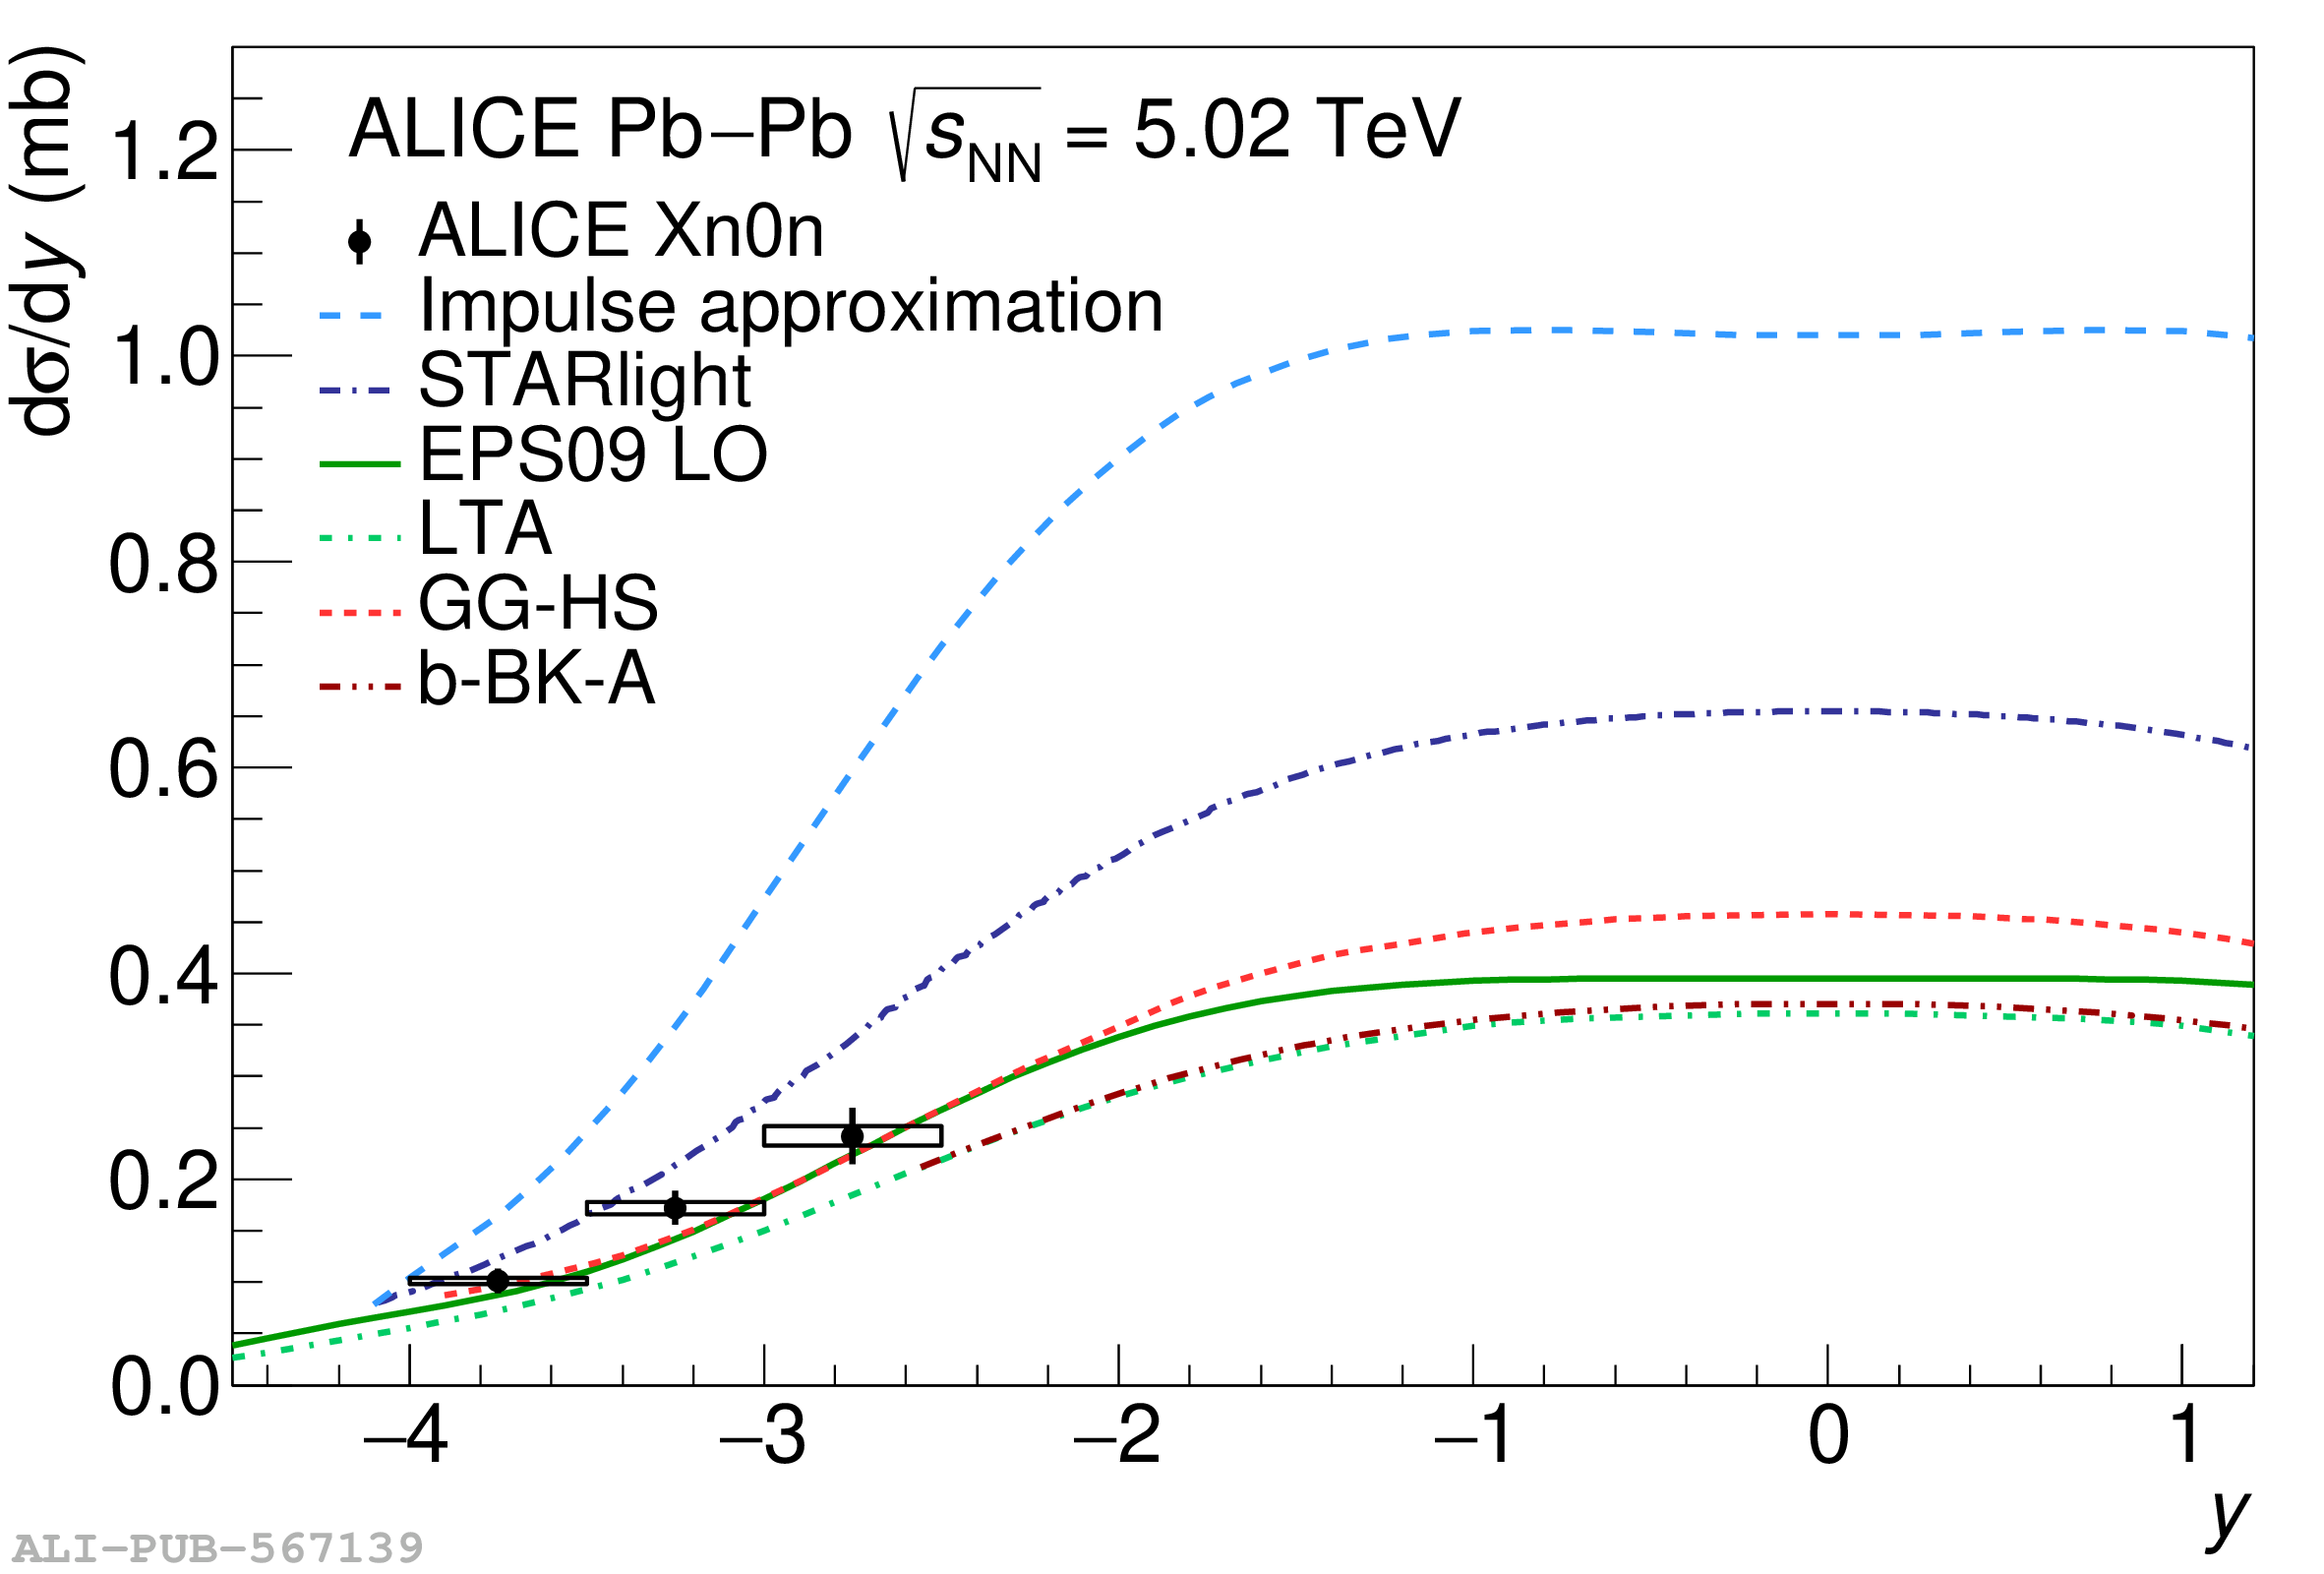 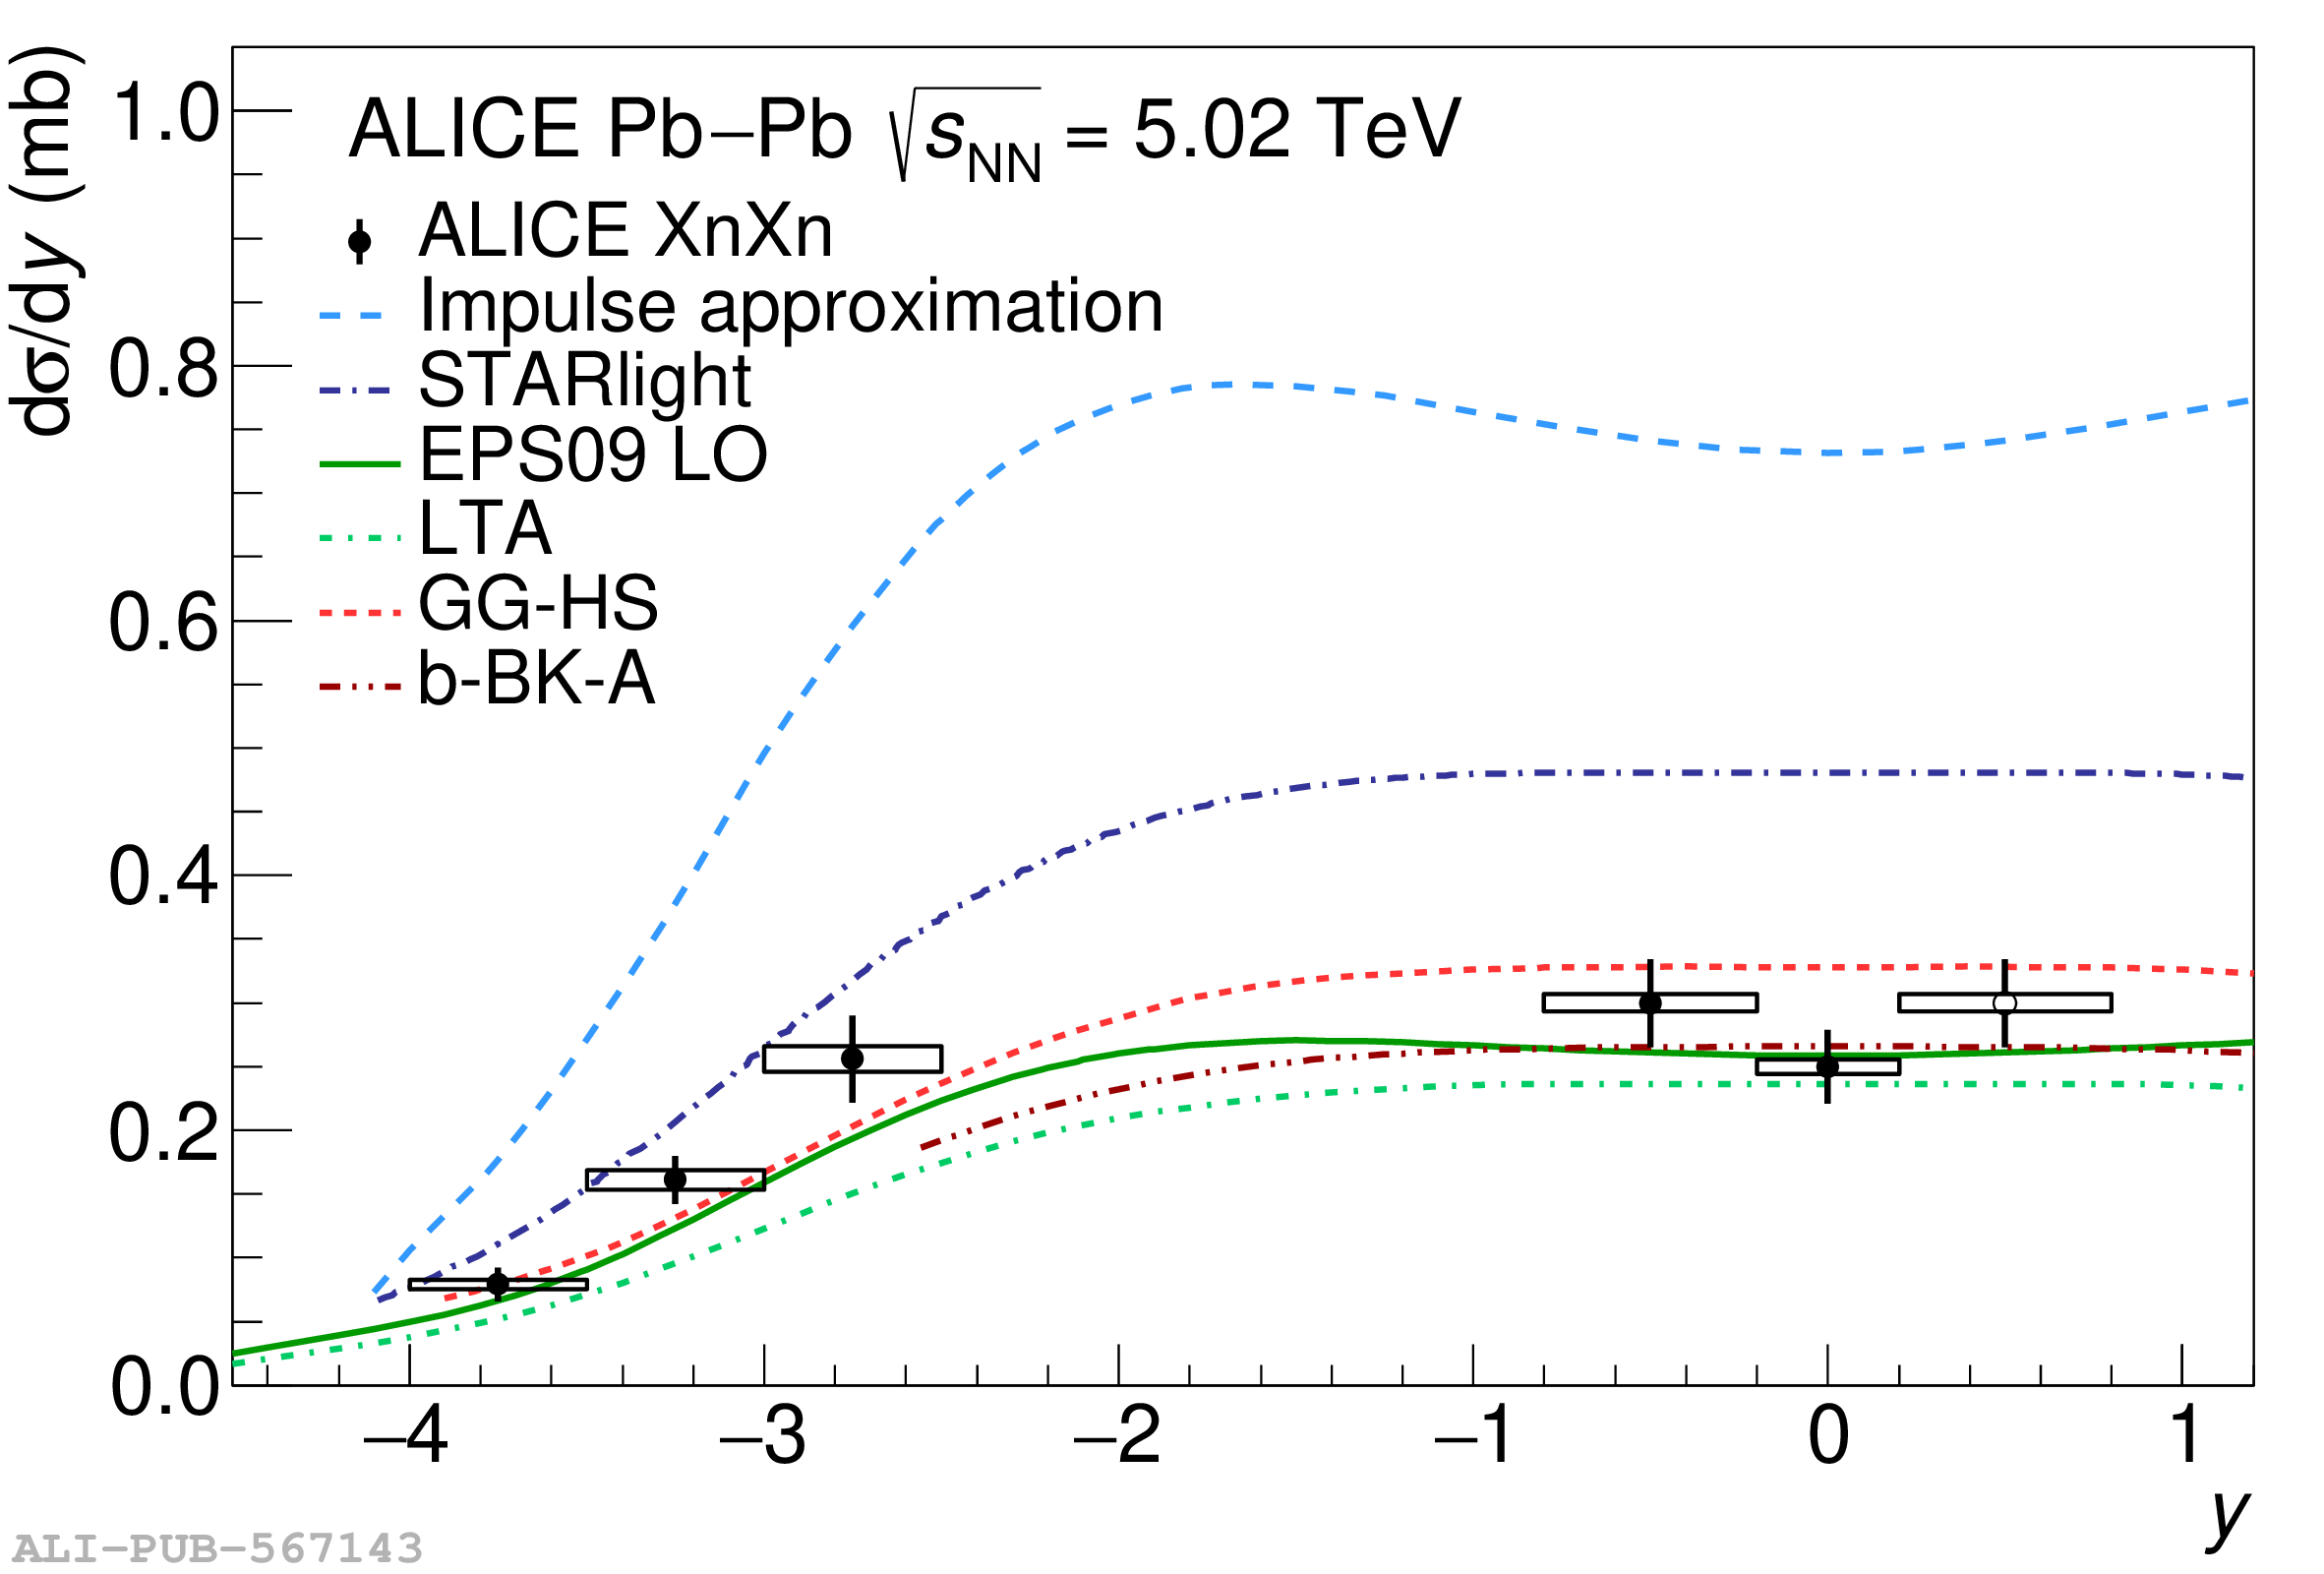 |
Figure 4
Photonuclear cross section for the $\gamma+{\rm Pb}\to {\rm J}/\psi+{\rm Pb}$ process as a function of $W_{\gamma\, \mathrm{Pb, n}}$ (lower axis) or Bjorken-$x$ (upper axis). The solid markers represent the measured cross section. The vertical line across a marker is the uncorrelated uncertainty. The height of an empty box is the sum in quadrature of the correlated systematic uncertainties and the effect of migrations across neutron classes. The gray box represents the theoretical uncertainty coming from the computation of the photon flux. The lines depict the prediction of the different models discussed in Sec. 2. The open triangular and square markers show the cross sections extracted in Refs. [17,18] using ALICE Run 1 data. | 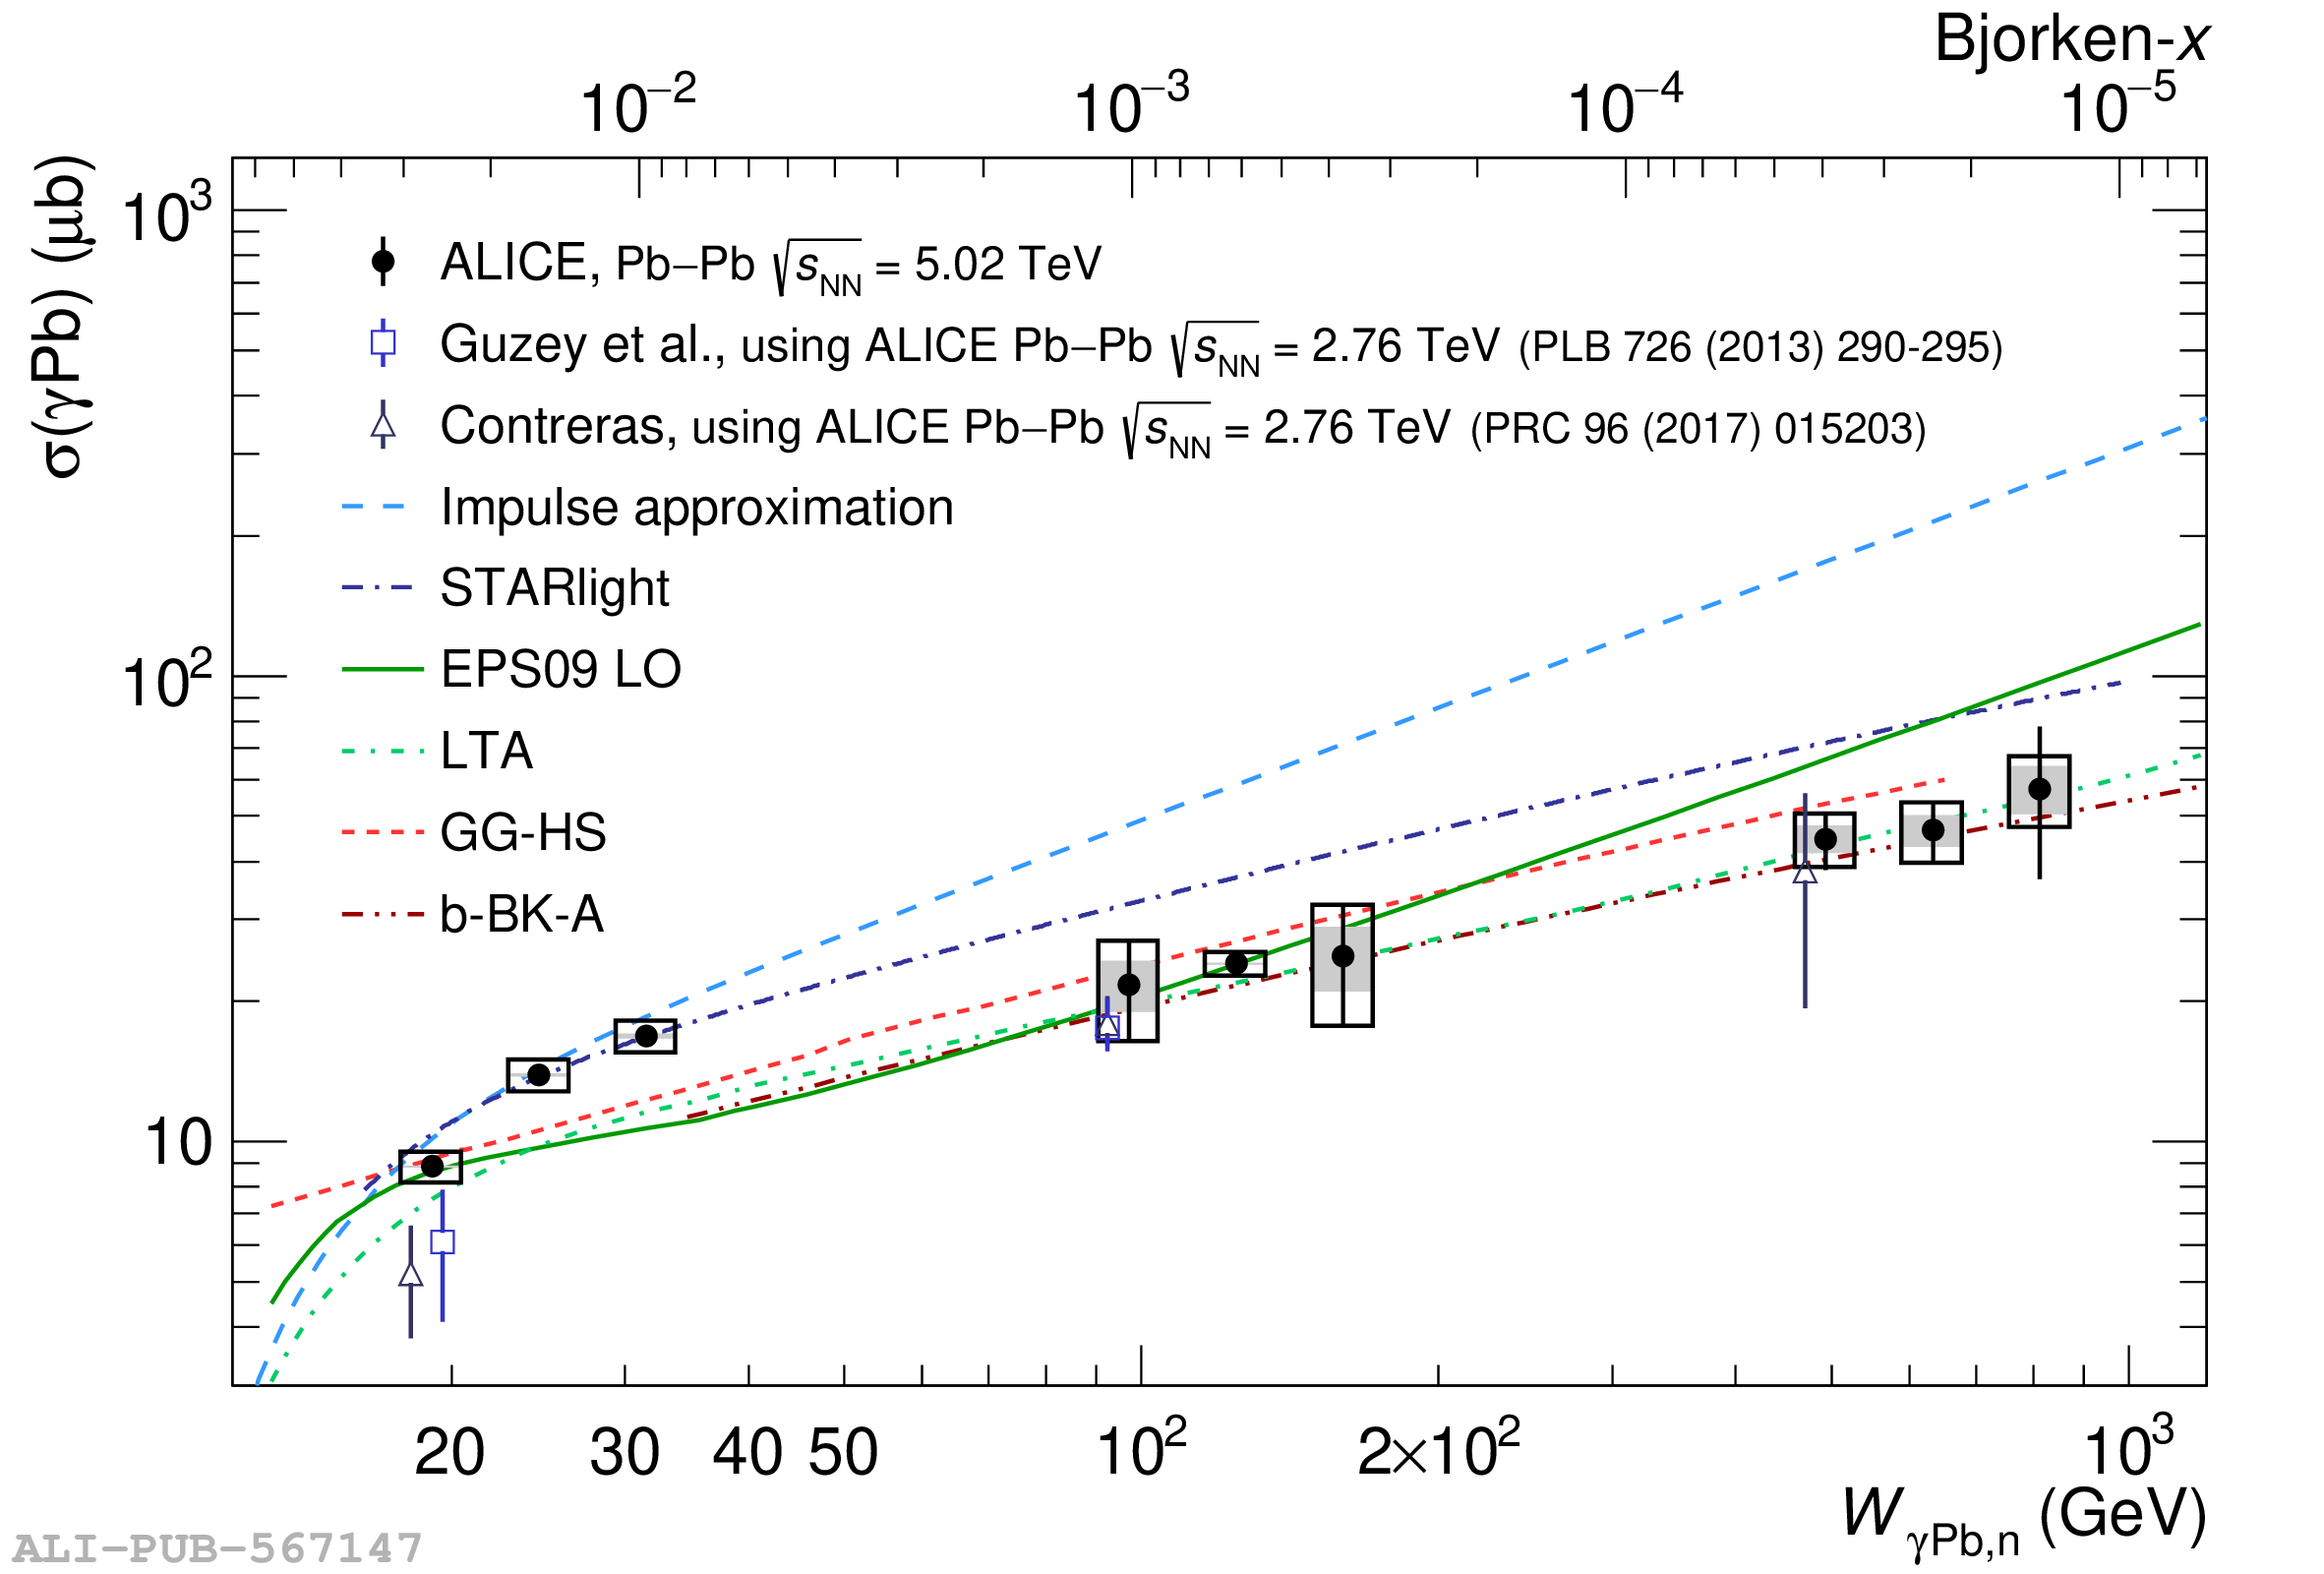 |
Figure 5
Nuclear suppression factor for the $\gamma+{\rm Pb}\to {\rm J}/\psi+{\rm Pb}$ process as a function of $W_{\gamma\, \mathrm{Pb, n}}$ (lower axis) or Bjorken-$x$ (upper axis). The solid markers represent the measurement. The vertical line across a marker is the uncorrelated uncertainty. The height of an empty box is the sum in quadrature of the correlated systematic uncertainties and the effect of migrations across neutron classes. A gray box represents the theoretical uncertainty coming from the computation of the photon flux and of the impulse approximation. The lines depict the prediction of the different models discussed in Sec. 2. The open triangular and square markers show the nuclear suppression factor extracted in Refs. [17,18] using ALICE Run 1 data. |  |