Transverse momentum distributions for events of the 0n0n (left) and XnXn (right) neutron classes measured at mid (top) and forward rapidity (bottom). The solid black markers represent data, the vertical line through each of them is the associated statistical uncertainty. The black lines depict the fit model described in the text. | 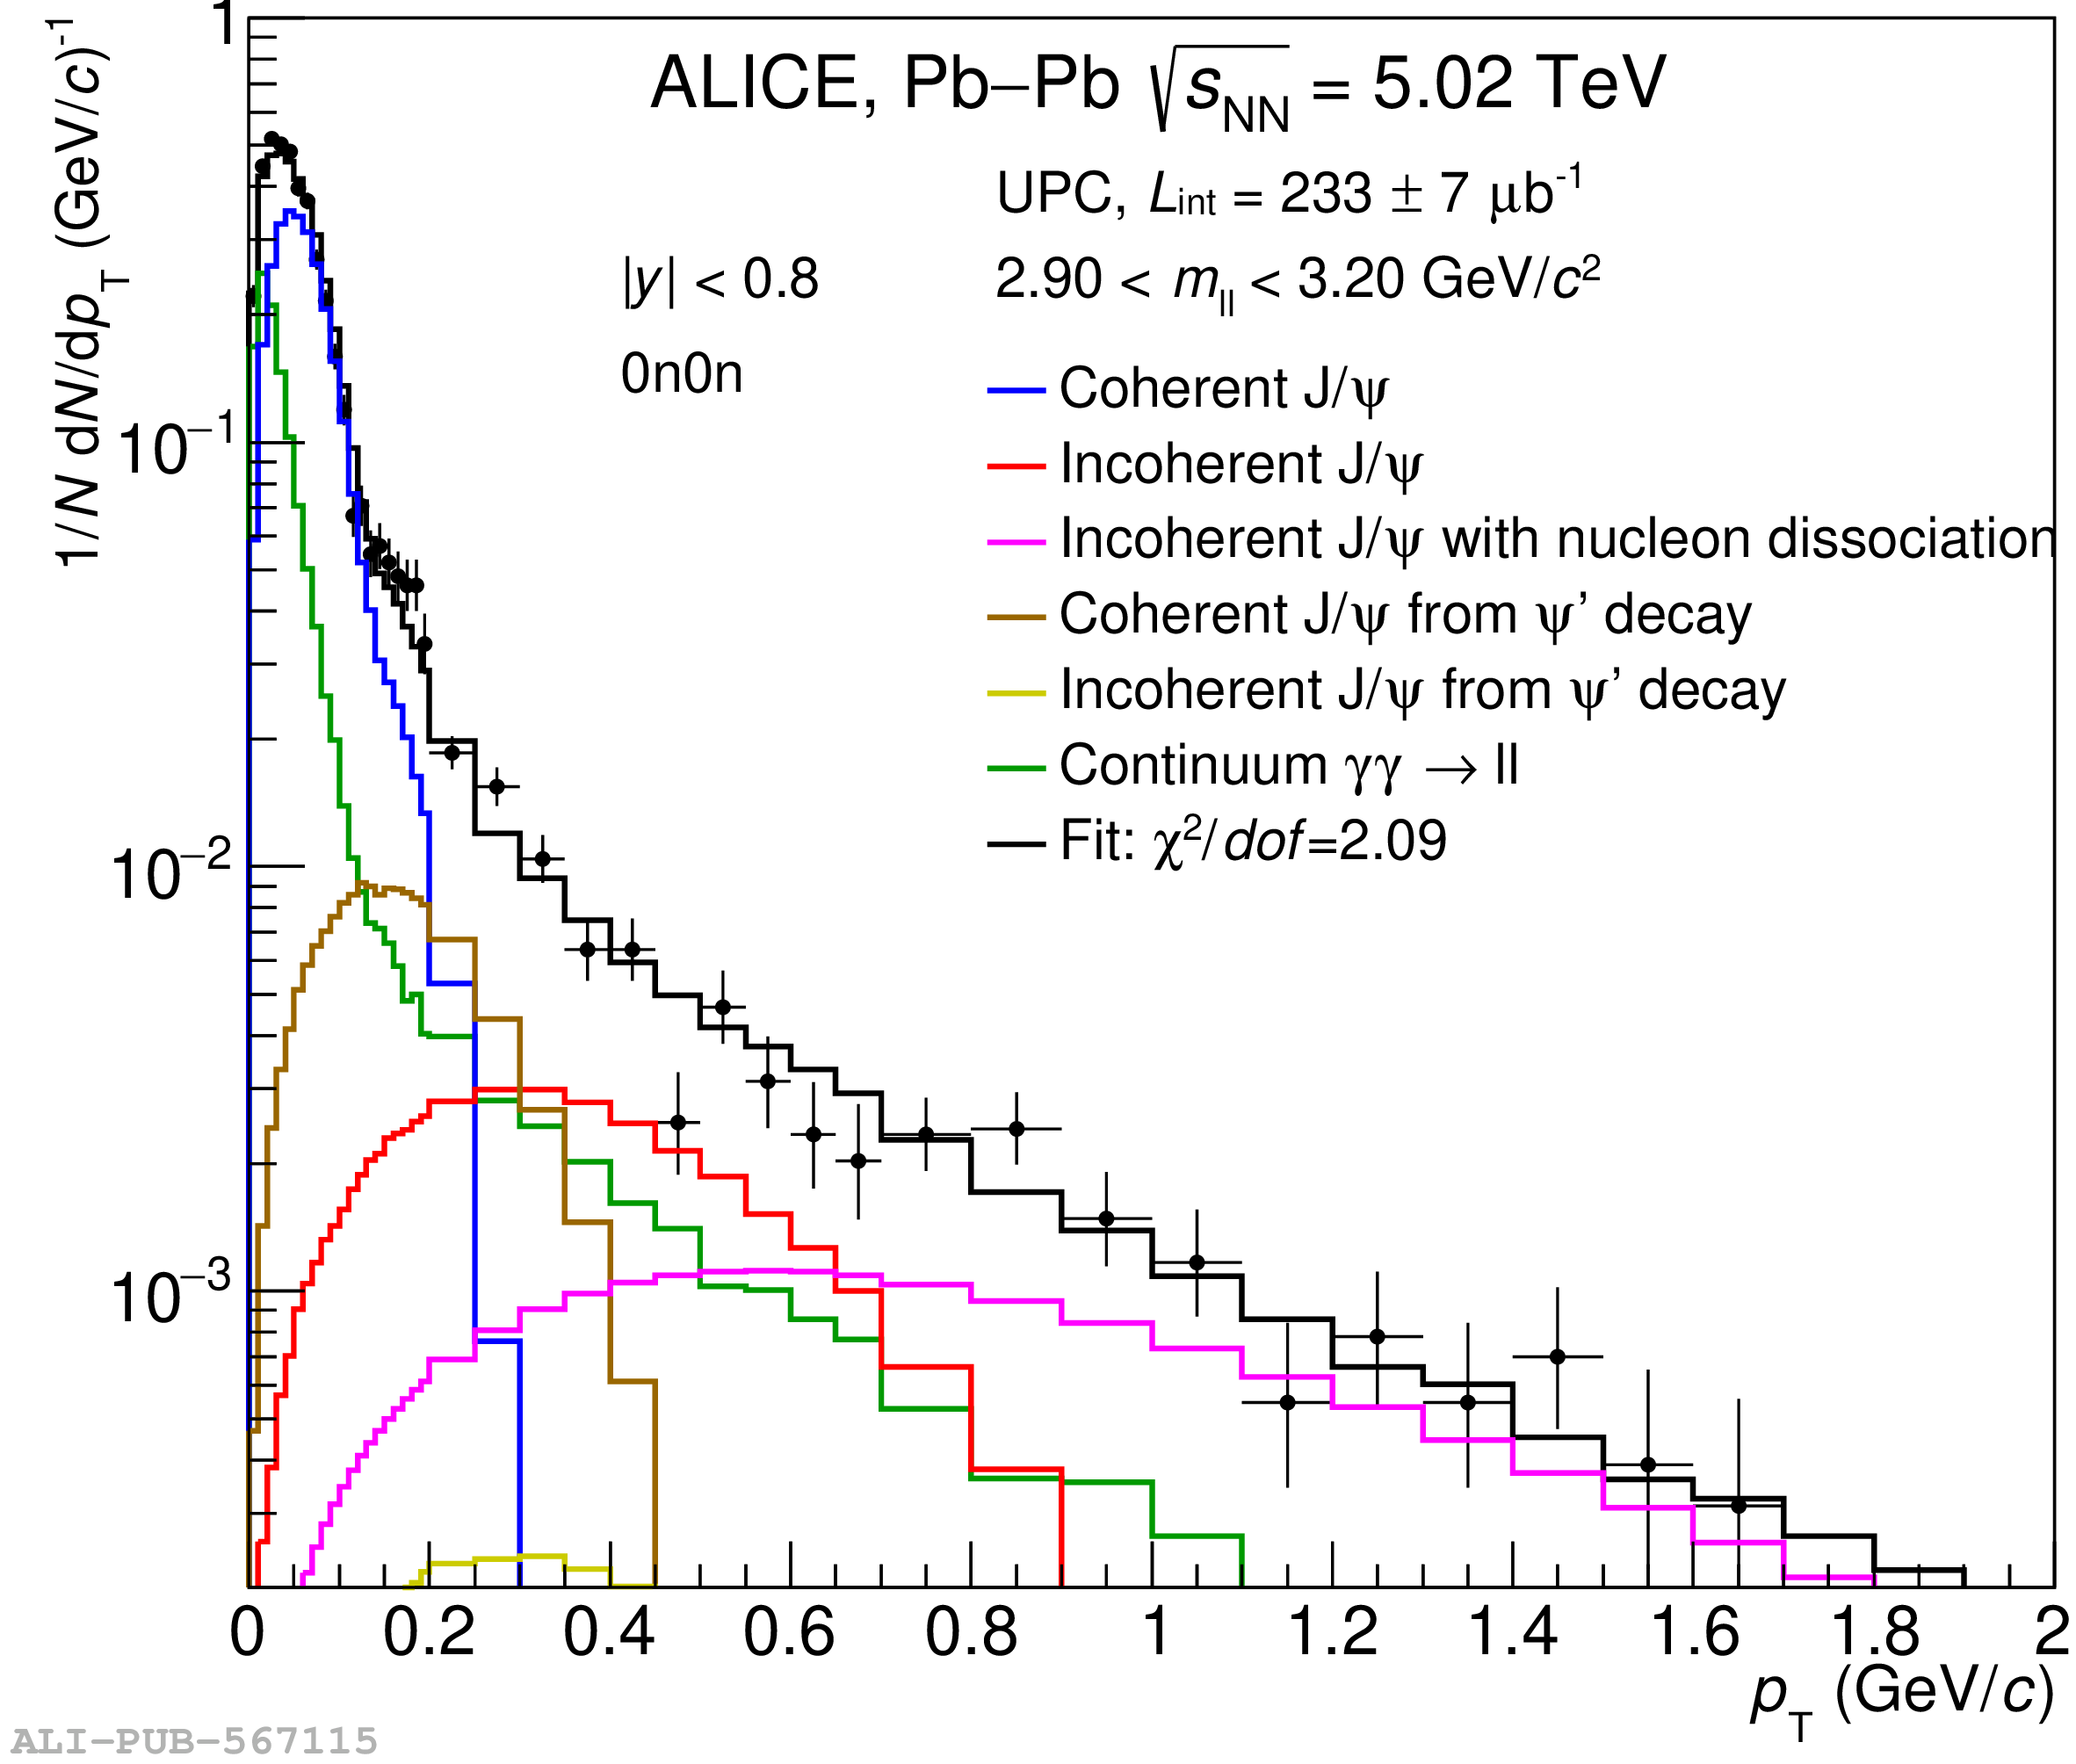 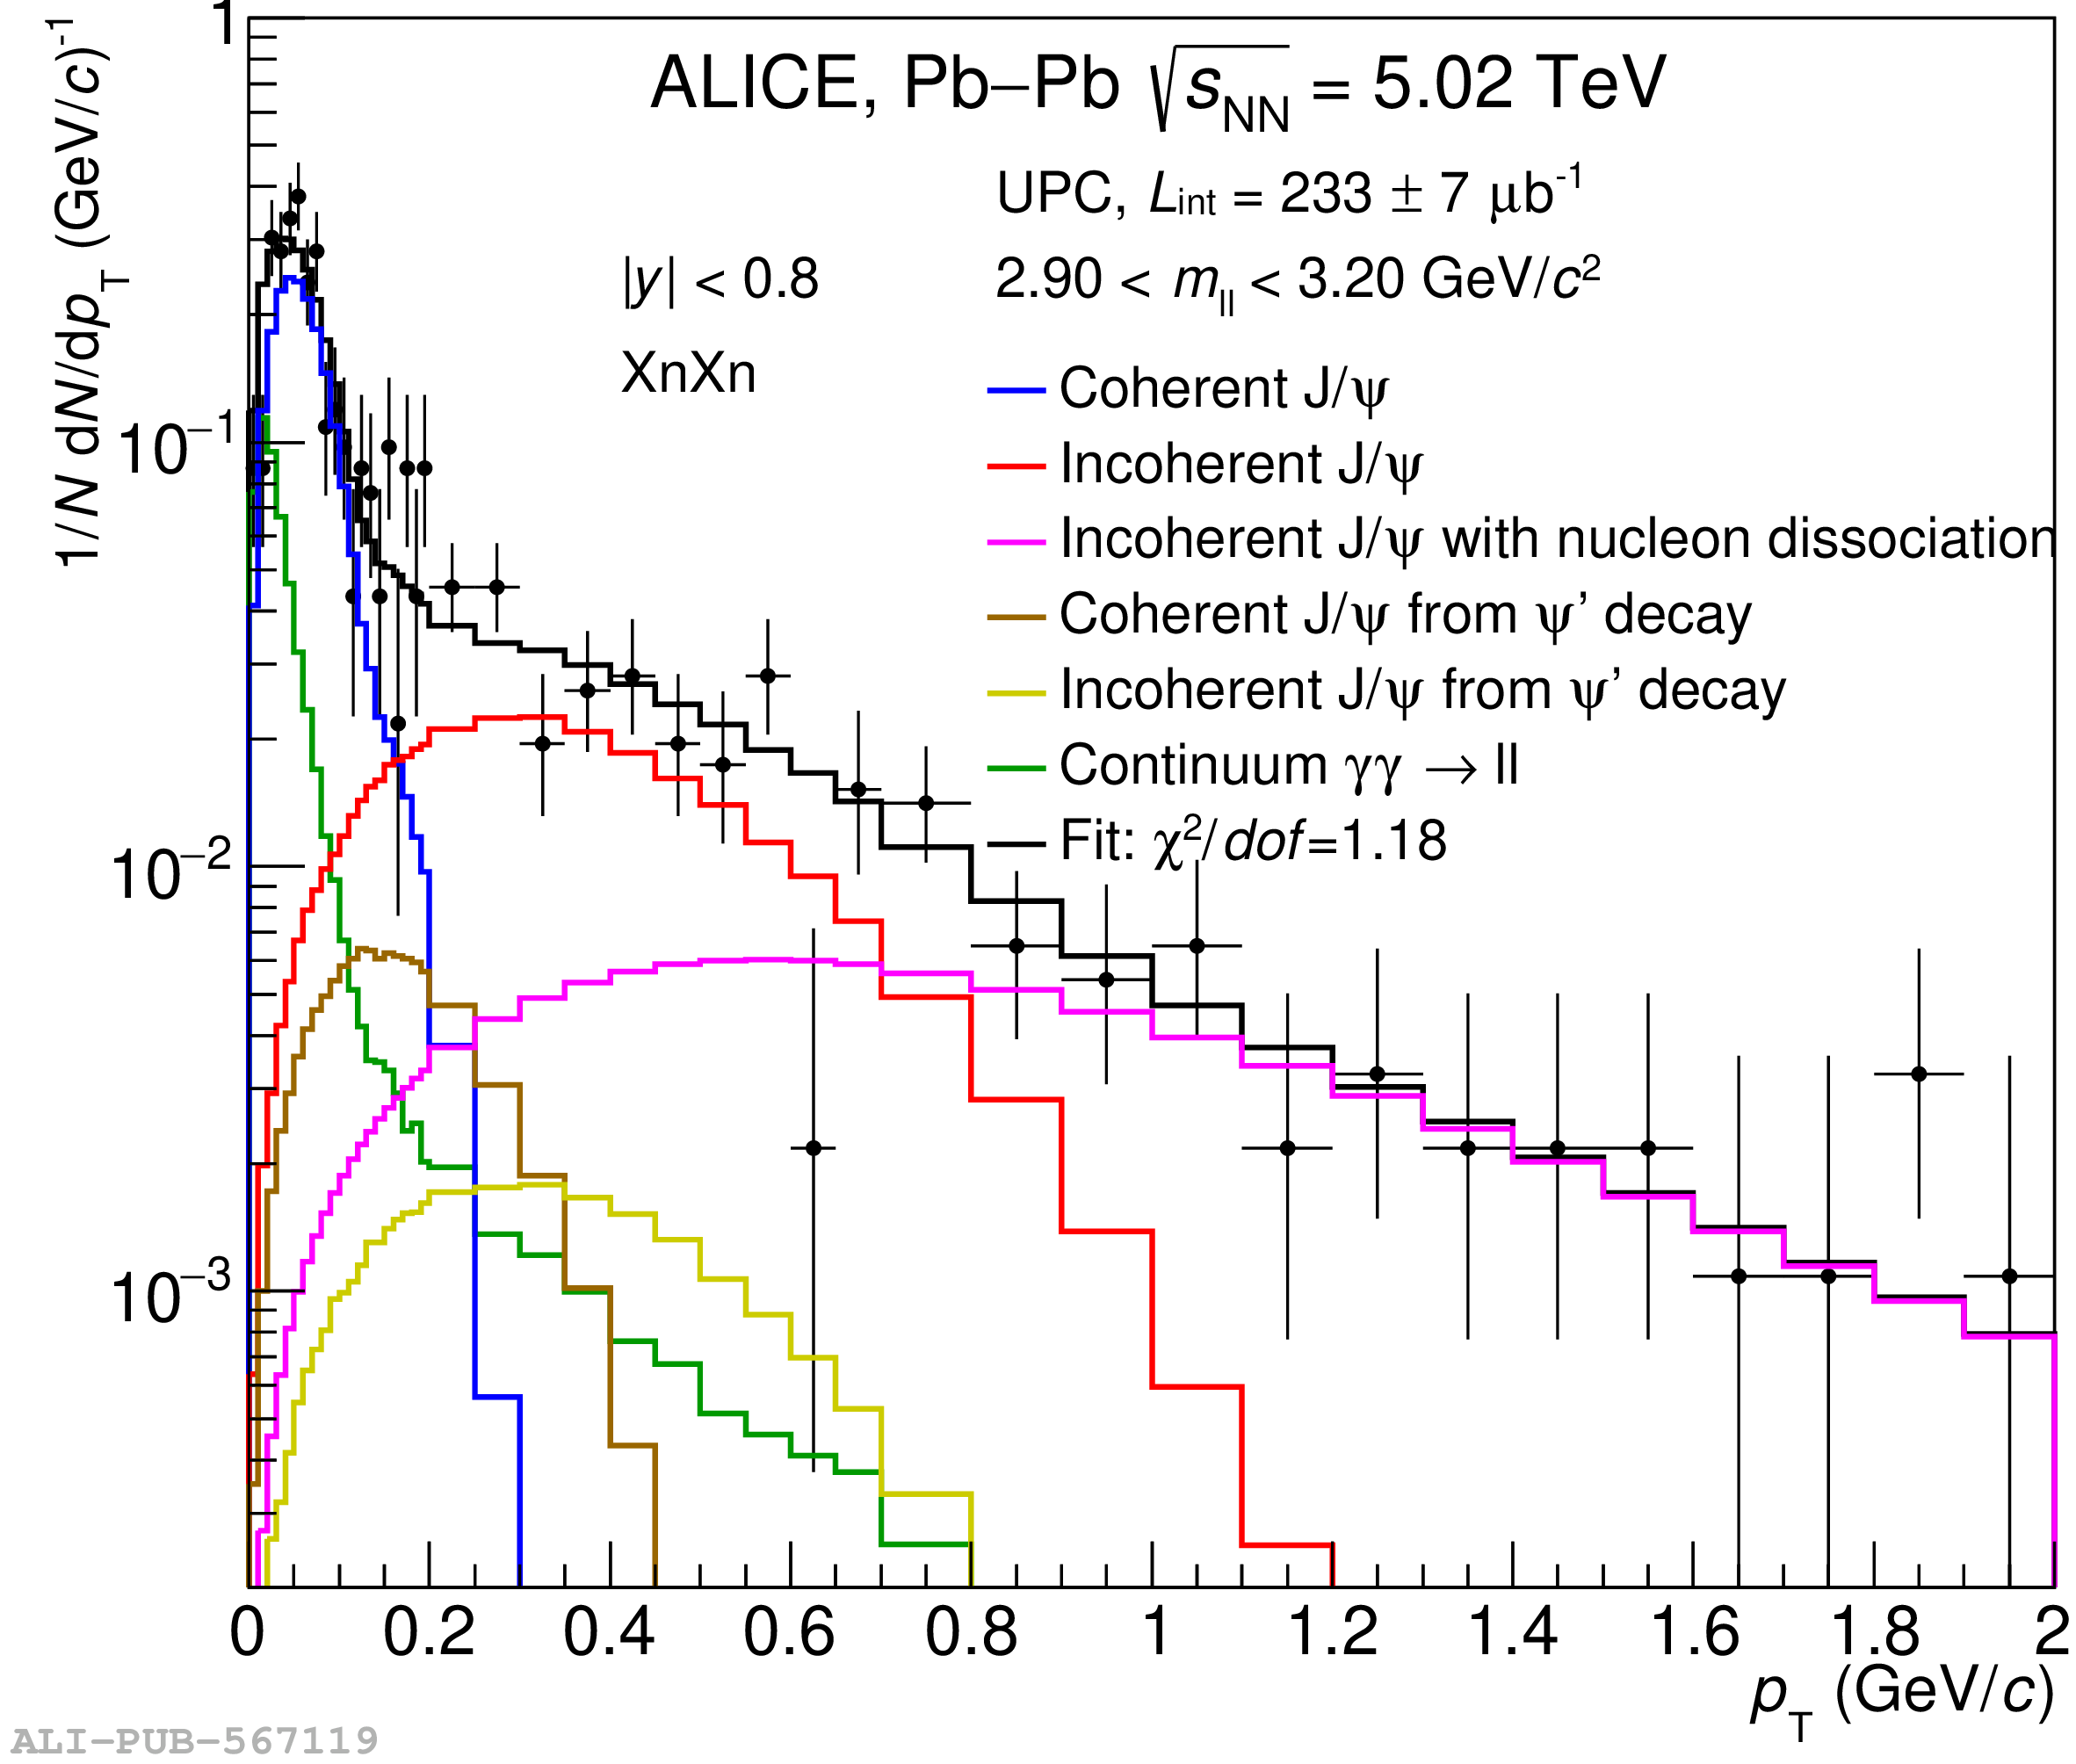 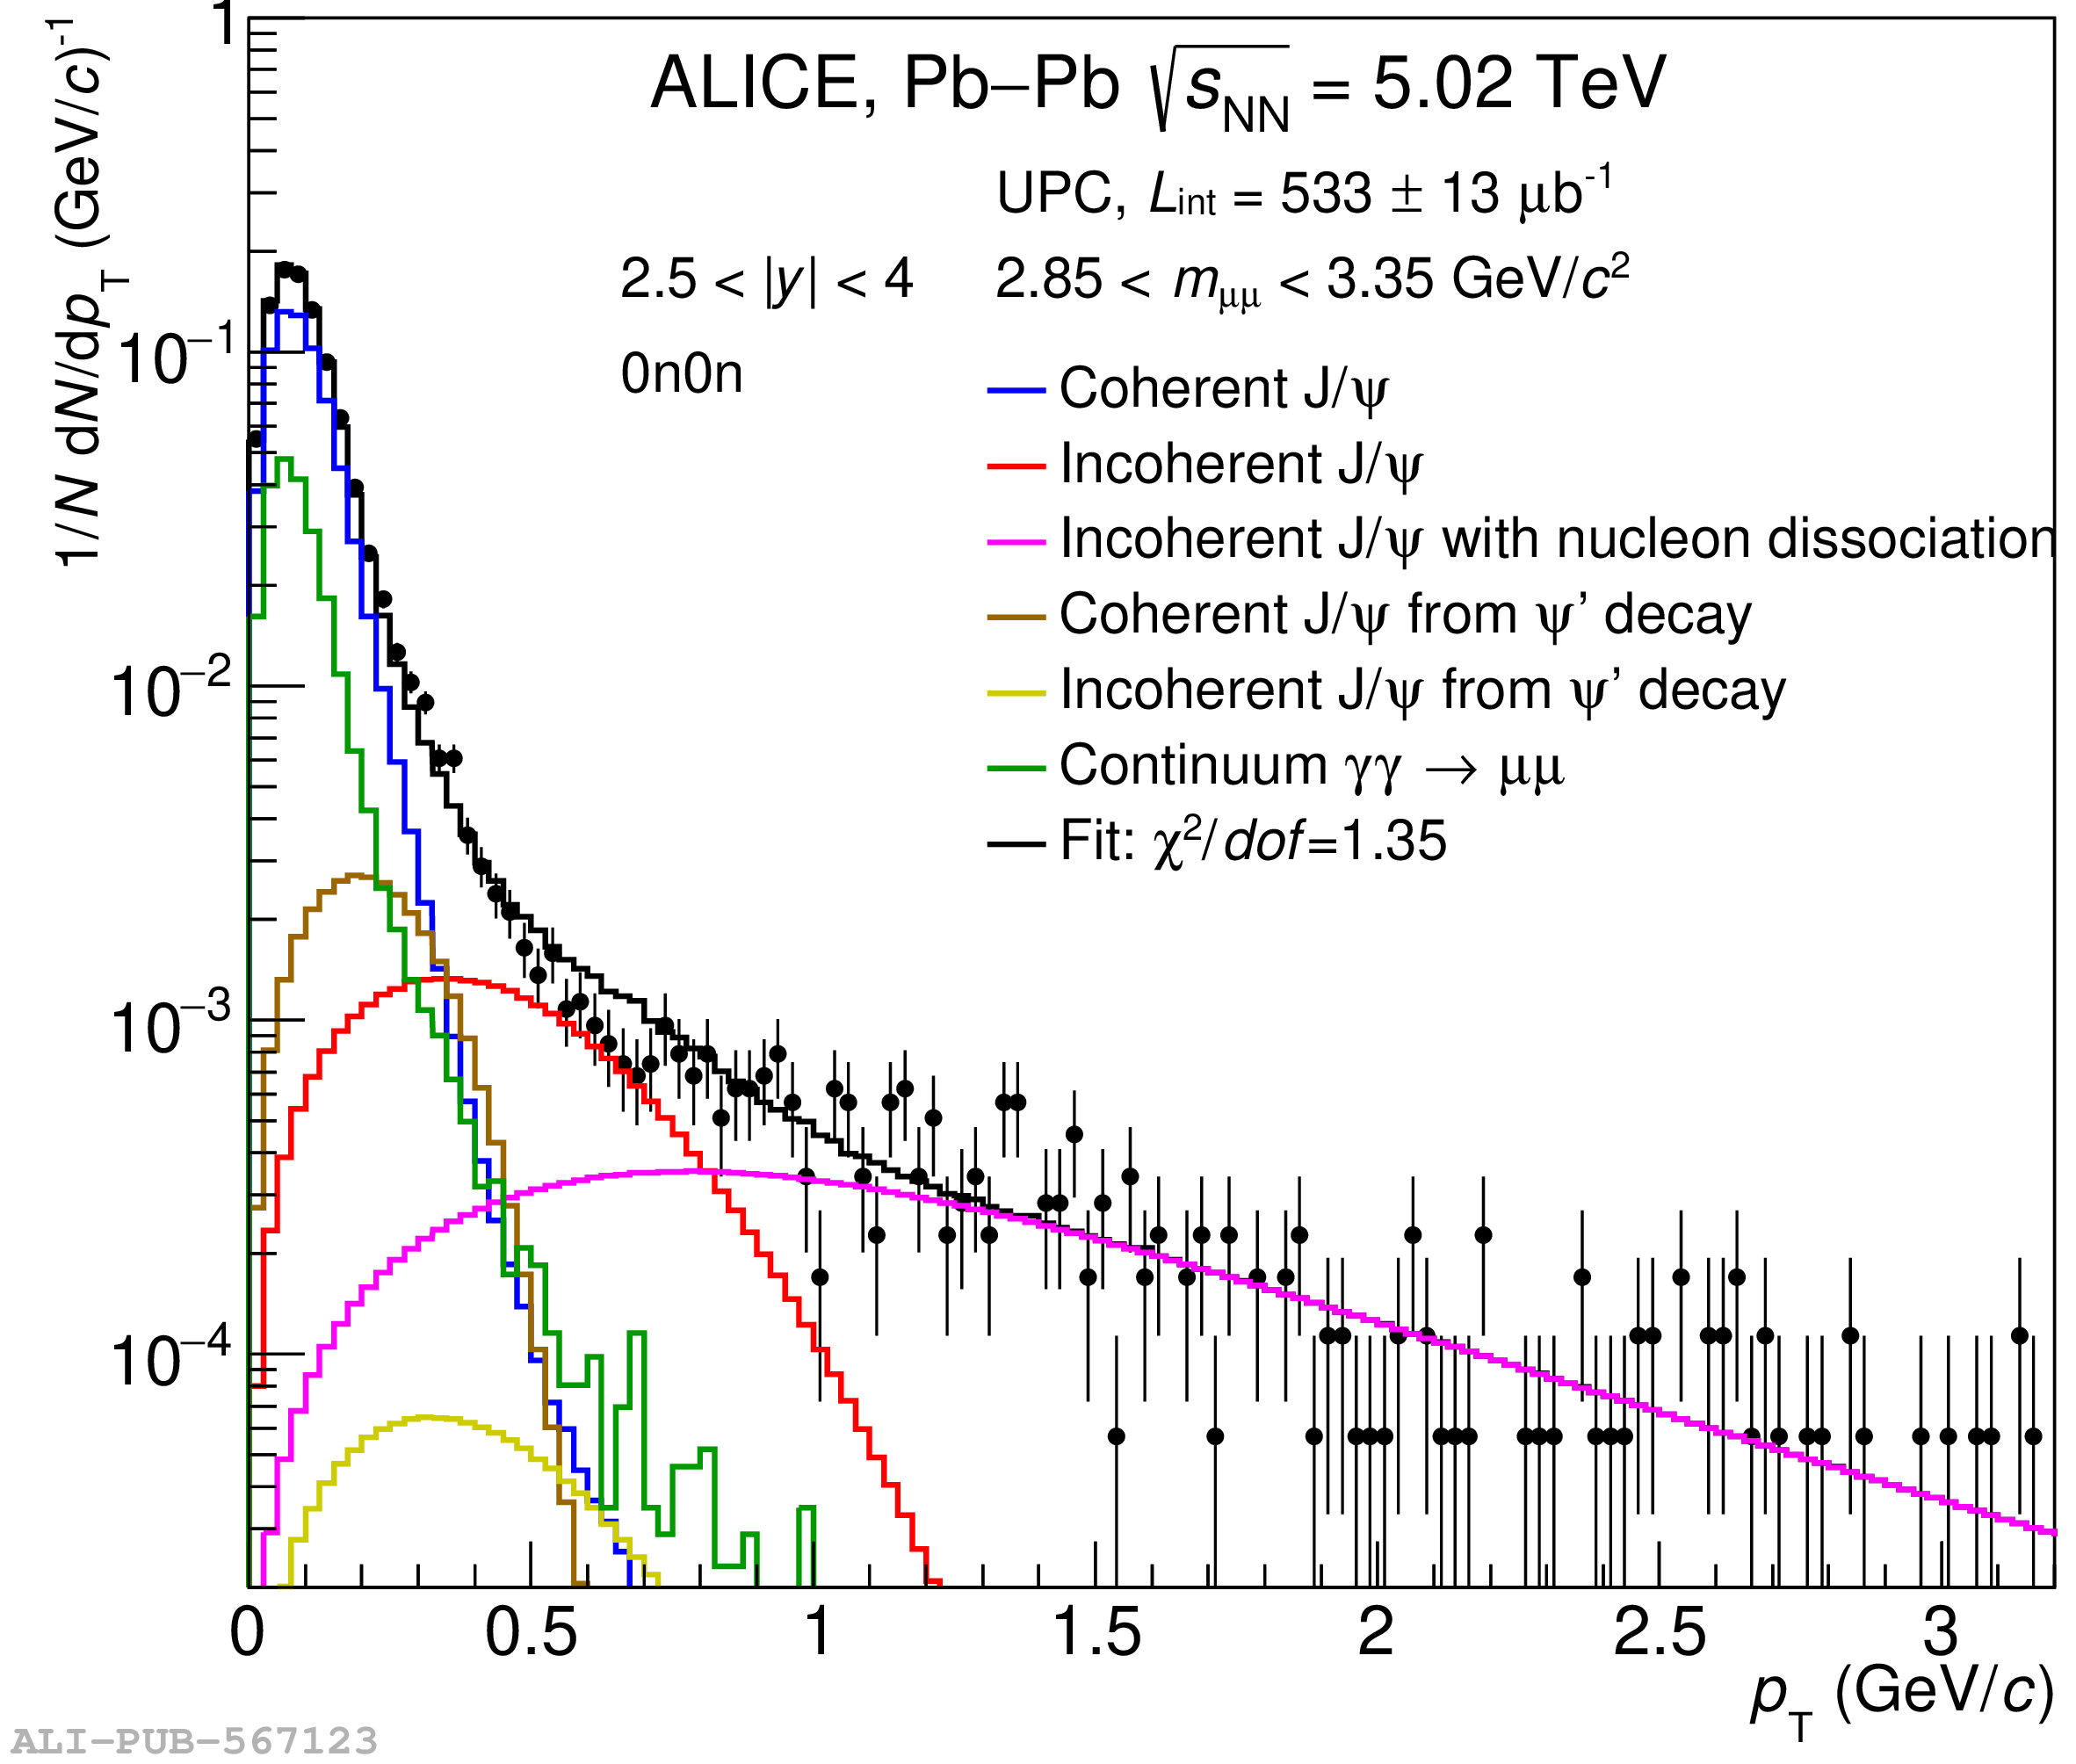  |