Comparison of transverse momentum spectra of \kstar (left panel) and \phim (right panel) for inelastic \pp collisions at \s $=$ 5.02 \TeV (solid markers) and 2.76 \TeV (open markers) . The lower panels show the ratio of the \pt spectra at \s $=$ 5.02 \TeV to those from \s $=$ 2.76 \TeV. The statistical uncertainties on the data are shown by bars and the systematic uncertainties by boxes. The ratios are compared with model calculations from the PYTHIA 6.4 (Perugia 2011 Tune) , PYTHIA 8.1 (Monash 2013 Tune) ,PYTHIA 8.2 (Rope hadronization) , EPOS-LHC , and HERWIG 7.1 , which are shown as different dashed lines. | 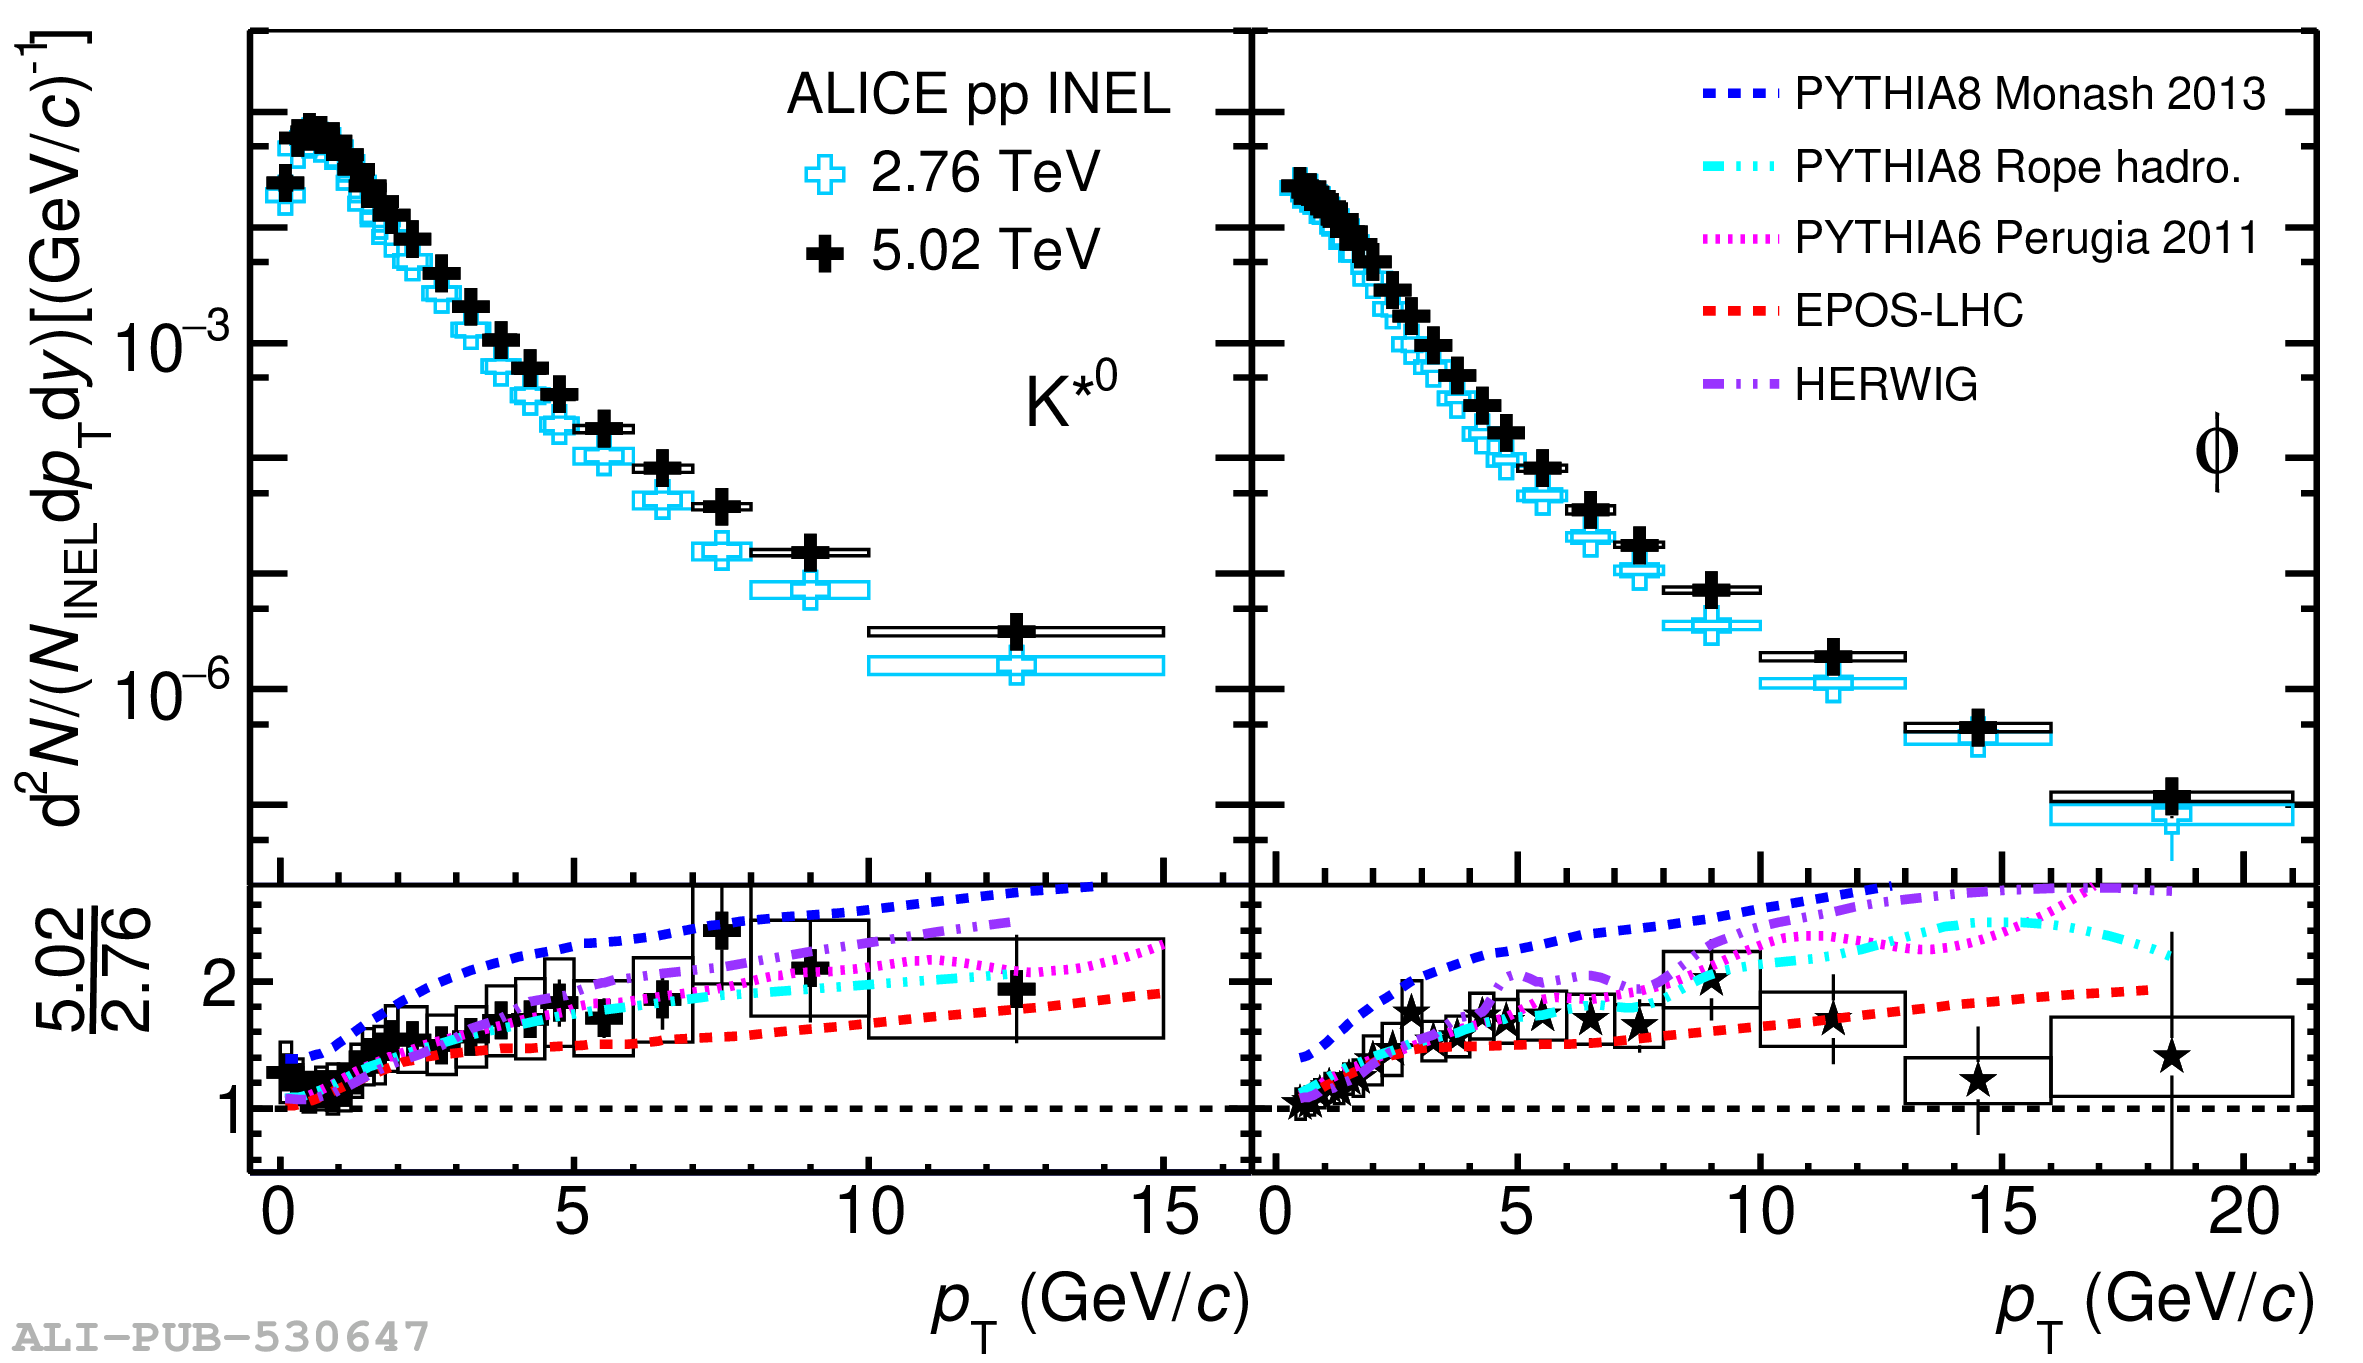 |