Upper panels: \pL correlation function (circles) with statistical (vertical bars) and systematic (grey boxes) uncertainties. Middle panels: zoom on the cusp-like signal at $\ks = 289$ \MeVc. Lower panels: The deviation between data and predictions, expressed in terms of $n_\sigma$. The fit is performed using NLO13 (red) \Chieft potentials with cut-off $\Lambda=$600 \MeV and using a cubic baseline (dark grey). The residual $\pXim\oplus\pXio$ (pink) and p$\Sigma^0$ (royal blue) correlations are modelled using, respectively, a lattice potential from the HAL QCD collaboration and a $\chi$EFT potential . Both contributions are plotted relative to the baseline, while in panel b) the strong interaction of p$\Sigma^0$ is neglected. The reduced $\chi^2$, for $\ks<300 $\MeVc, amounts to 2.2 in case a) and to 1.9 in case b). | 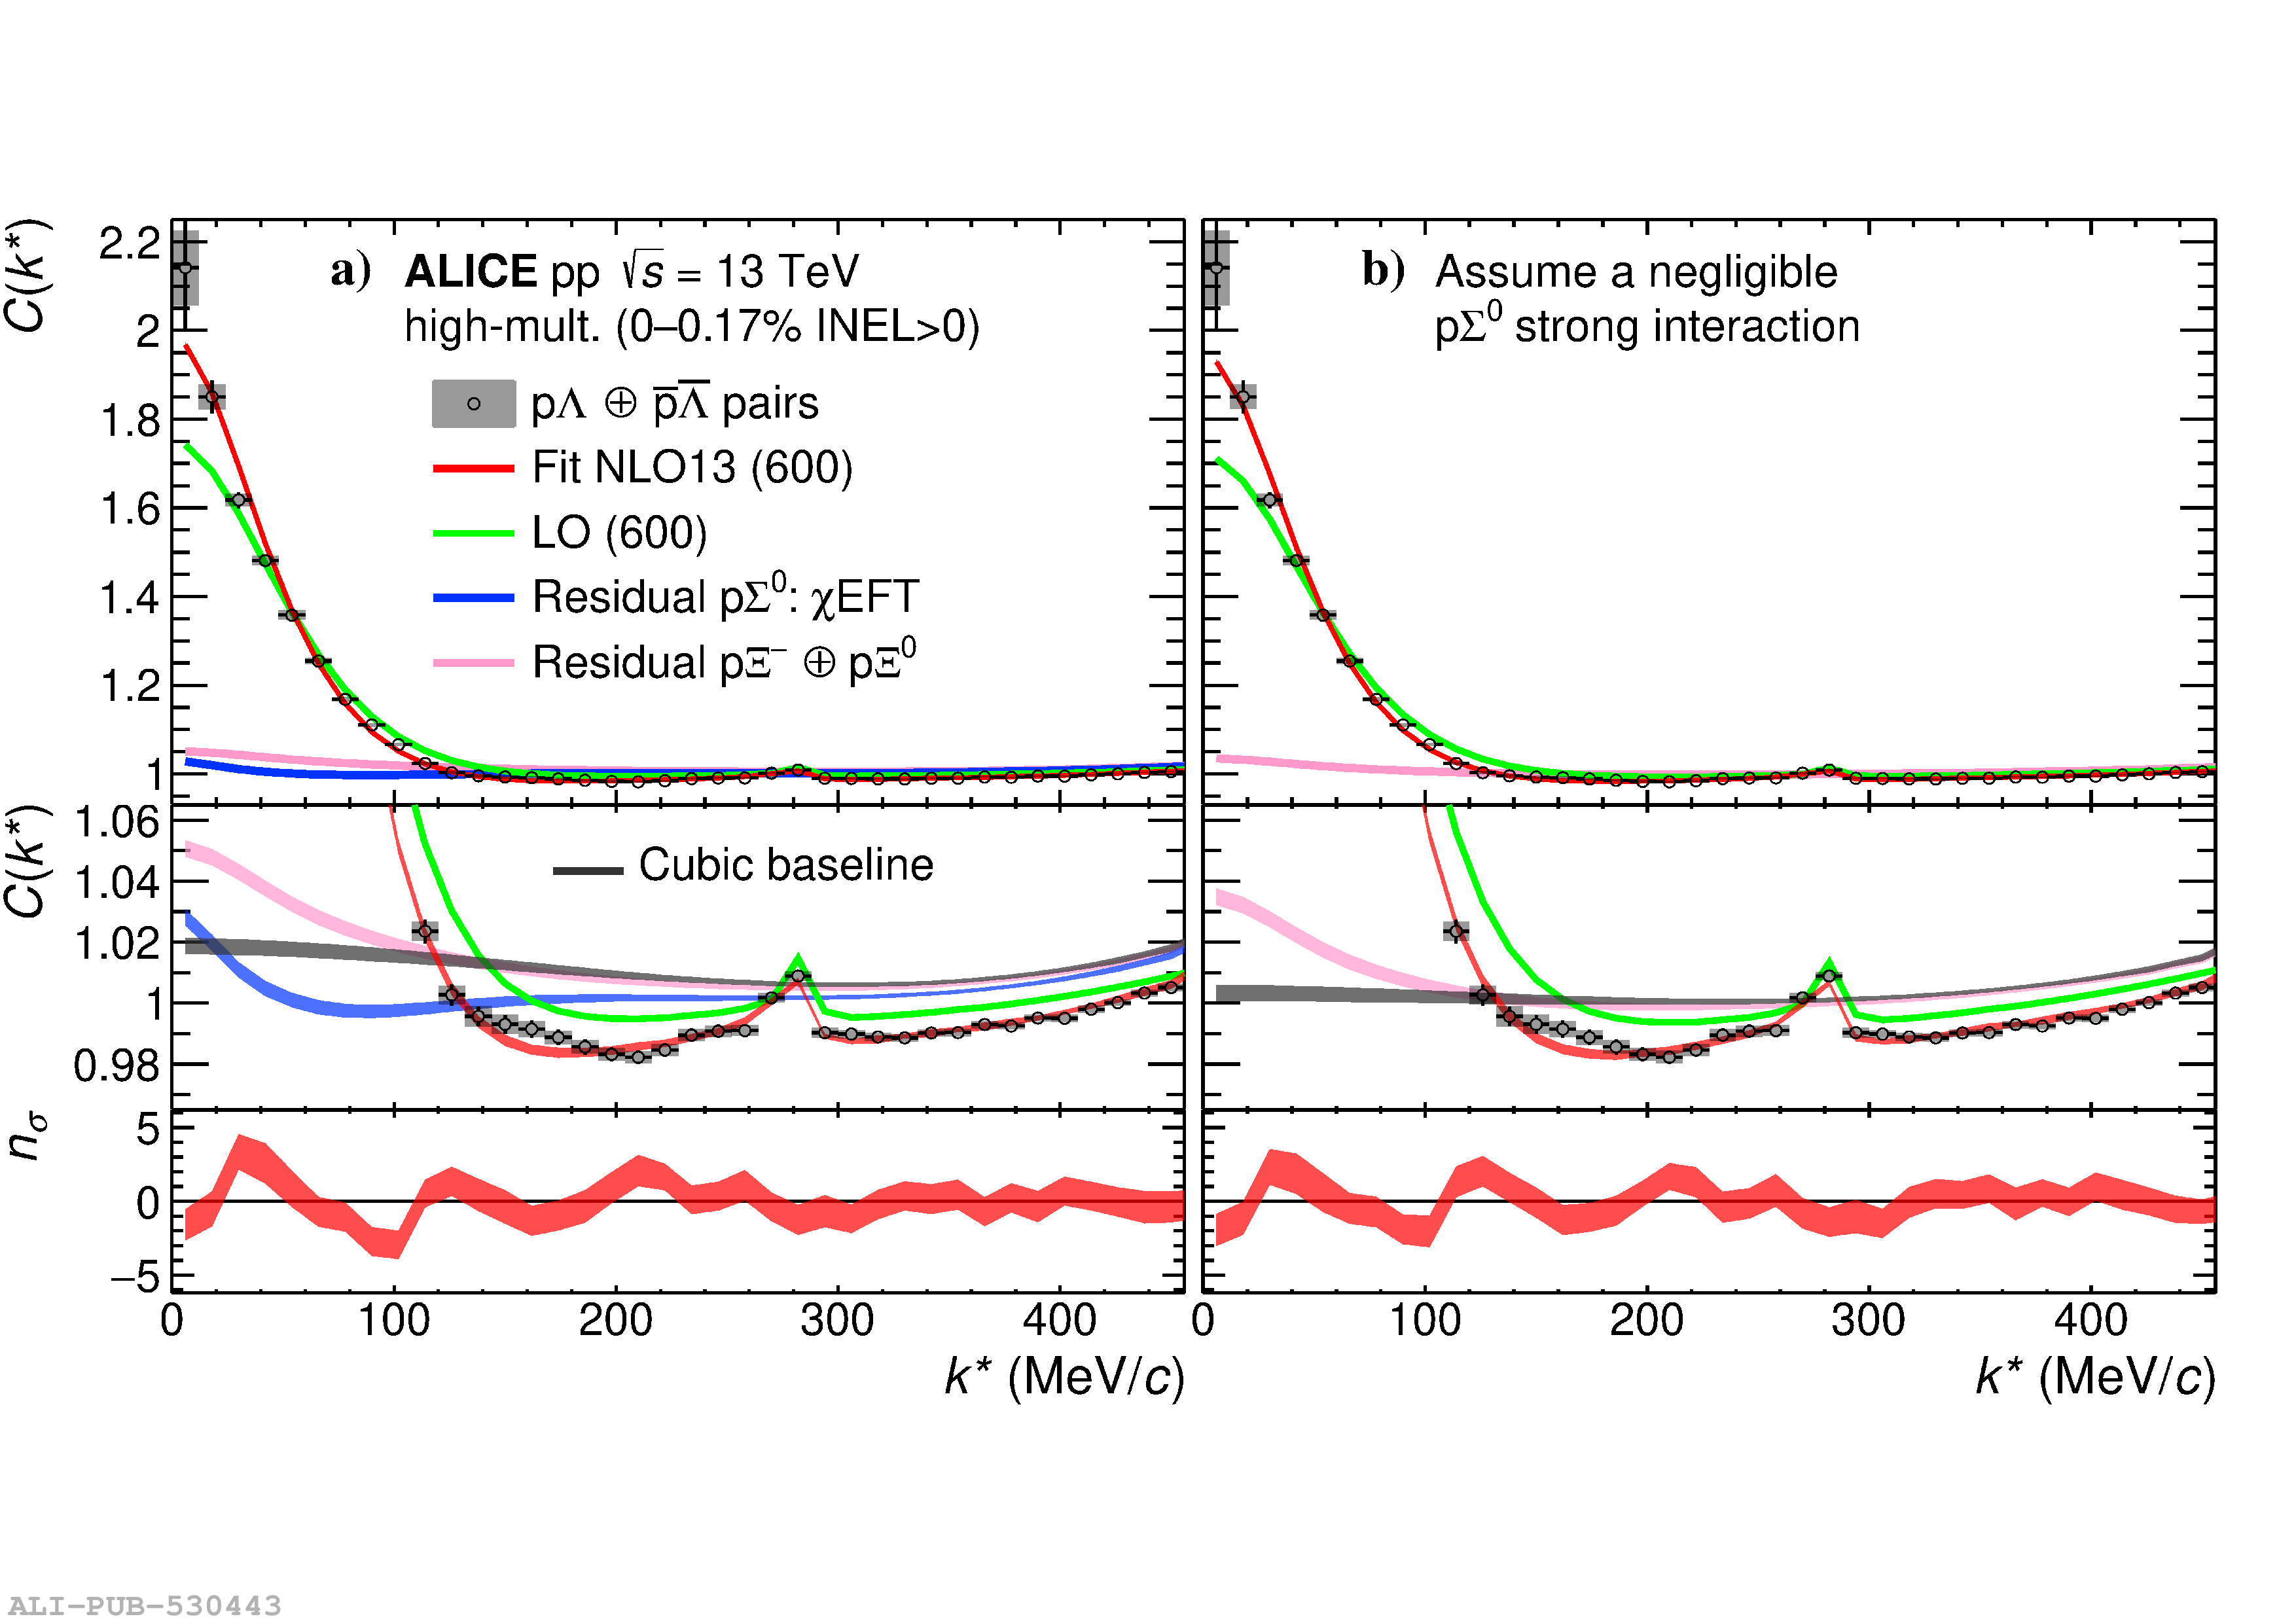 |