Multiplicity ($N_{\rm ch}$) distributions and transverse momentum ($p_{\rm T}$) spectra of inclusive primary charged particles in the kinematic range of $|\eta| <~ 0.8$ and 0.15 GeV/$c$ $<~ p_{T} <~$ 10 GeV/$c$ are reported for pp, p-Pb, Xe-Xe and Pb-Pb collisions at centre-of-mass energies per nucleon pair ranging from $\sqrt{s_{\rm NN}} = 2.76$ TeV up to $13$ TeV. A sequential two-dimensional unfolding procedure is used to extract the correlation between the transverse momentum of primary charged particles and the charged-particle multiplicity of the corresponding collision. This correlation sharply characterises important features of the final state of a collision and, therefore, can be used as a stringent test of theoretical models. The multiplicity distributions as well as the mean and standard deviation derived from the $p_{\rm T}$ spectra are compared to state-of-the-art model predictions. Providing these fundamental observables of bulk particle production consistently across a wide range of collision energies and system sizes can serve as an important input for tuning Monte Carlo event generators.
Phys. Lett. B 845 (2023) 138110
HEP Data
e-Print: arXiv:2211.15326 | PDF | inSPIRE
CERN-EP-2022-266
Figure group

Figure 2
The $N_{\rm ch}$ dependence of the mean (left panel) and standard deviation (right panel) of the $\pt$ distributions for (particle-composition corrected) Monte Carlo events in pp, p$-$Pb and Pb$-$Pb collisions at $\sqrt{s_{\rm NN}}$ = 5.02 TeV. Results propagated through a full GEANT model of ALICE and corrected with the sequential 2D unfolding (closed circles) procedure described in the text are compared with the generator-level (open squares) distributions and their ratios are shown in the bottom panels. | 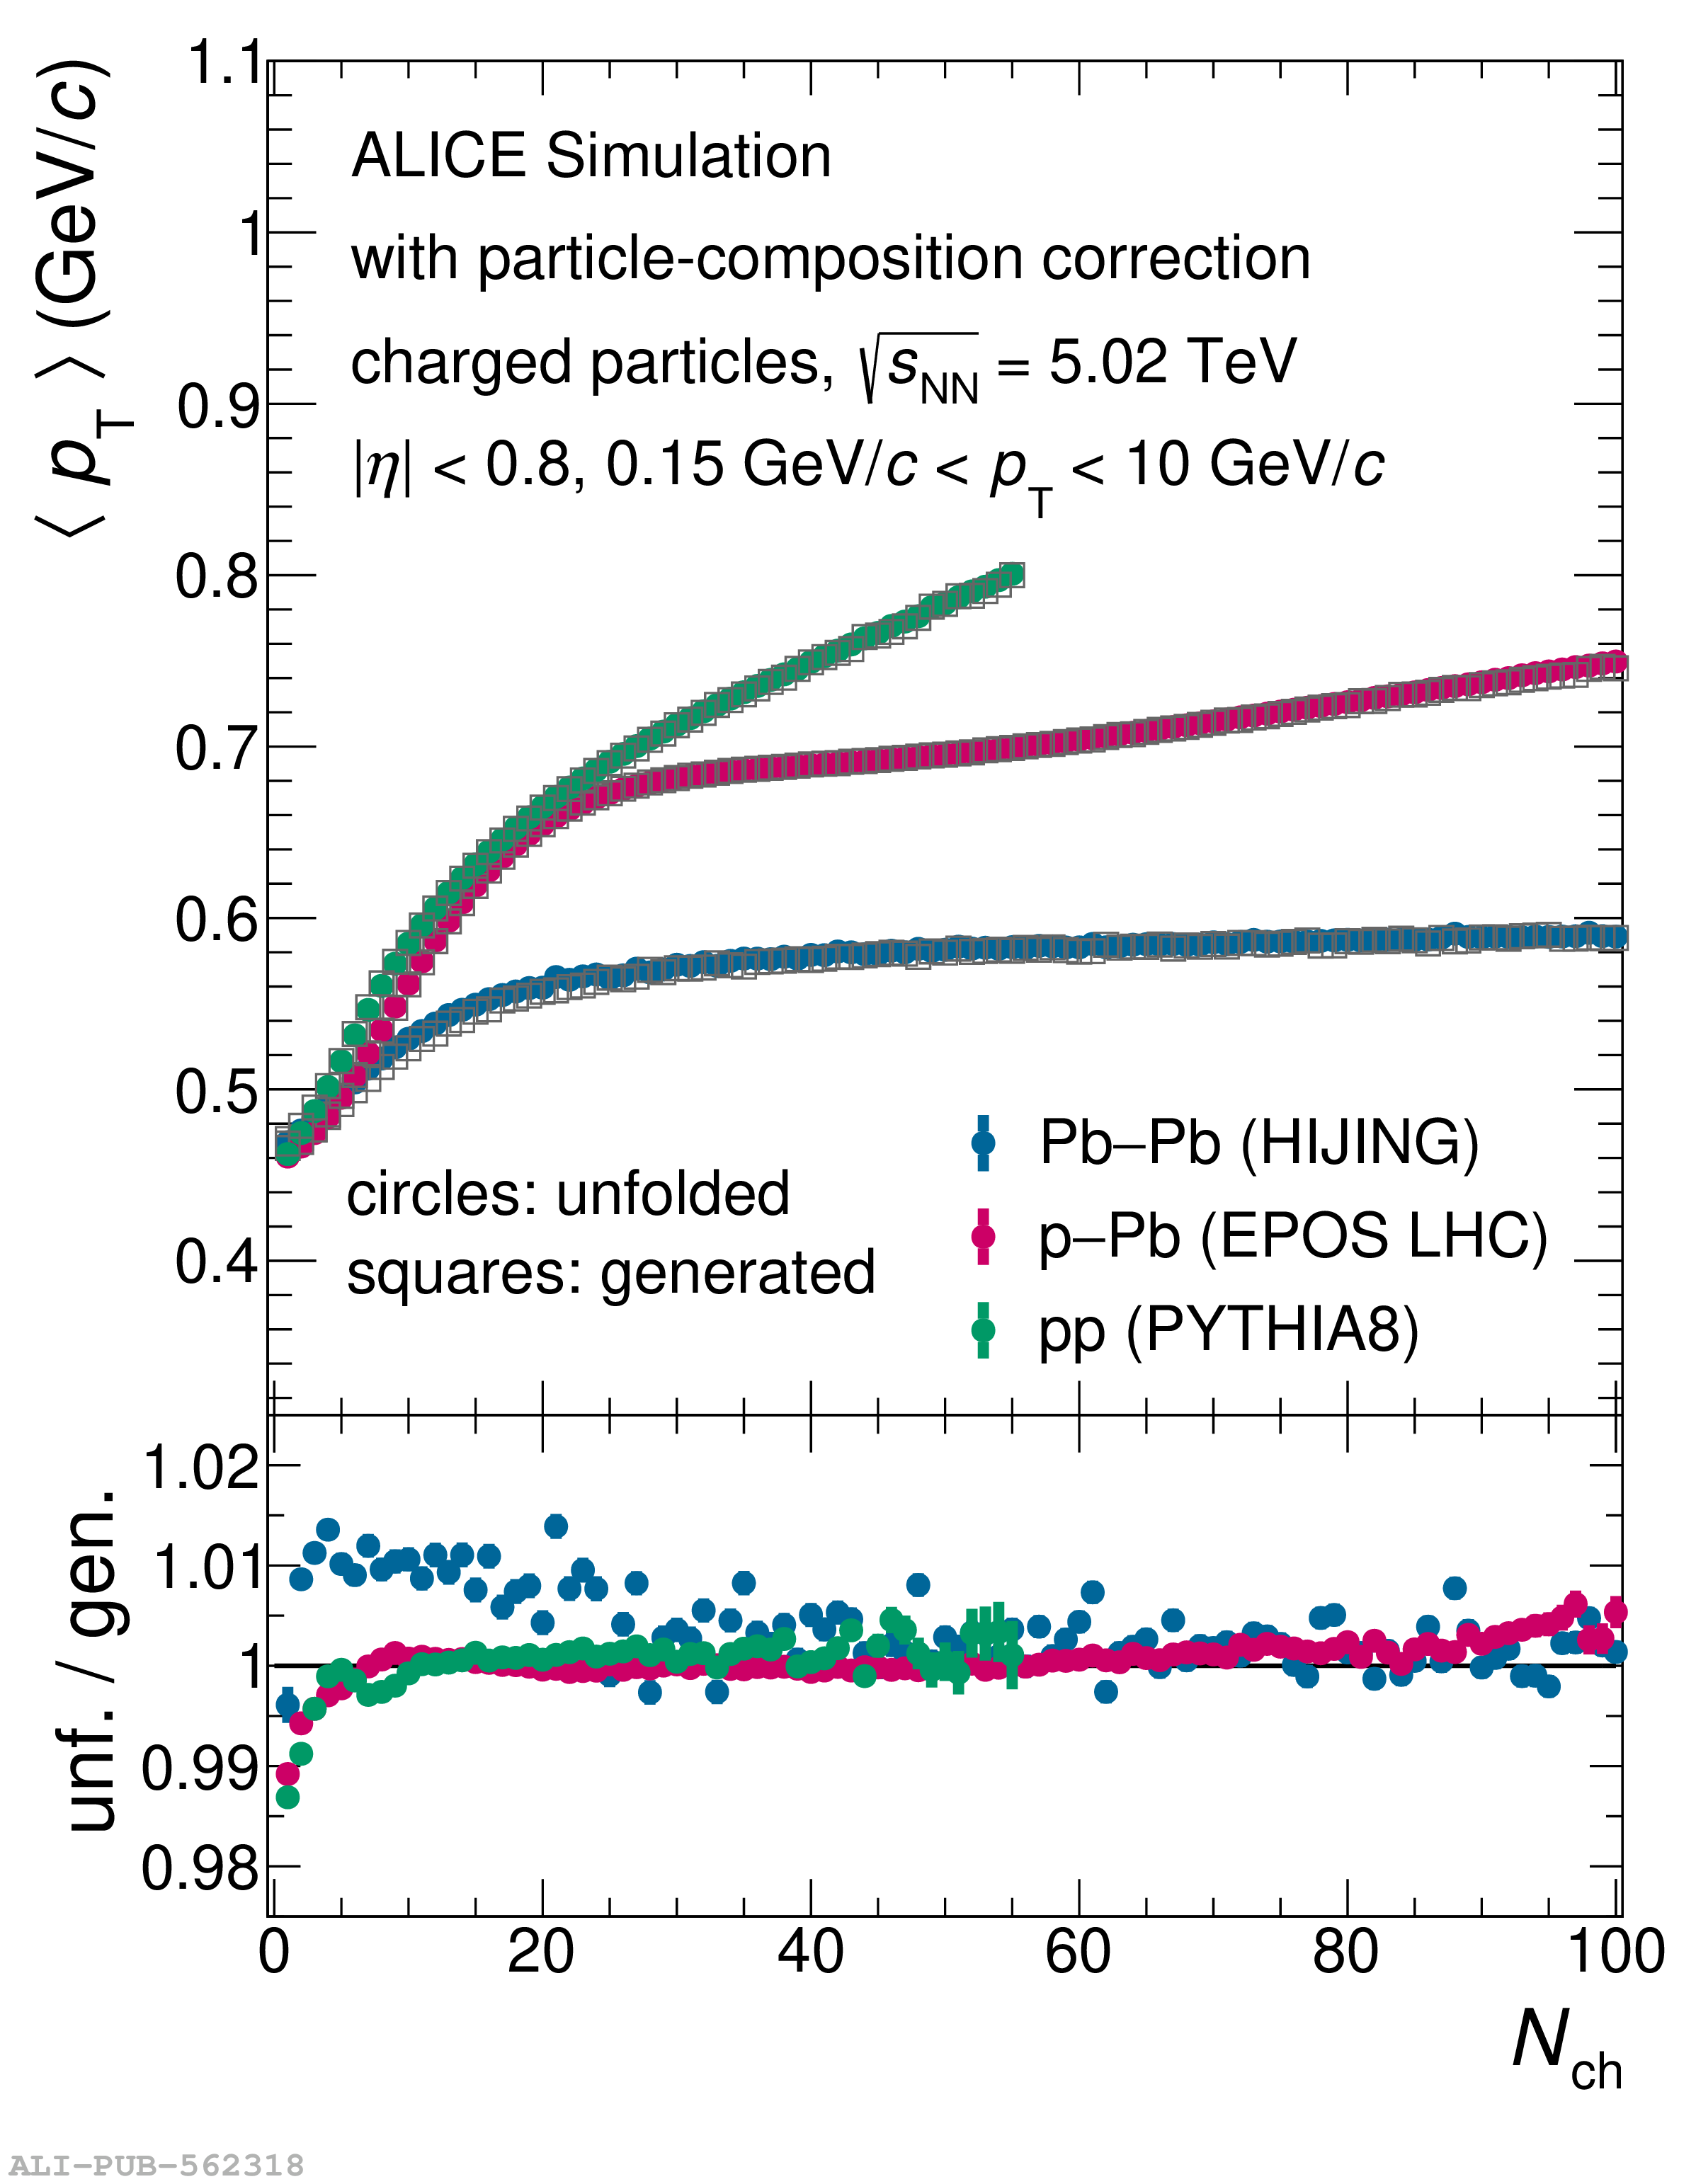 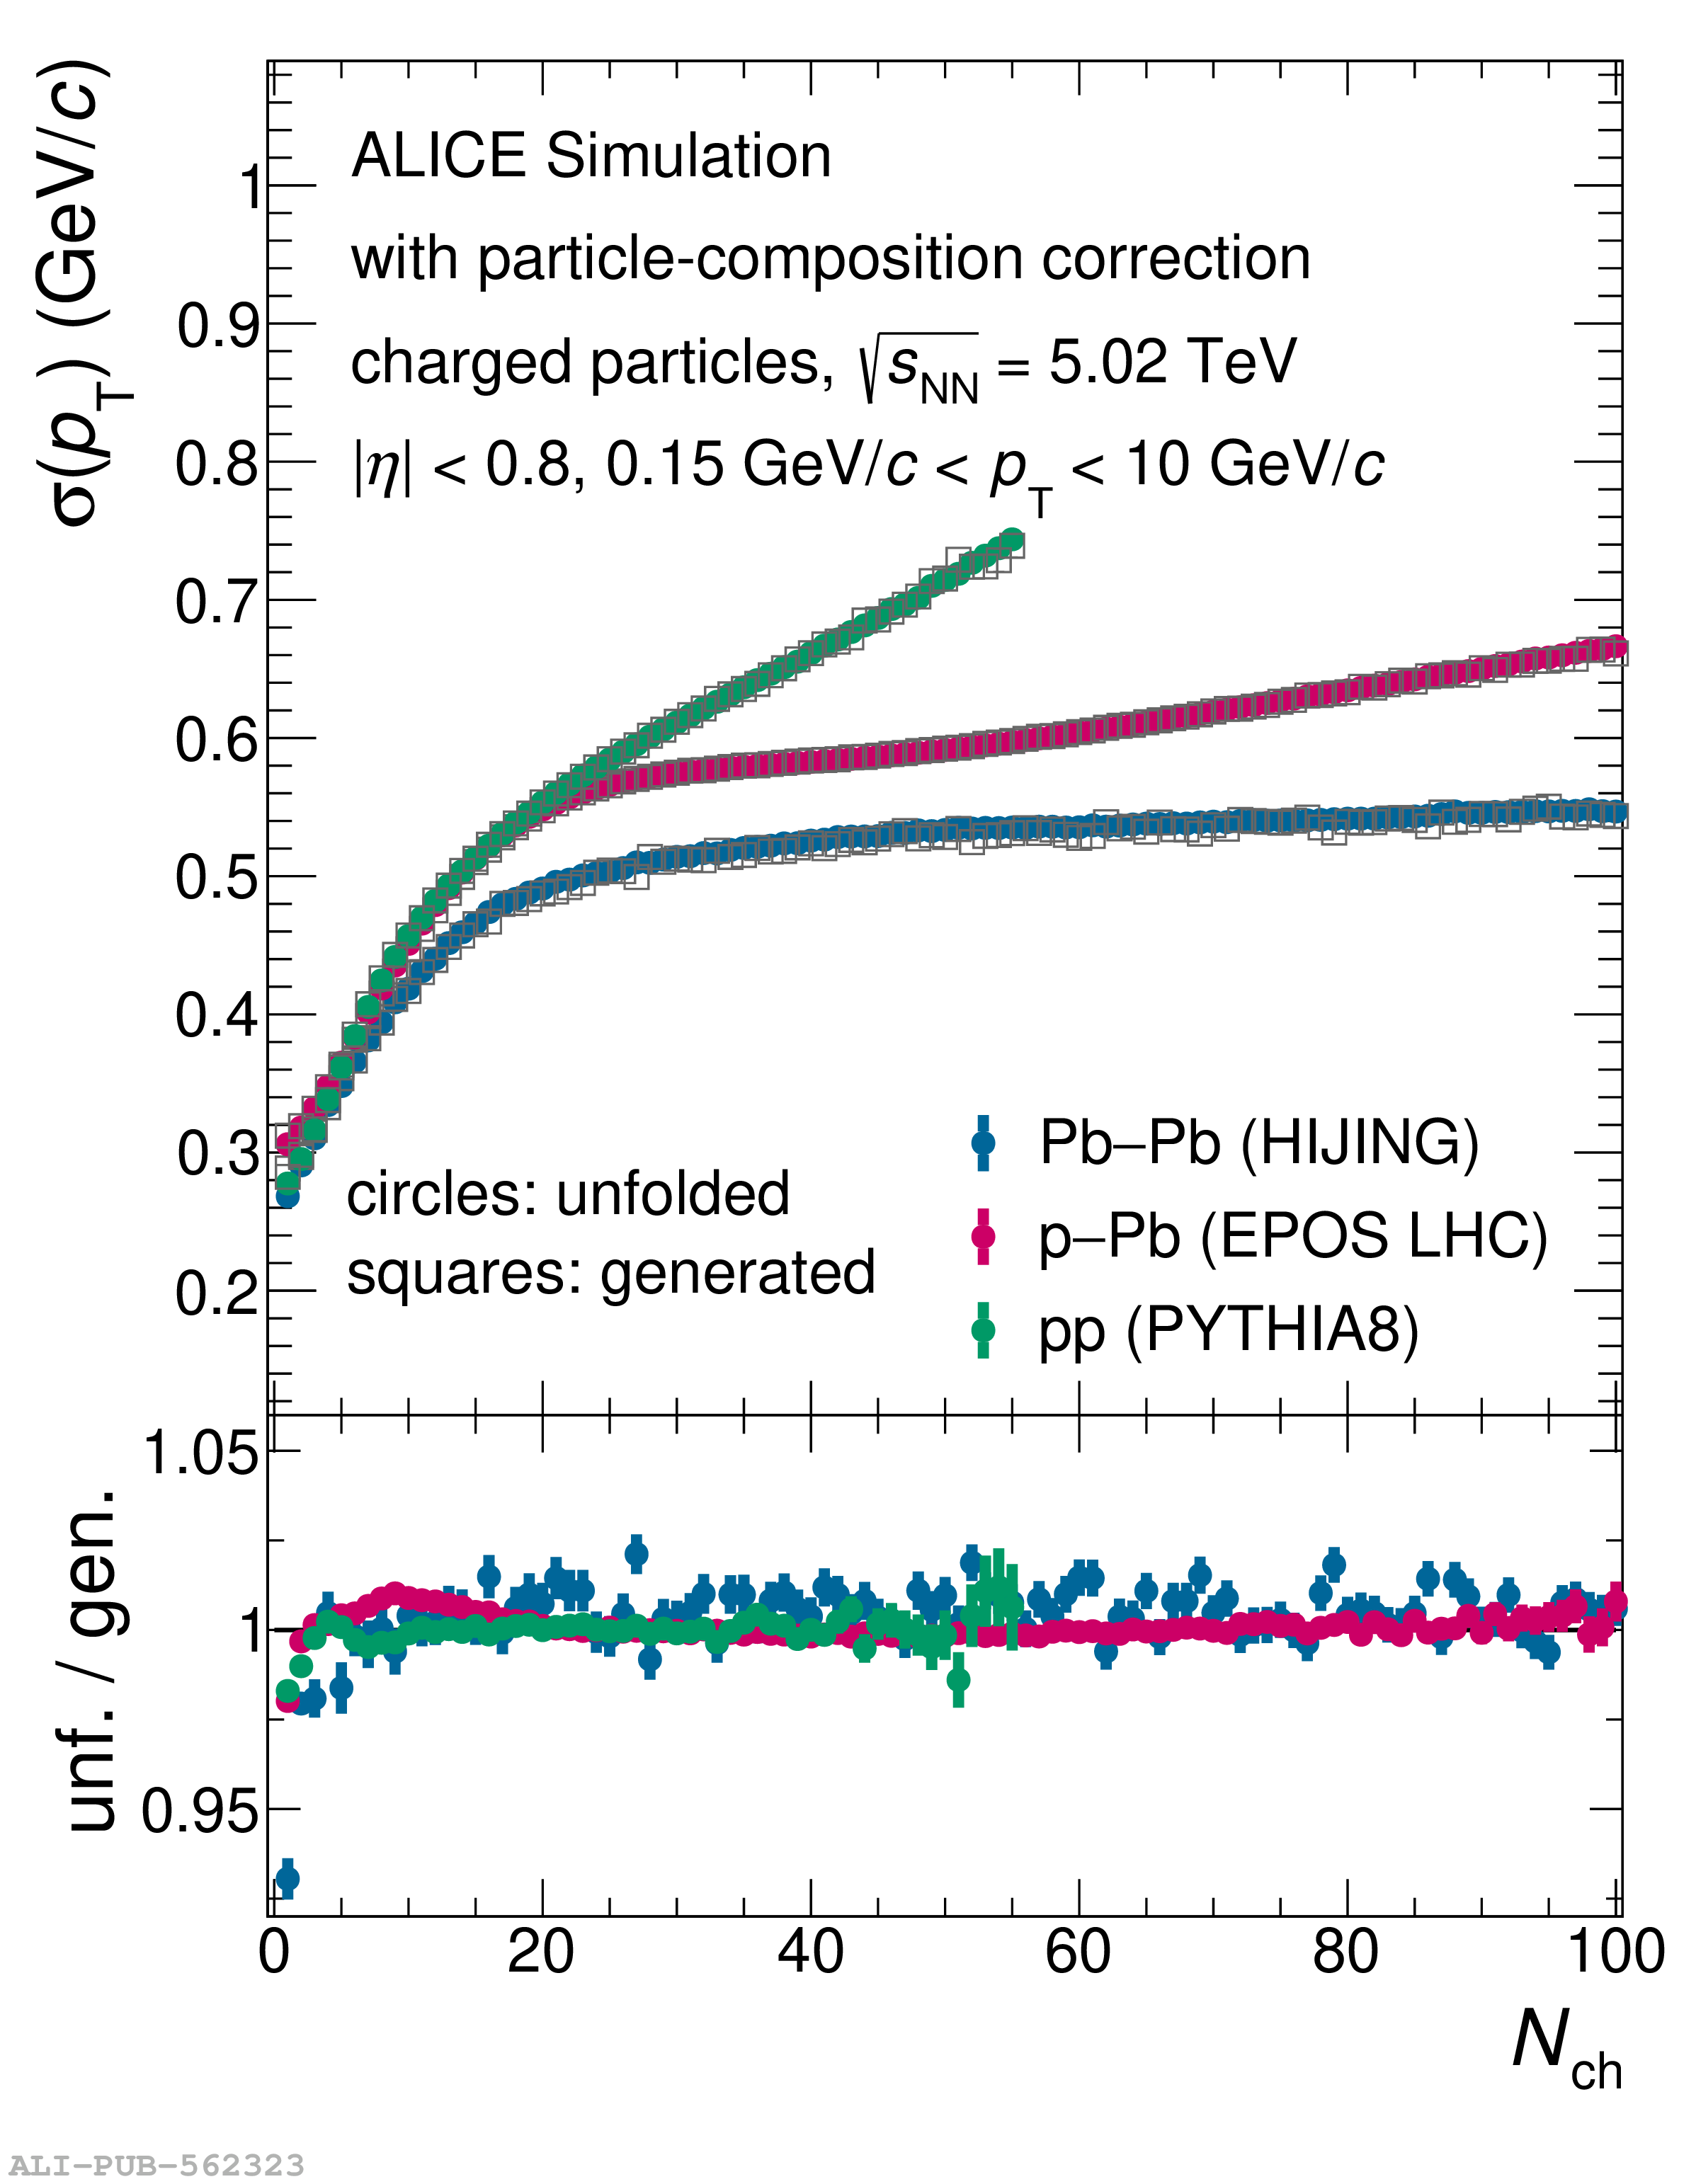 |
Figure 3
Top panel: the correlation of primary charged particle $\pt$ spectra with multiplicity per $\nch > 0$ event for pp collisions at $\sqrt{s} = 5.02$ TeV. Bottom panels: the corresponding relative change of $\pt$ (left) and $\nch$ (right) distributions with respect to the inclusive ones. In the left panel, each of the curves represents a single $\nch$ value, ranging from $\nch = 1$ (blue) to $\nch = 55$ (red). In the right panel, the colours represent the $\pt$ intervals used in this analysis from the lowest in blue to the highest one in red. | 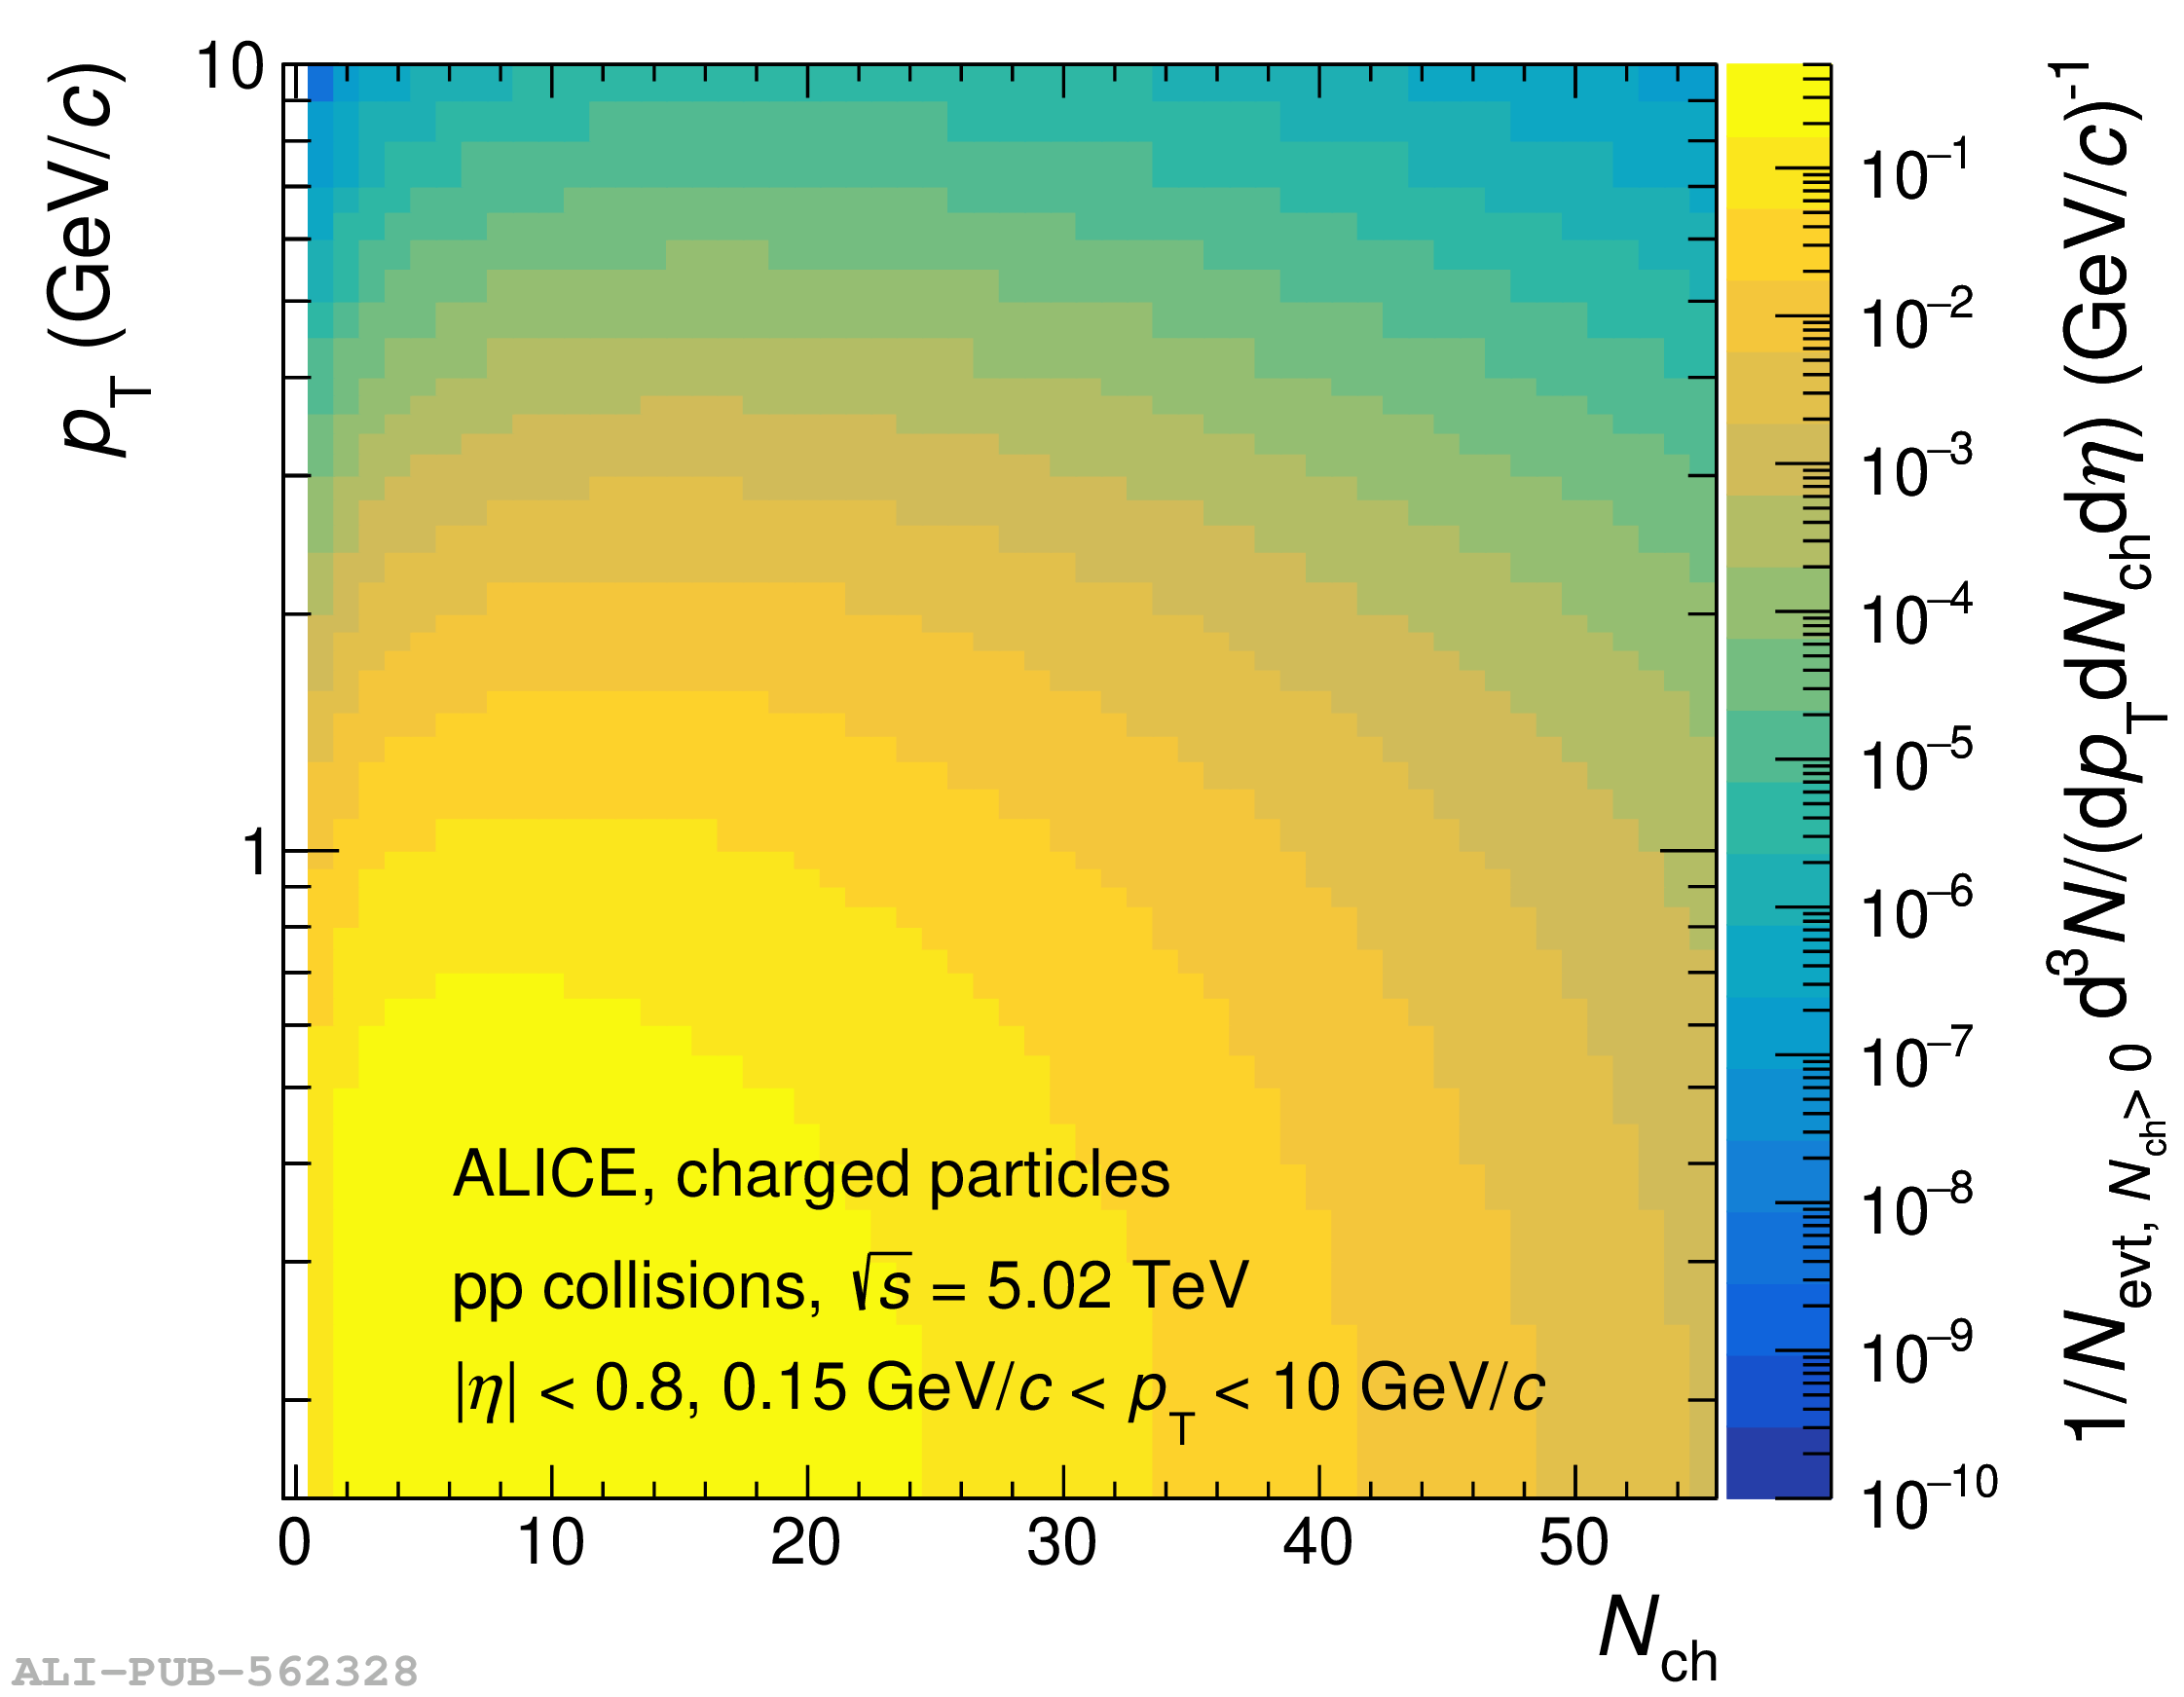 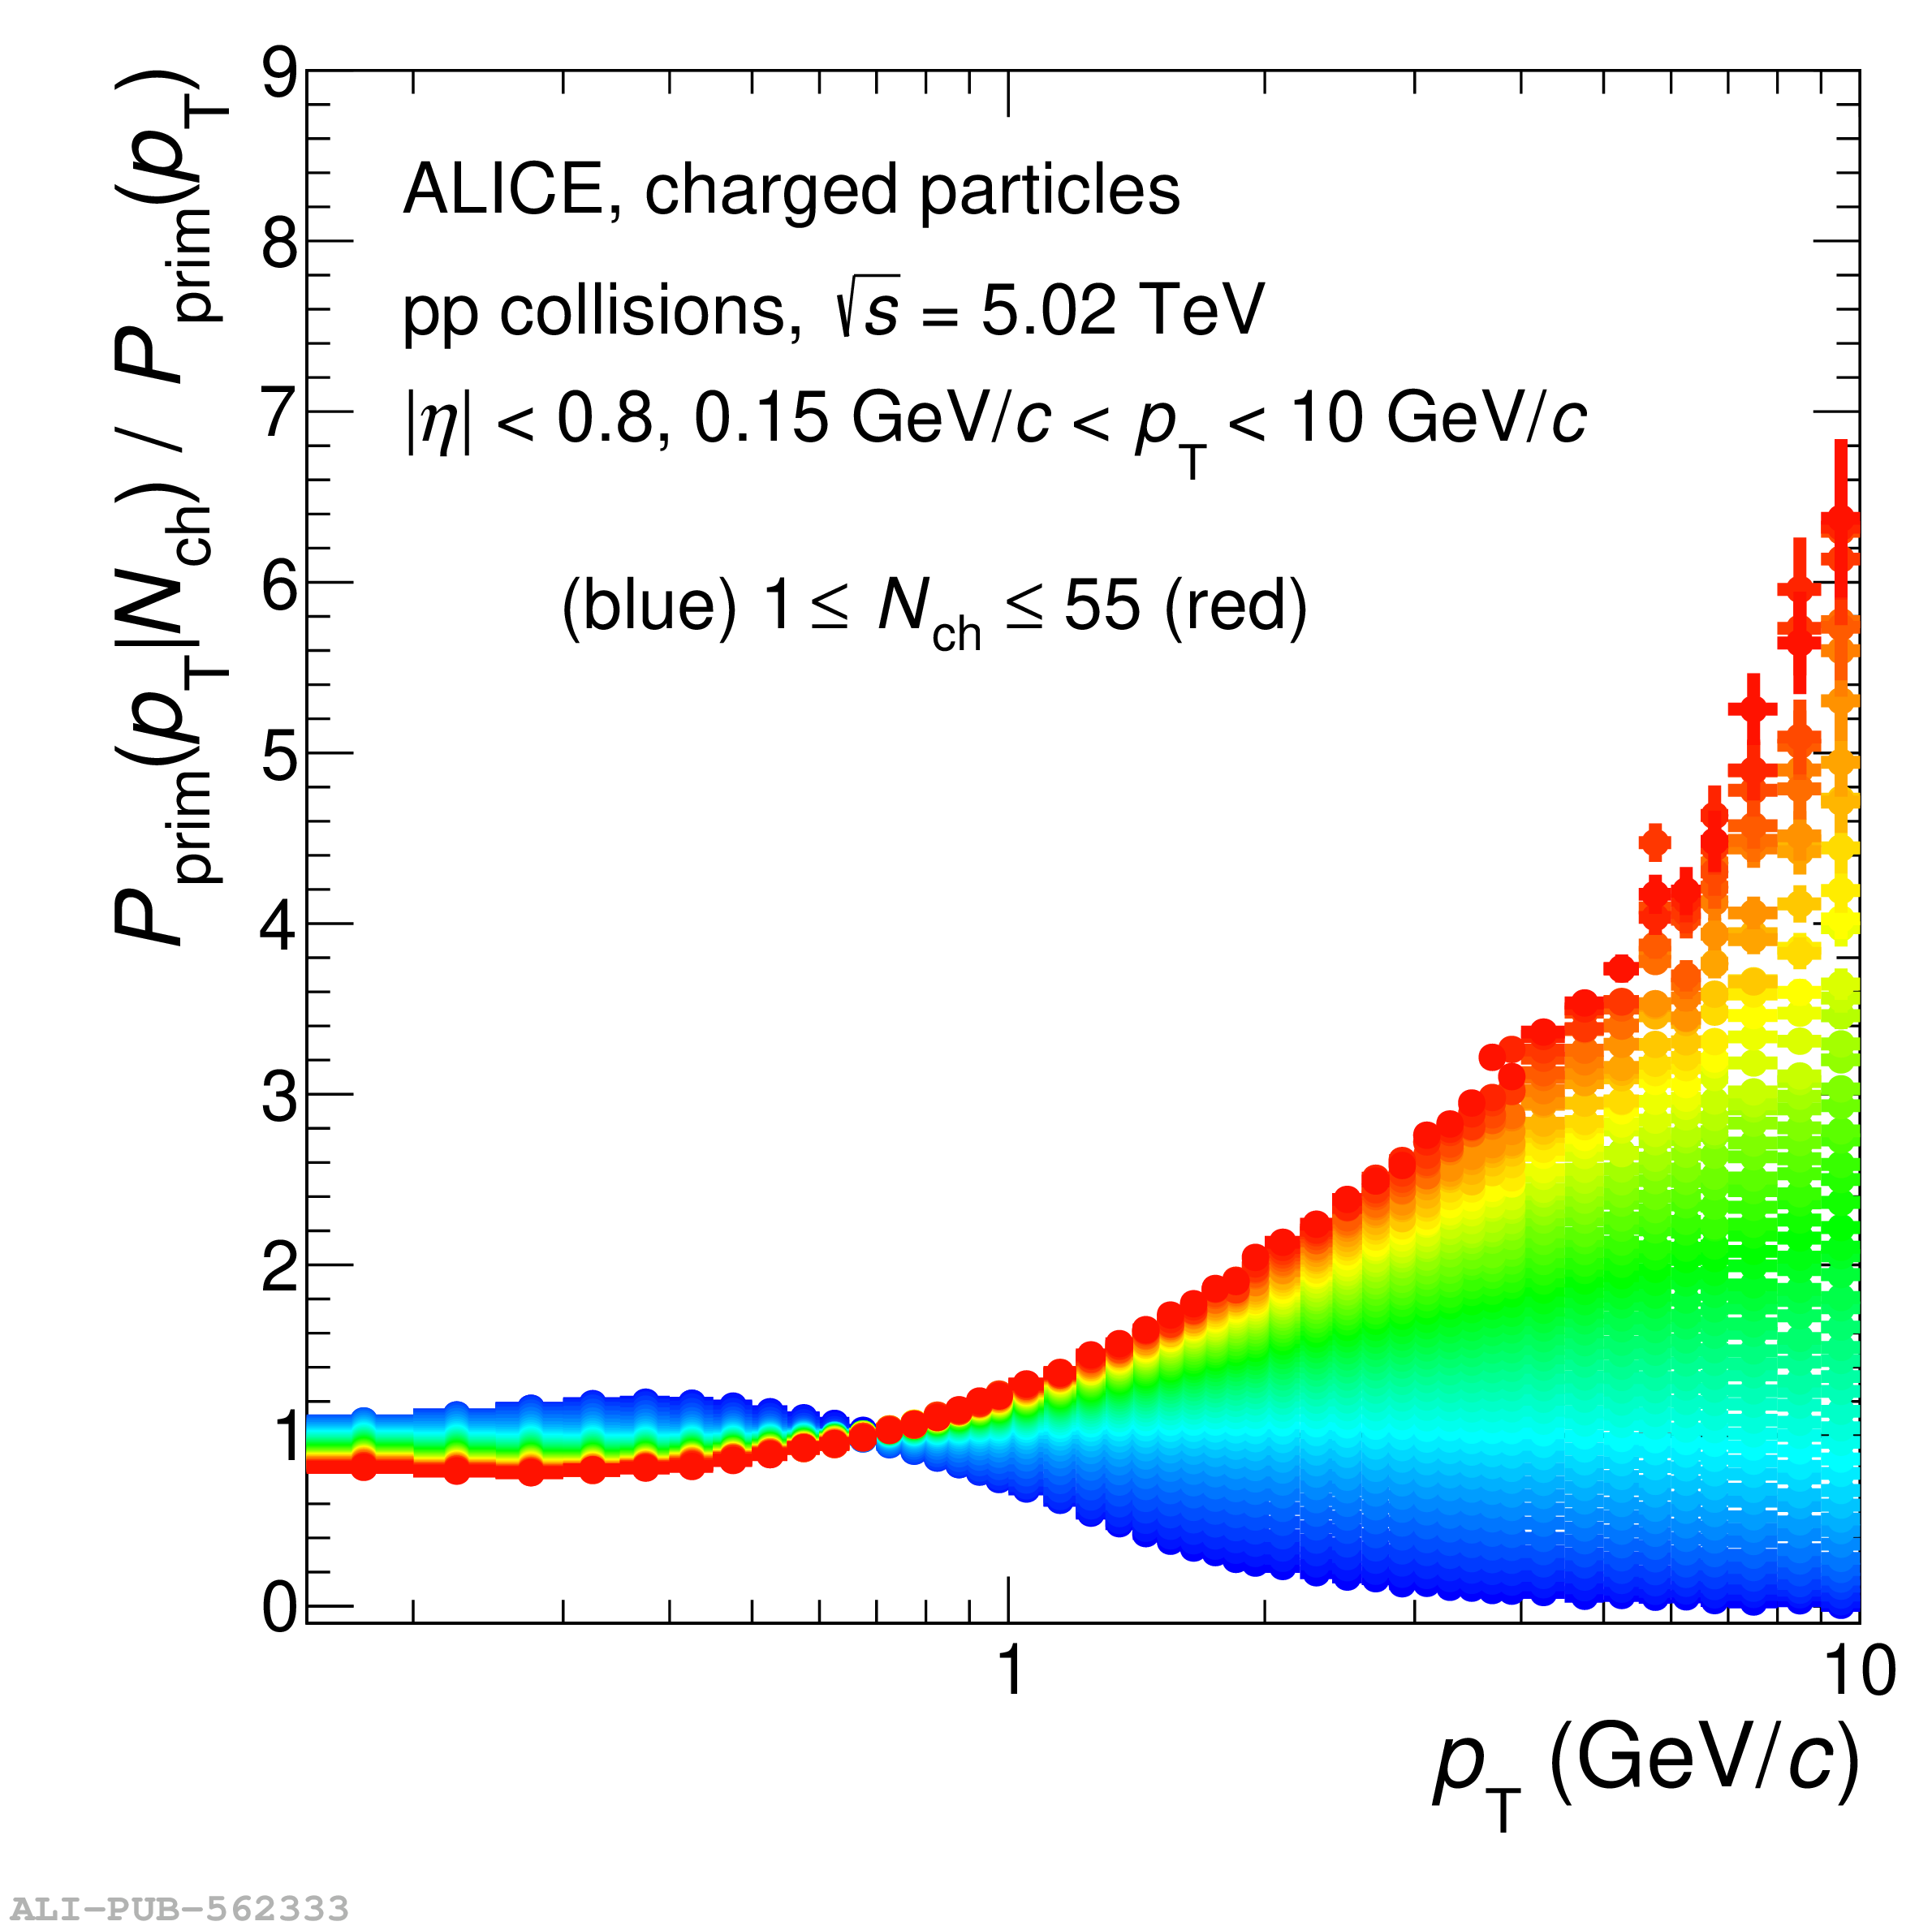  |
Figure 4
Probability density of charged-particle multiplicity $\nch$ (left) and the corresponding KNO-scaled distributions (right) for pp (top), p$-$Pb (middle), and AA (bottom) collisions at different centre-of-mass energies per nucleon pair. Statistical and systematic uncertainties are shown as bars and semi-transparent bands, respectively. | 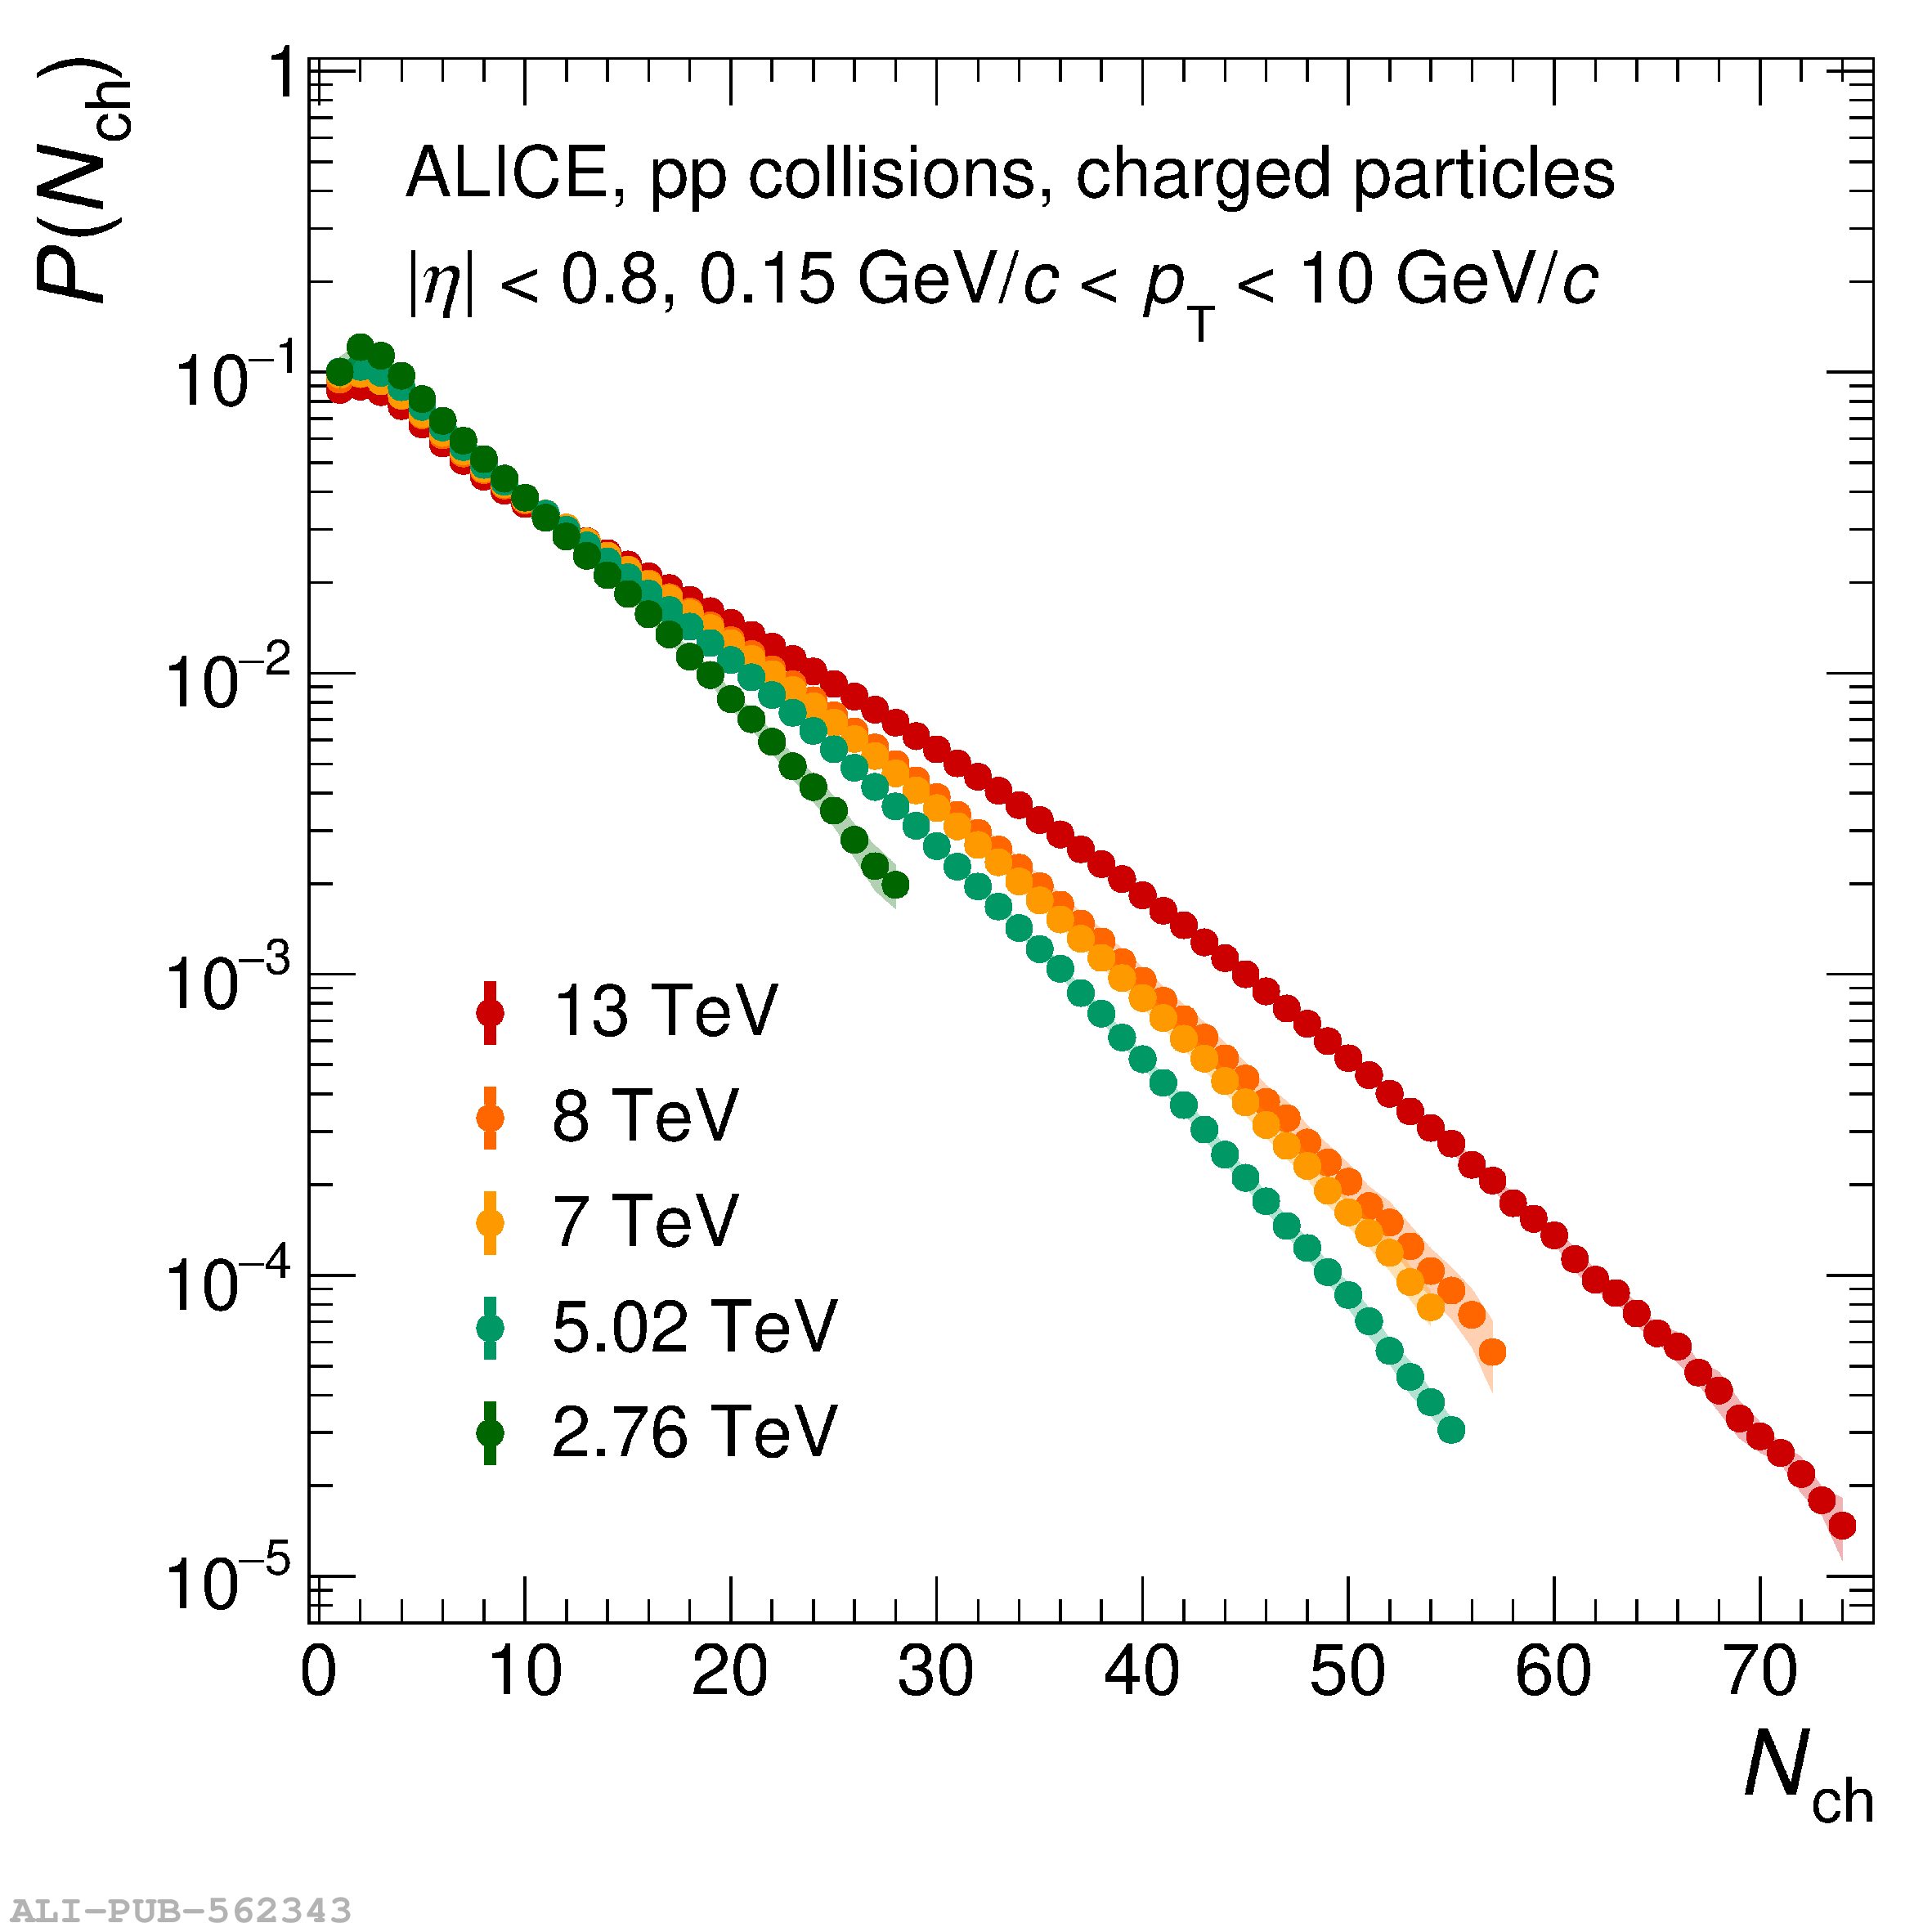 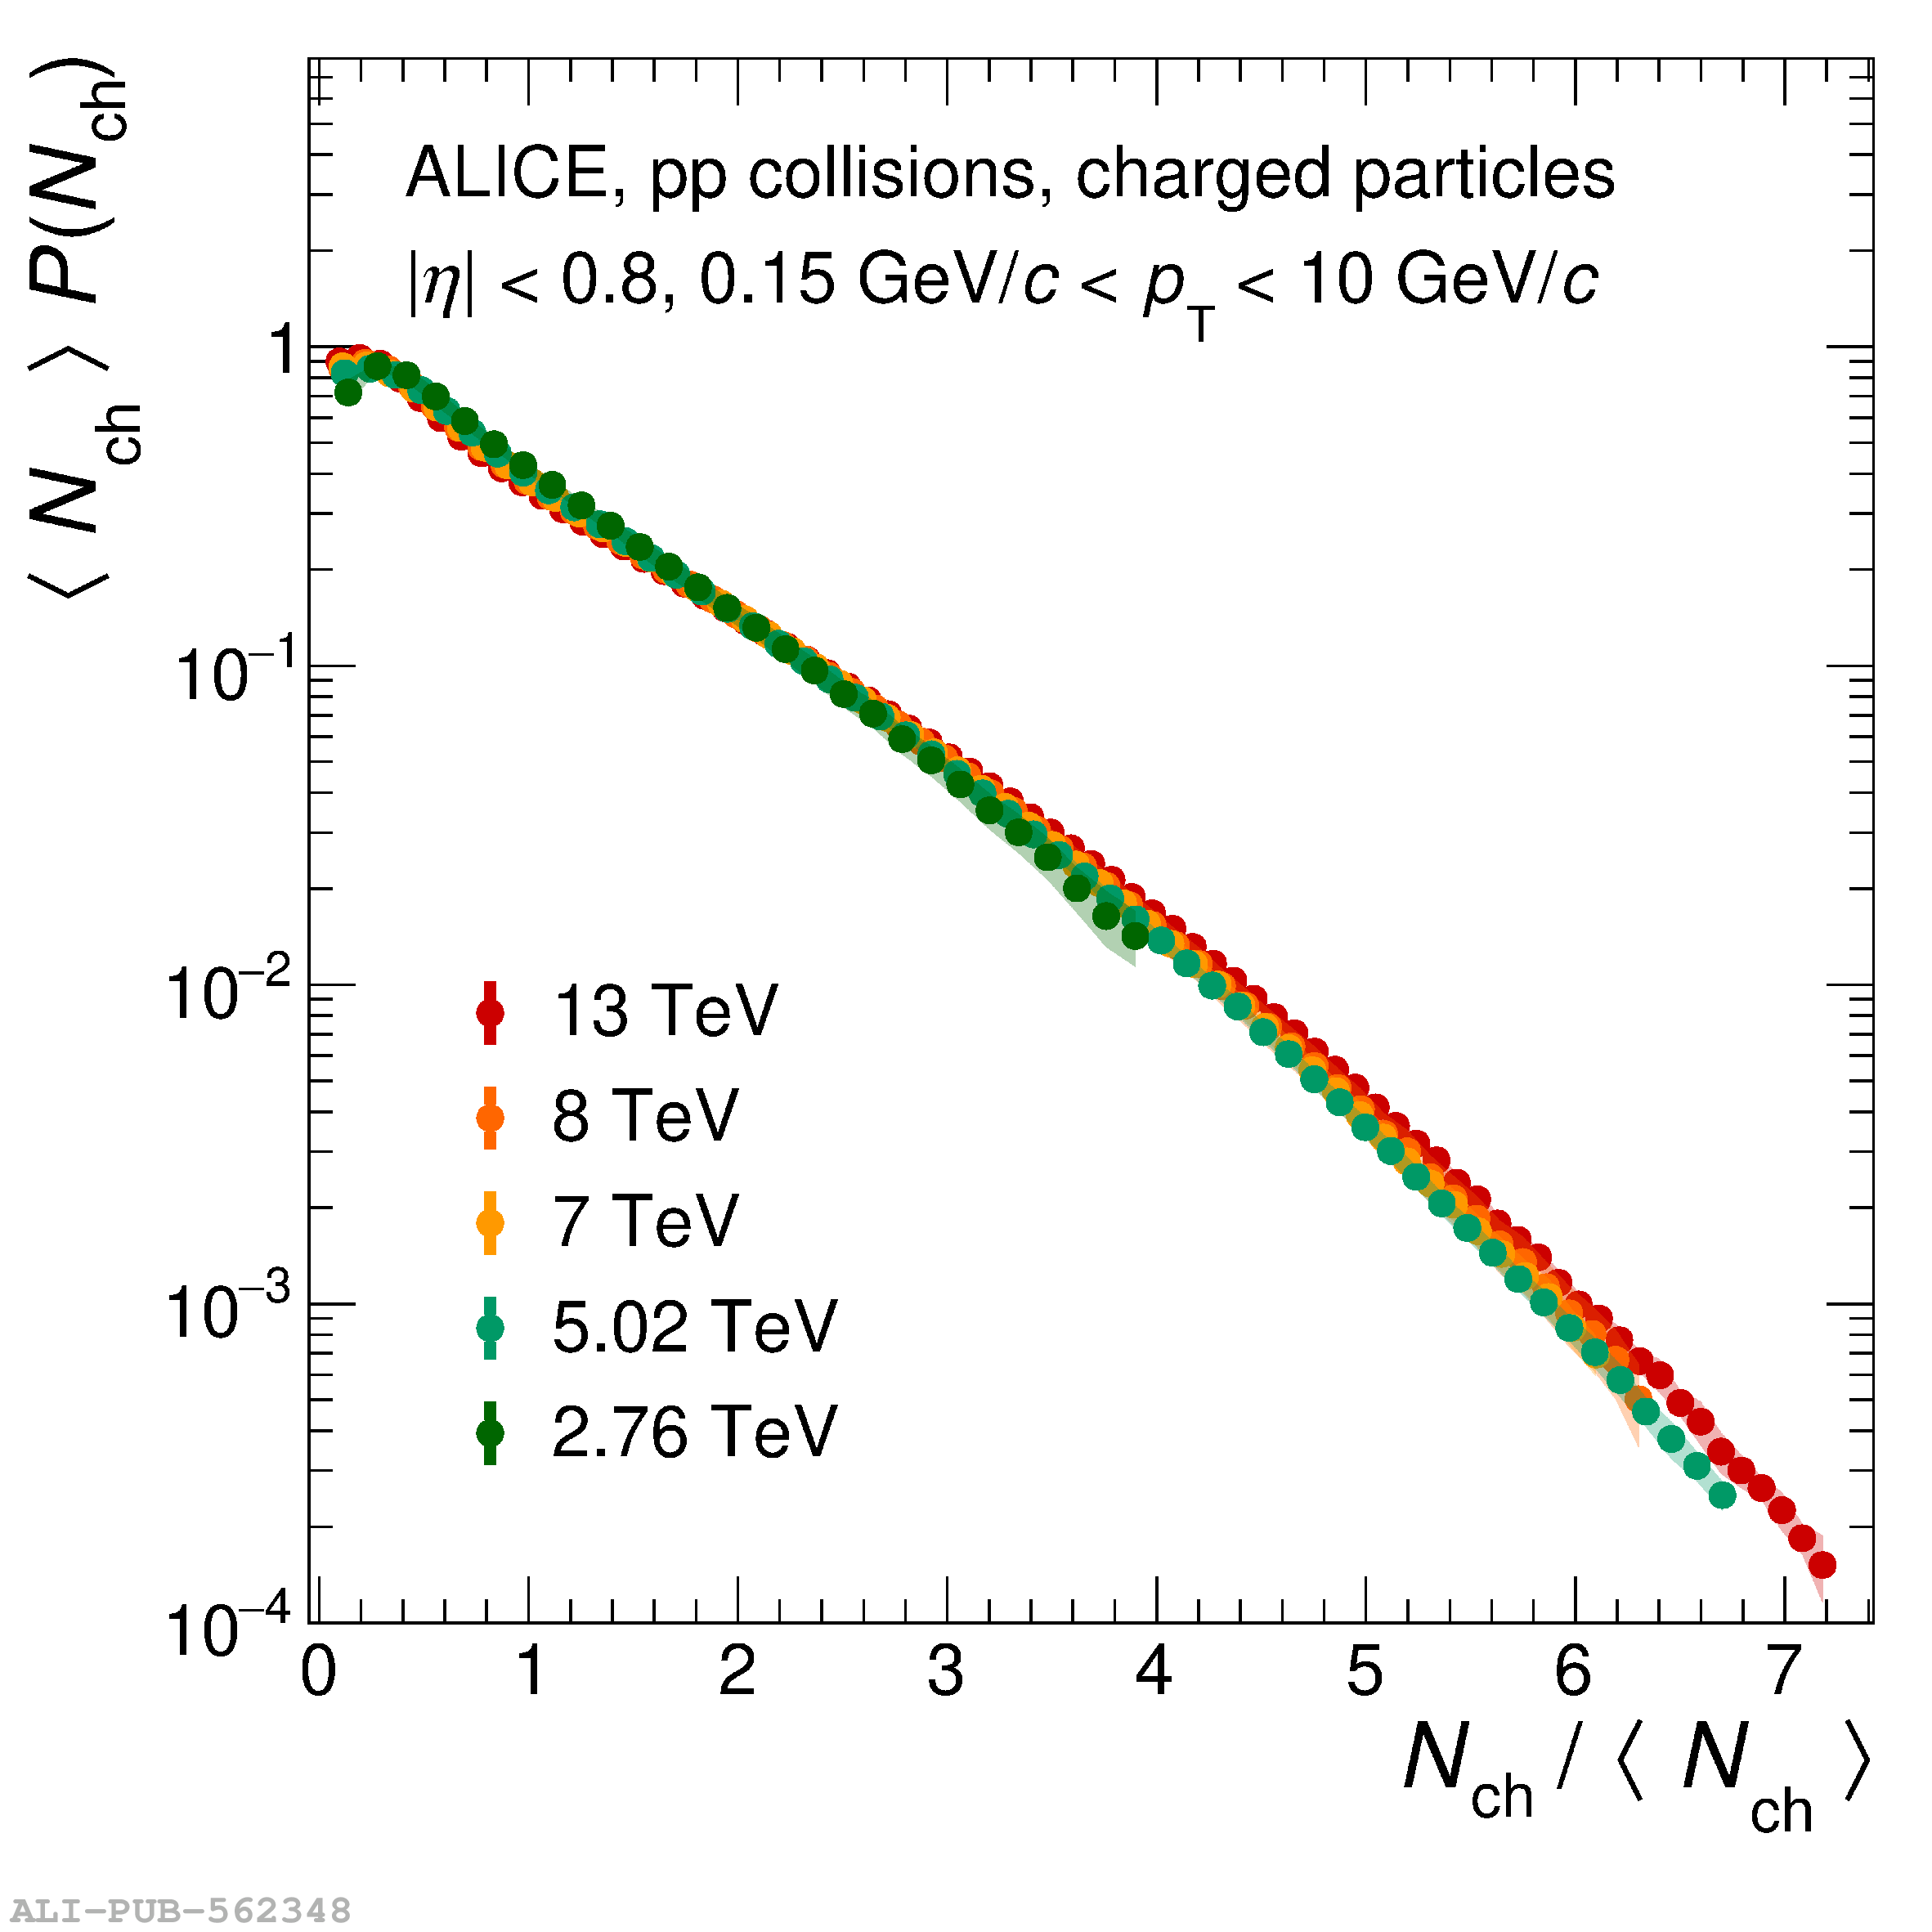 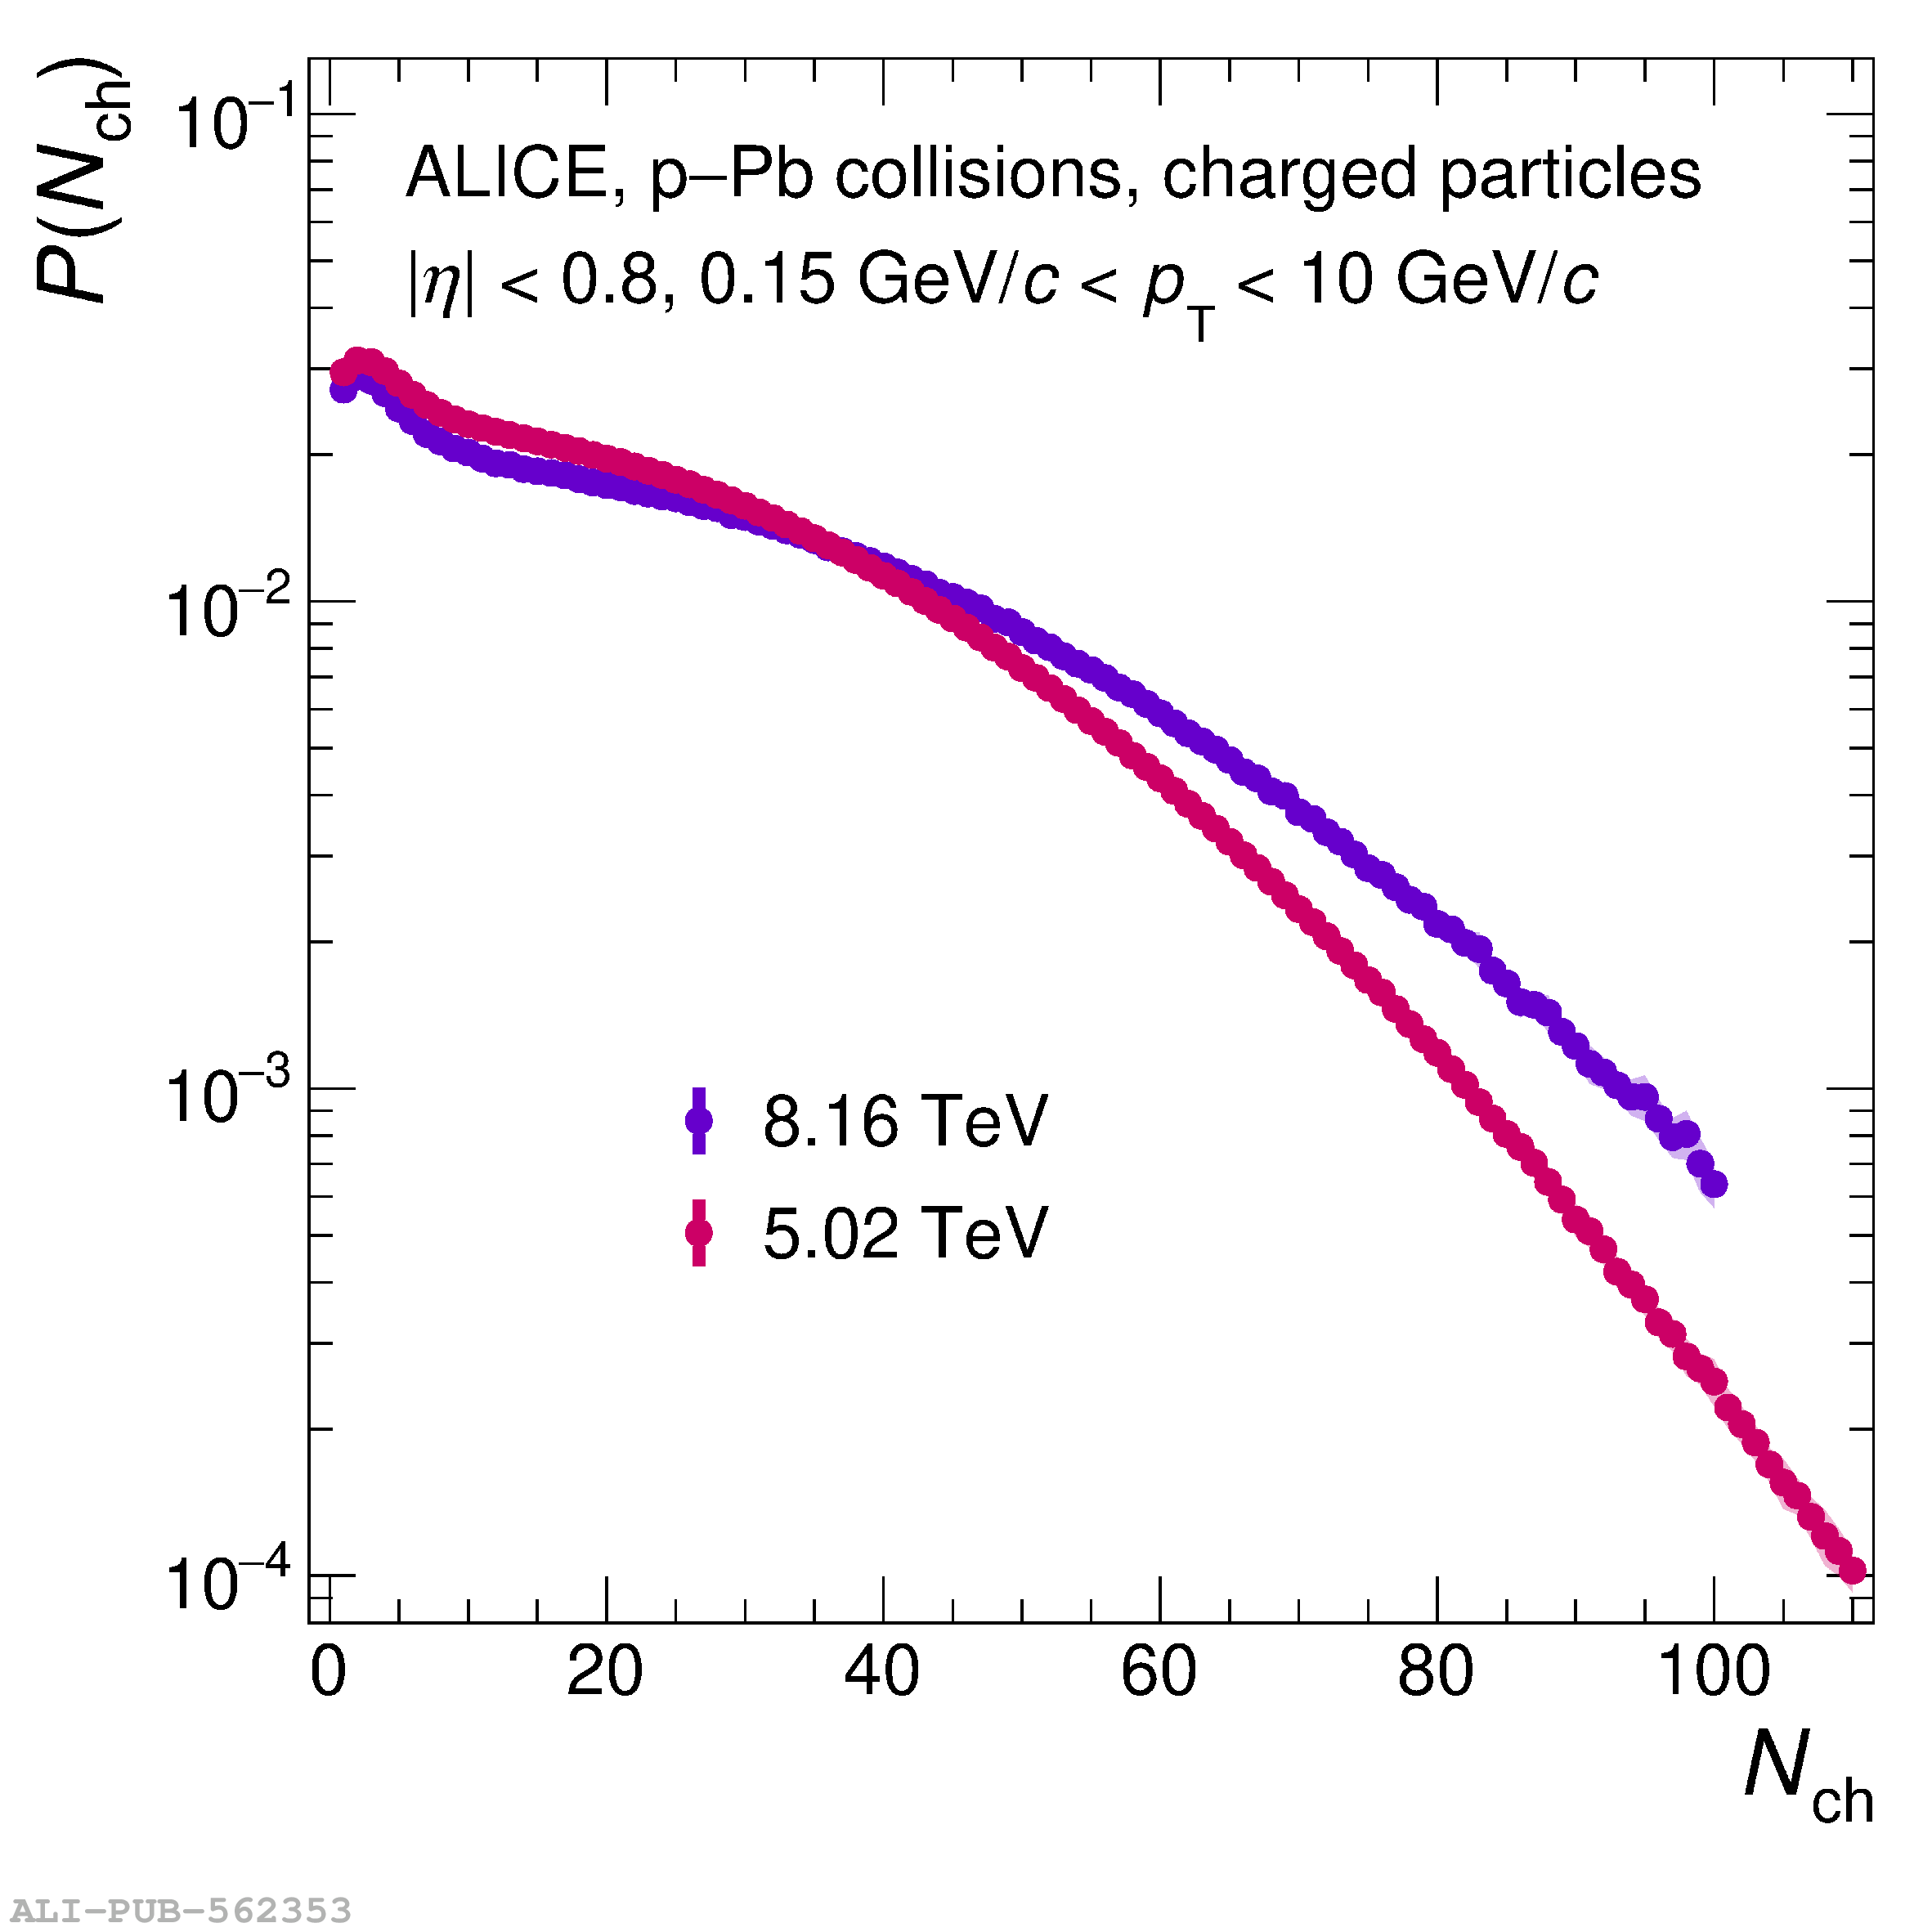 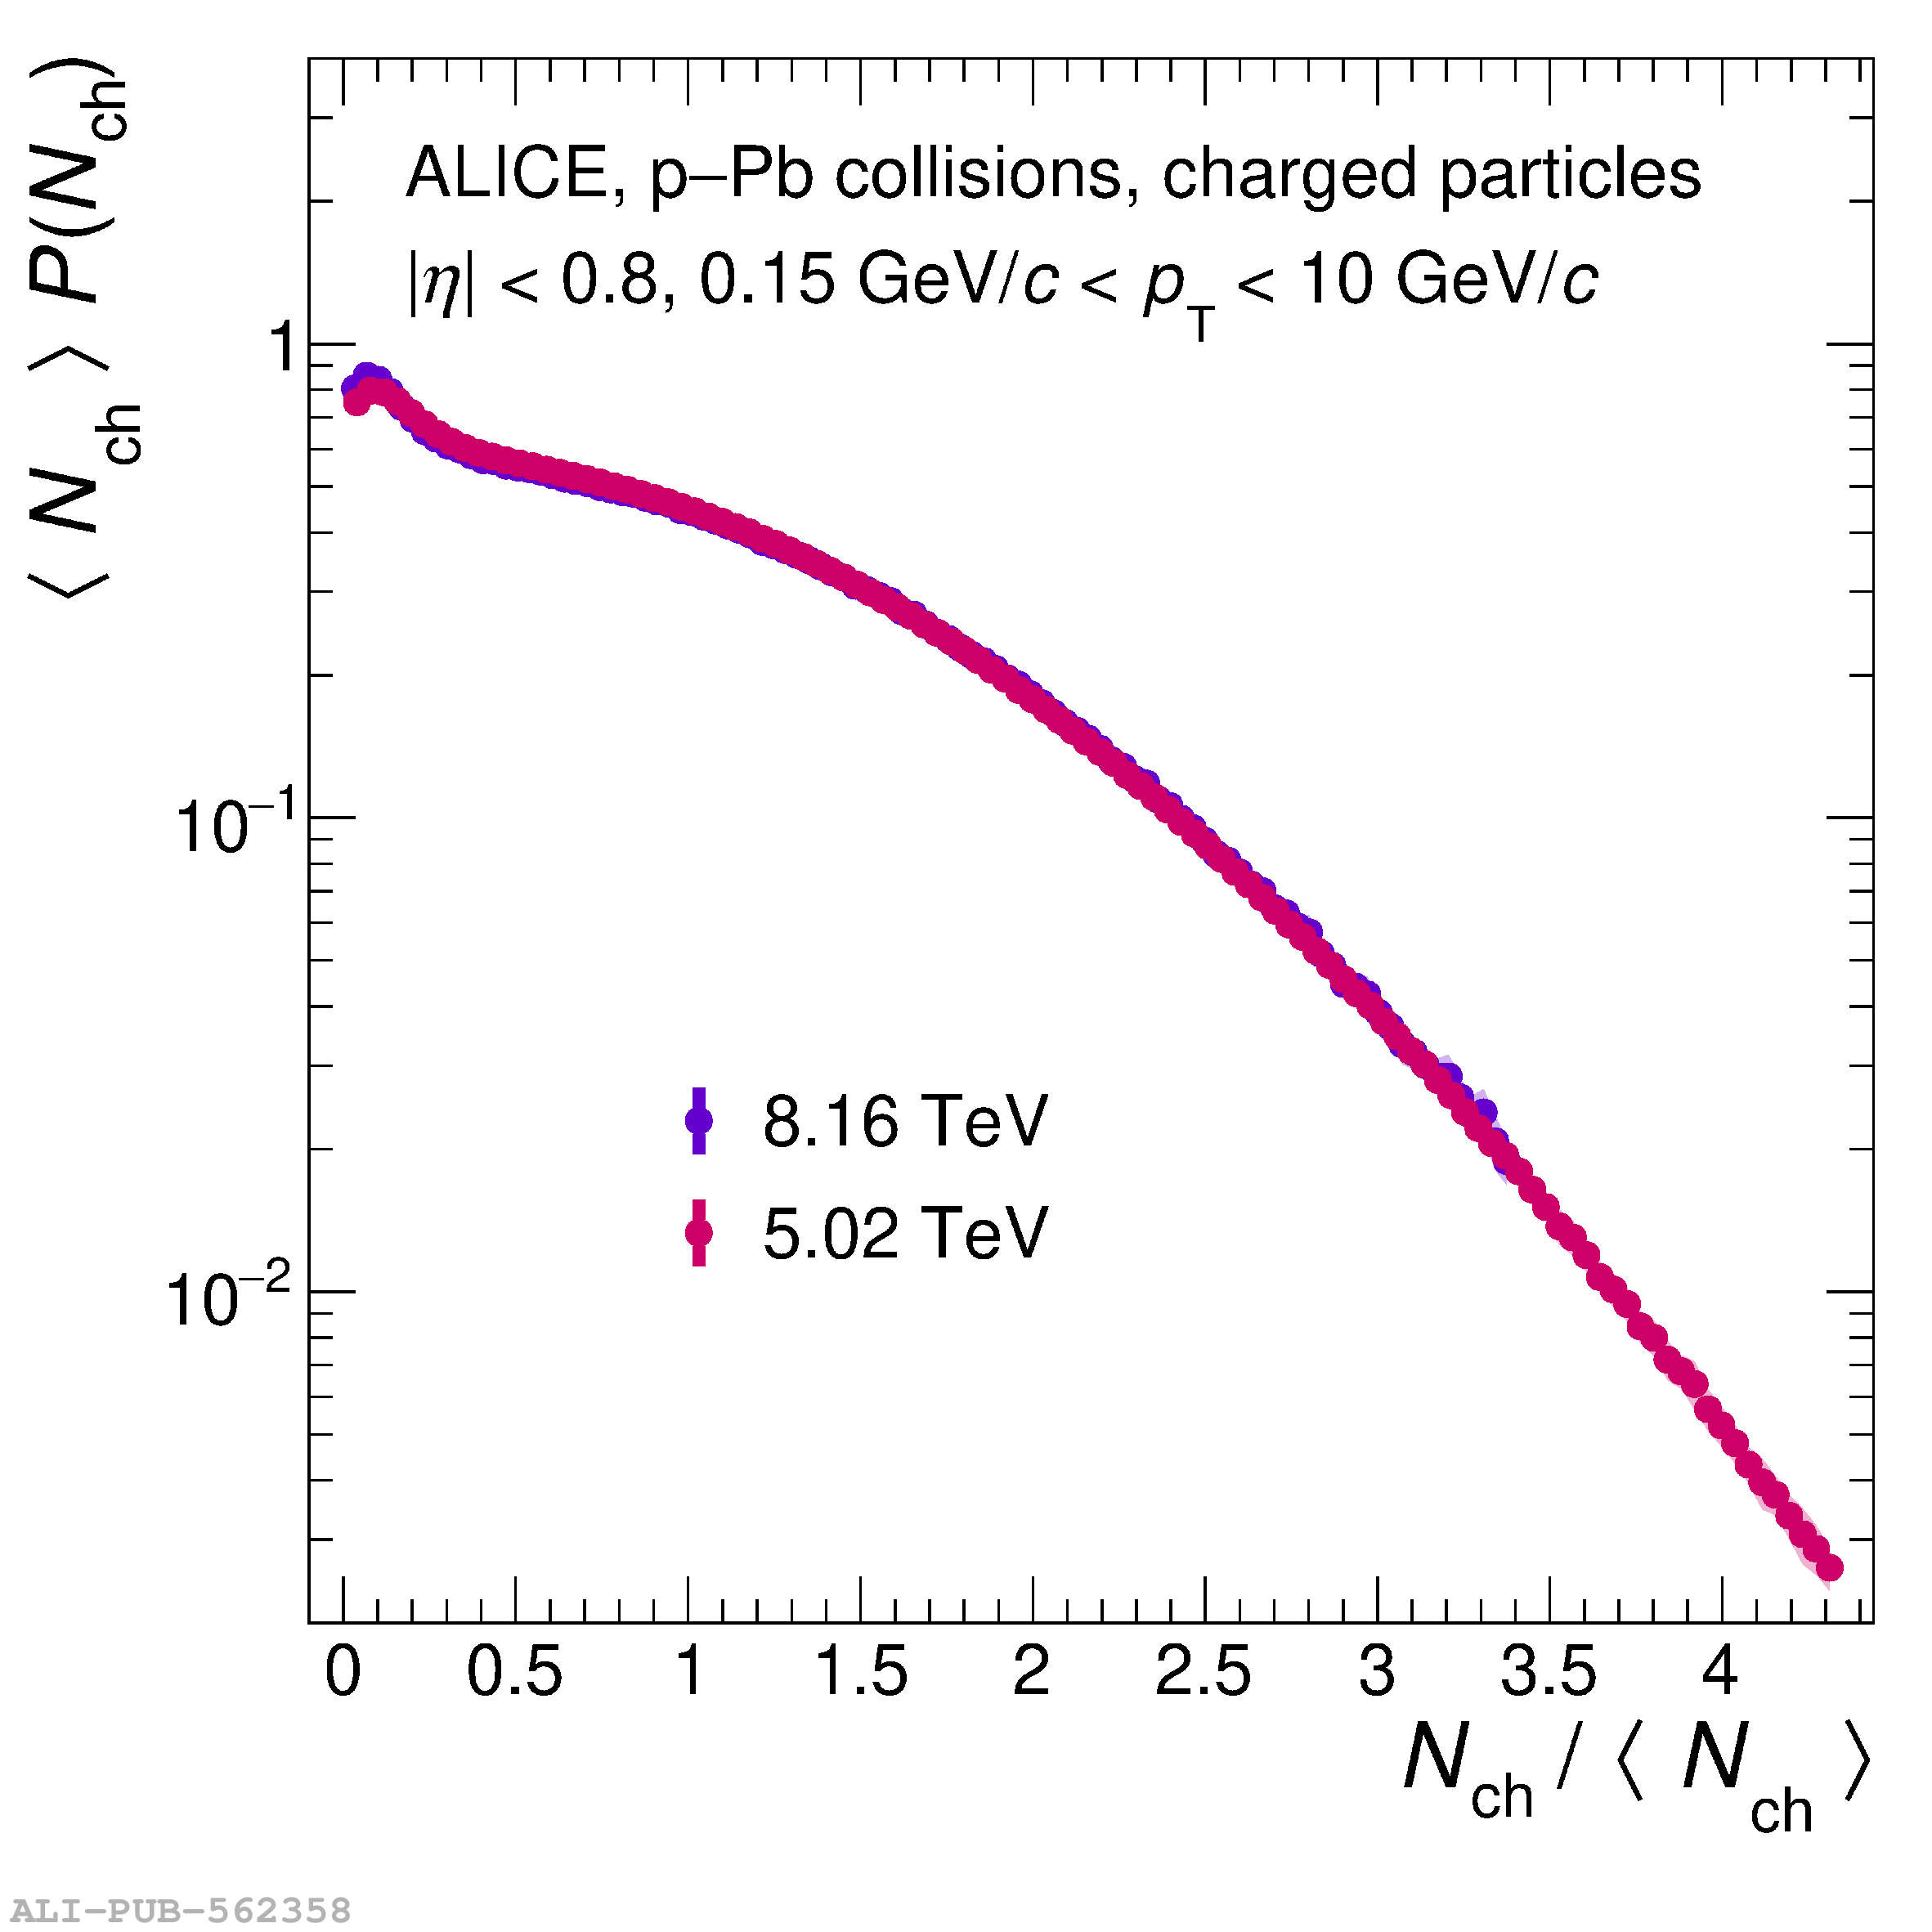 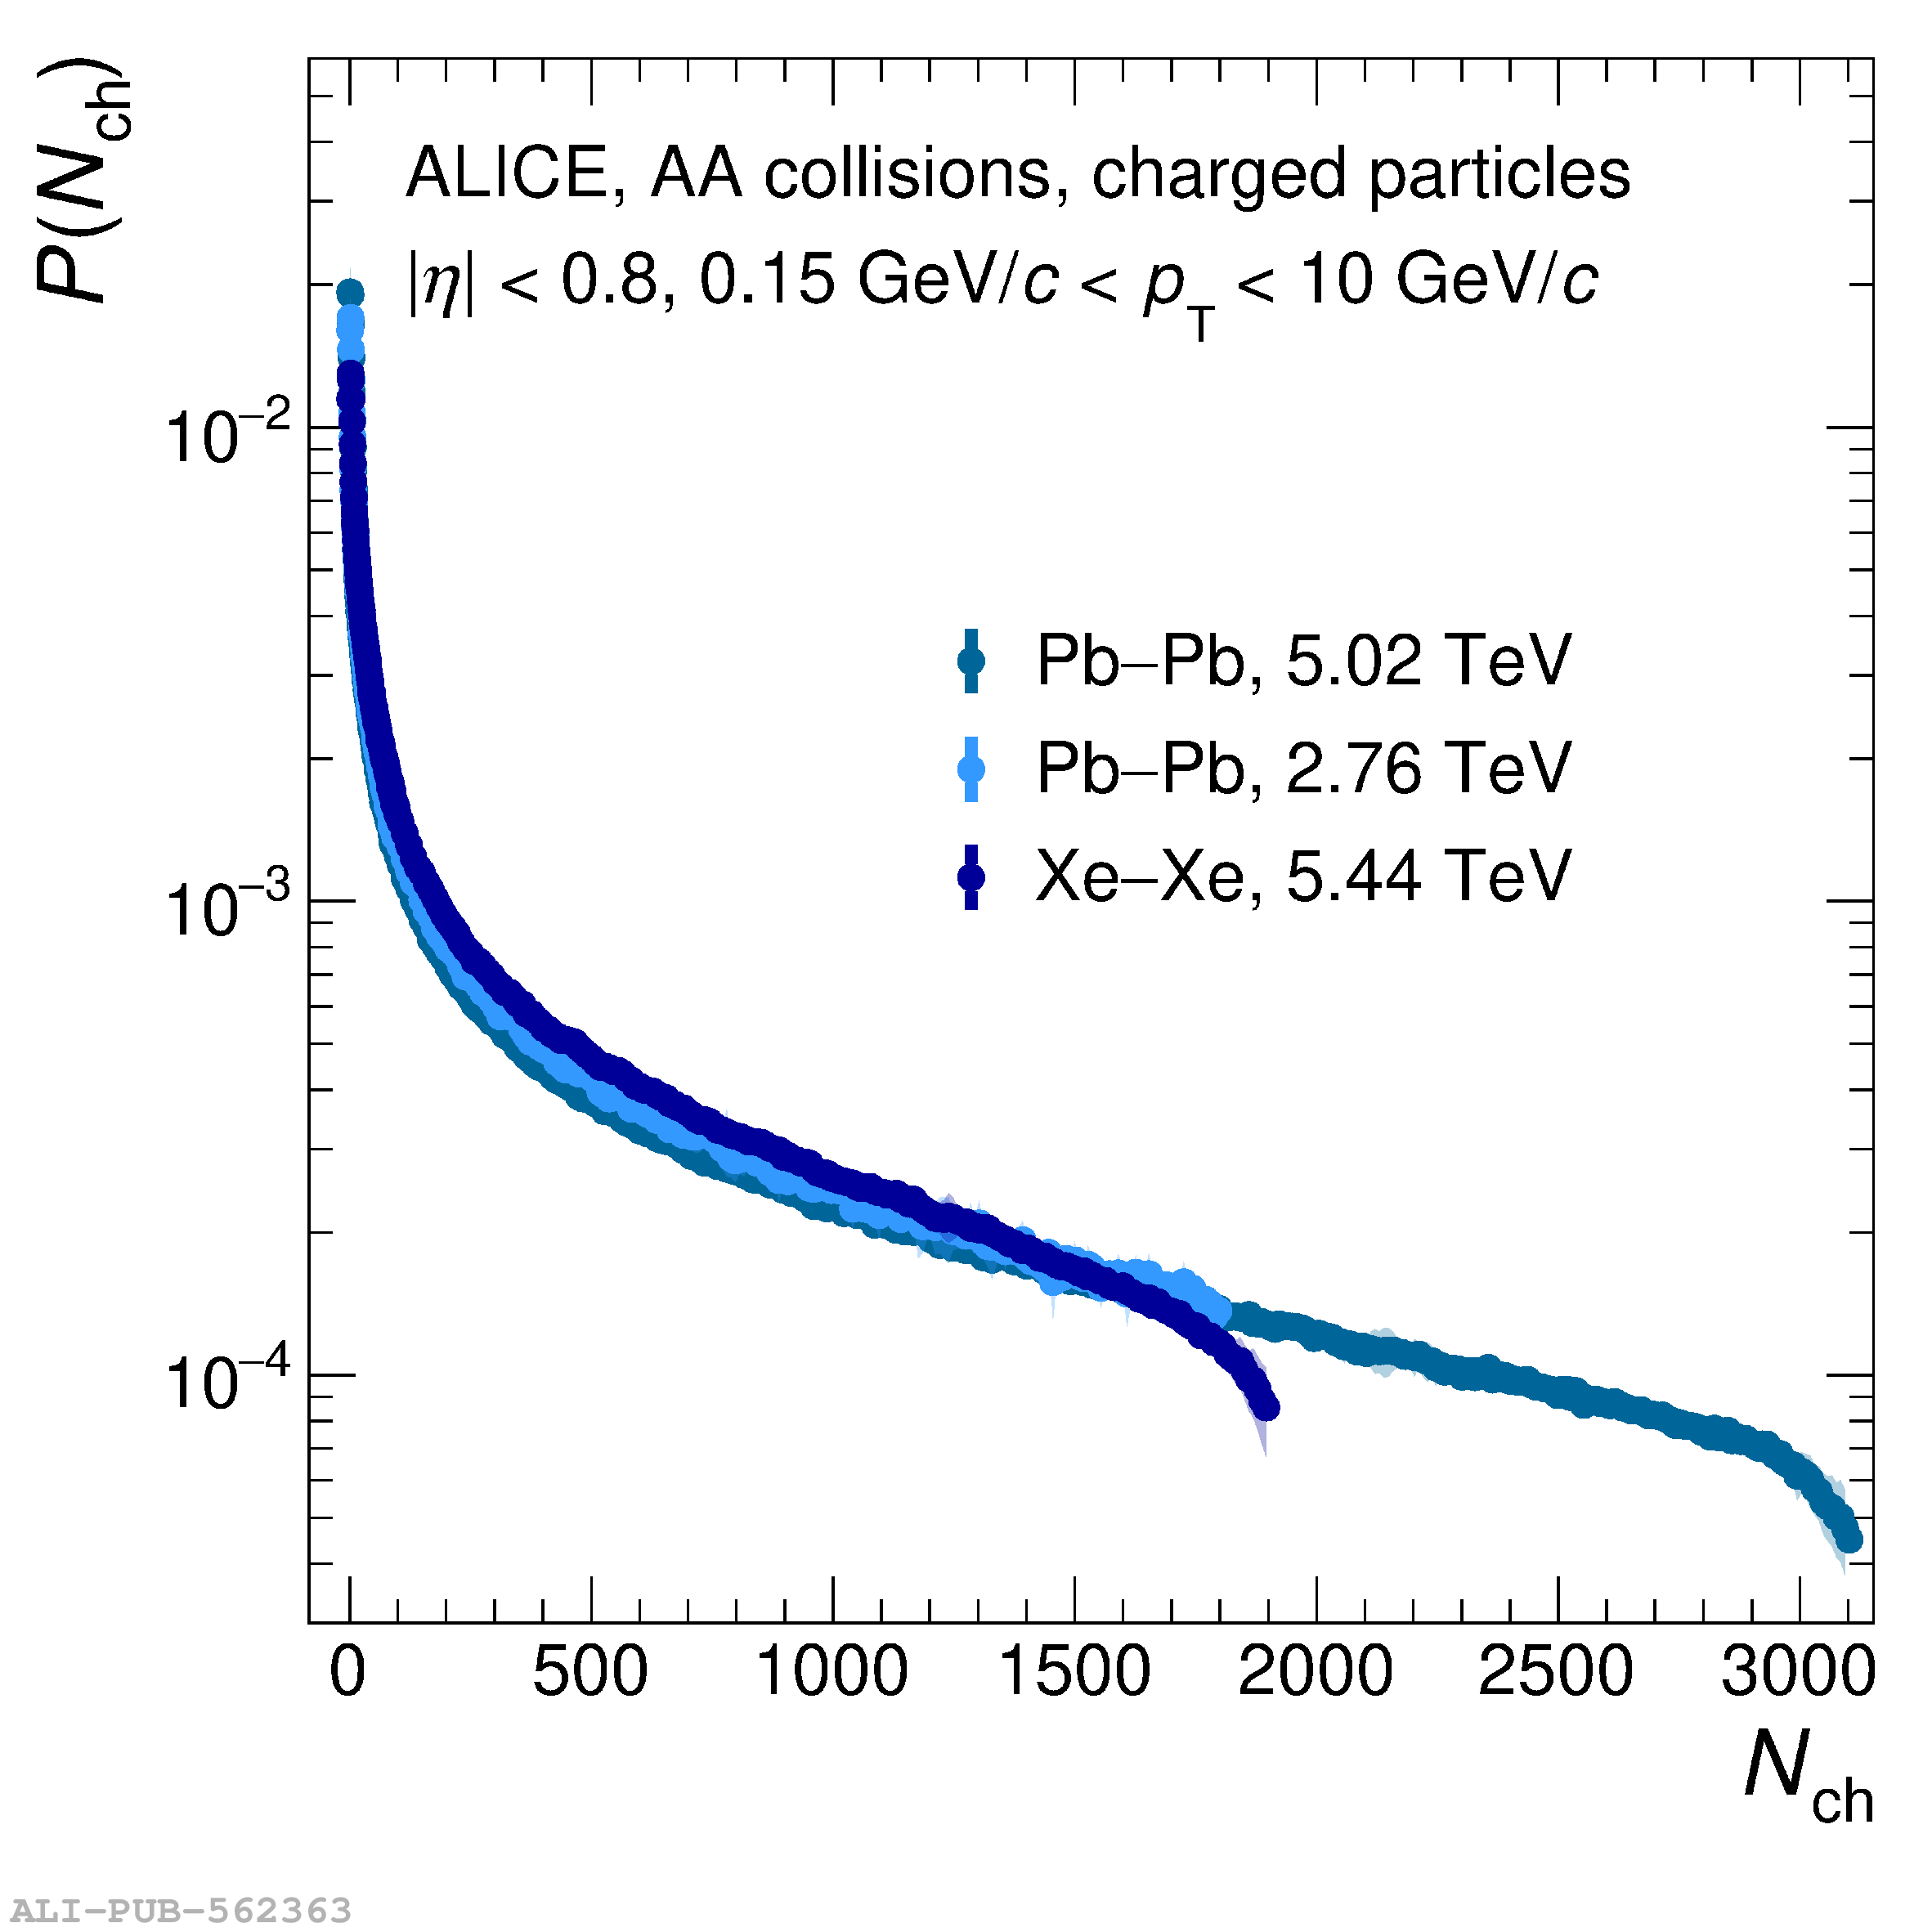 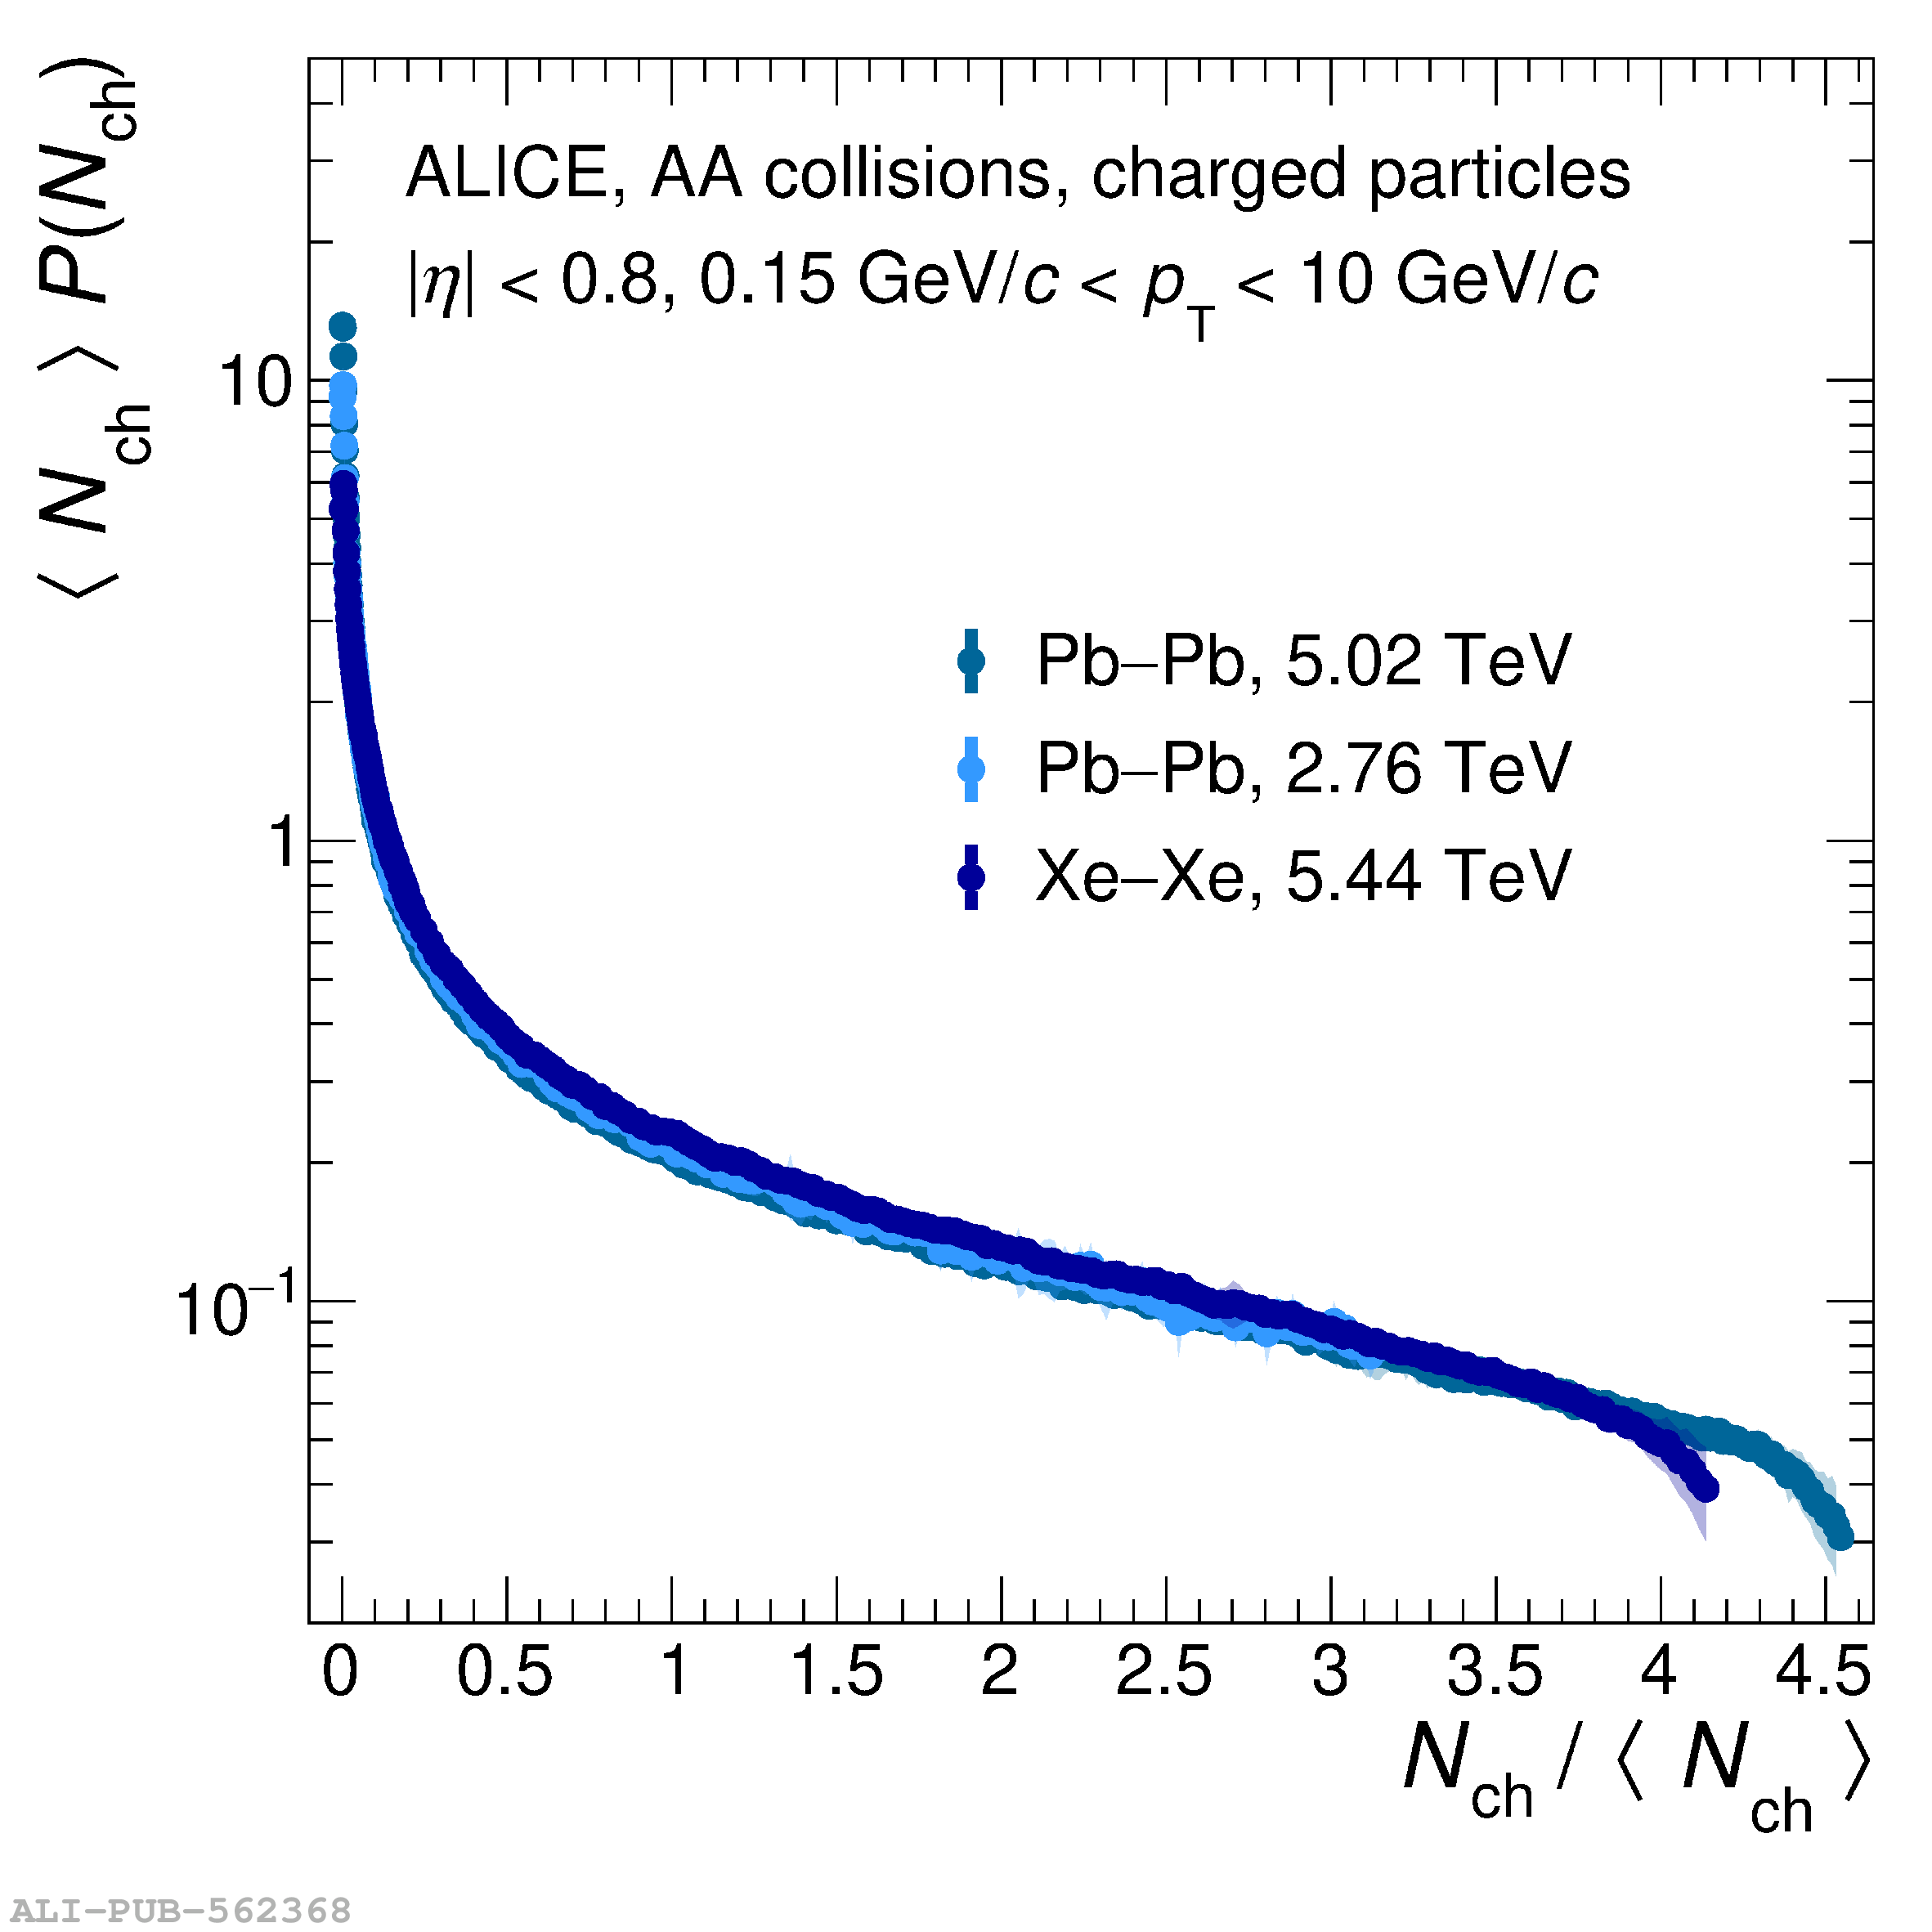 |
Figure 5
Ratios of the KNO-scaled multiplicity distributions at various centre-of-mass energies per nucleon pair relative to $\sqrt{s}$ = 13 TeV for pp collisions (top panel) and relative to $\sqrt{s_{\rm NN}}$ = 8.16 TeV and $\sqrt{s_{\rm NN}}$ = 5.02 TeV for p$-$Pb and Pb$-$Pb collisions, respectively (left and right bottom panels). Statistical and systematic uncertainties are shown as bars and semi-transparent bands, respectively. | 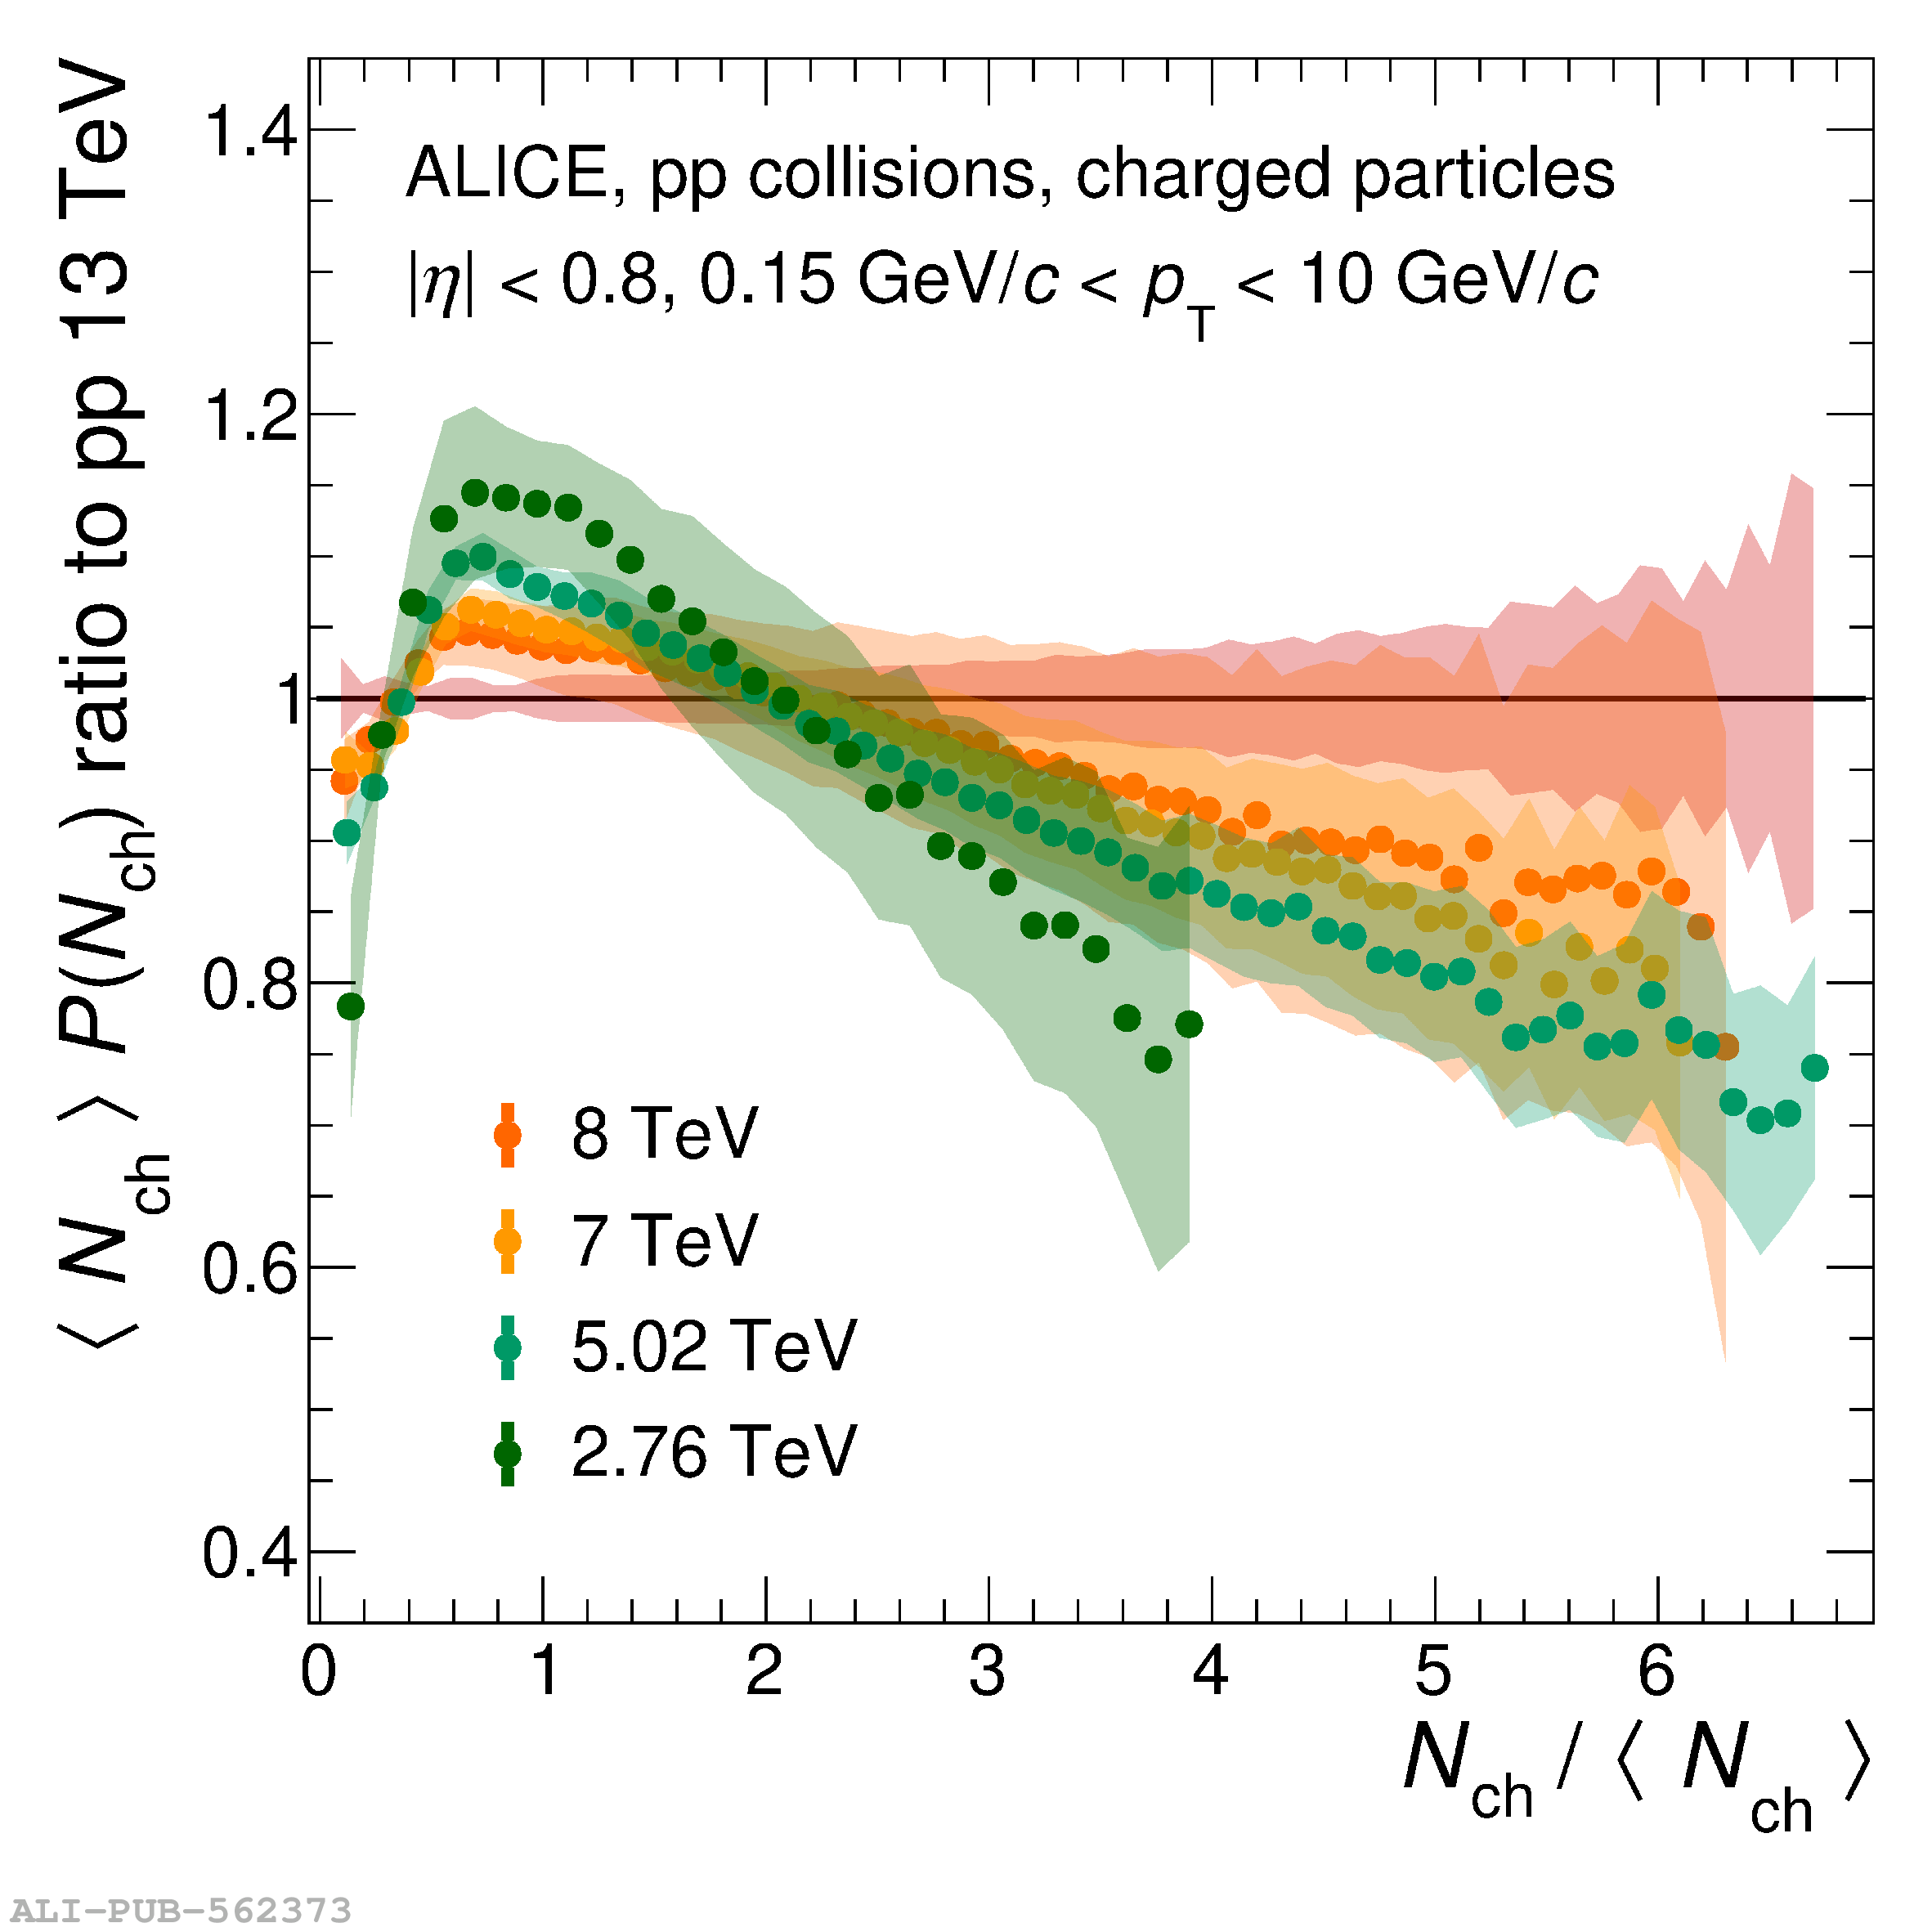 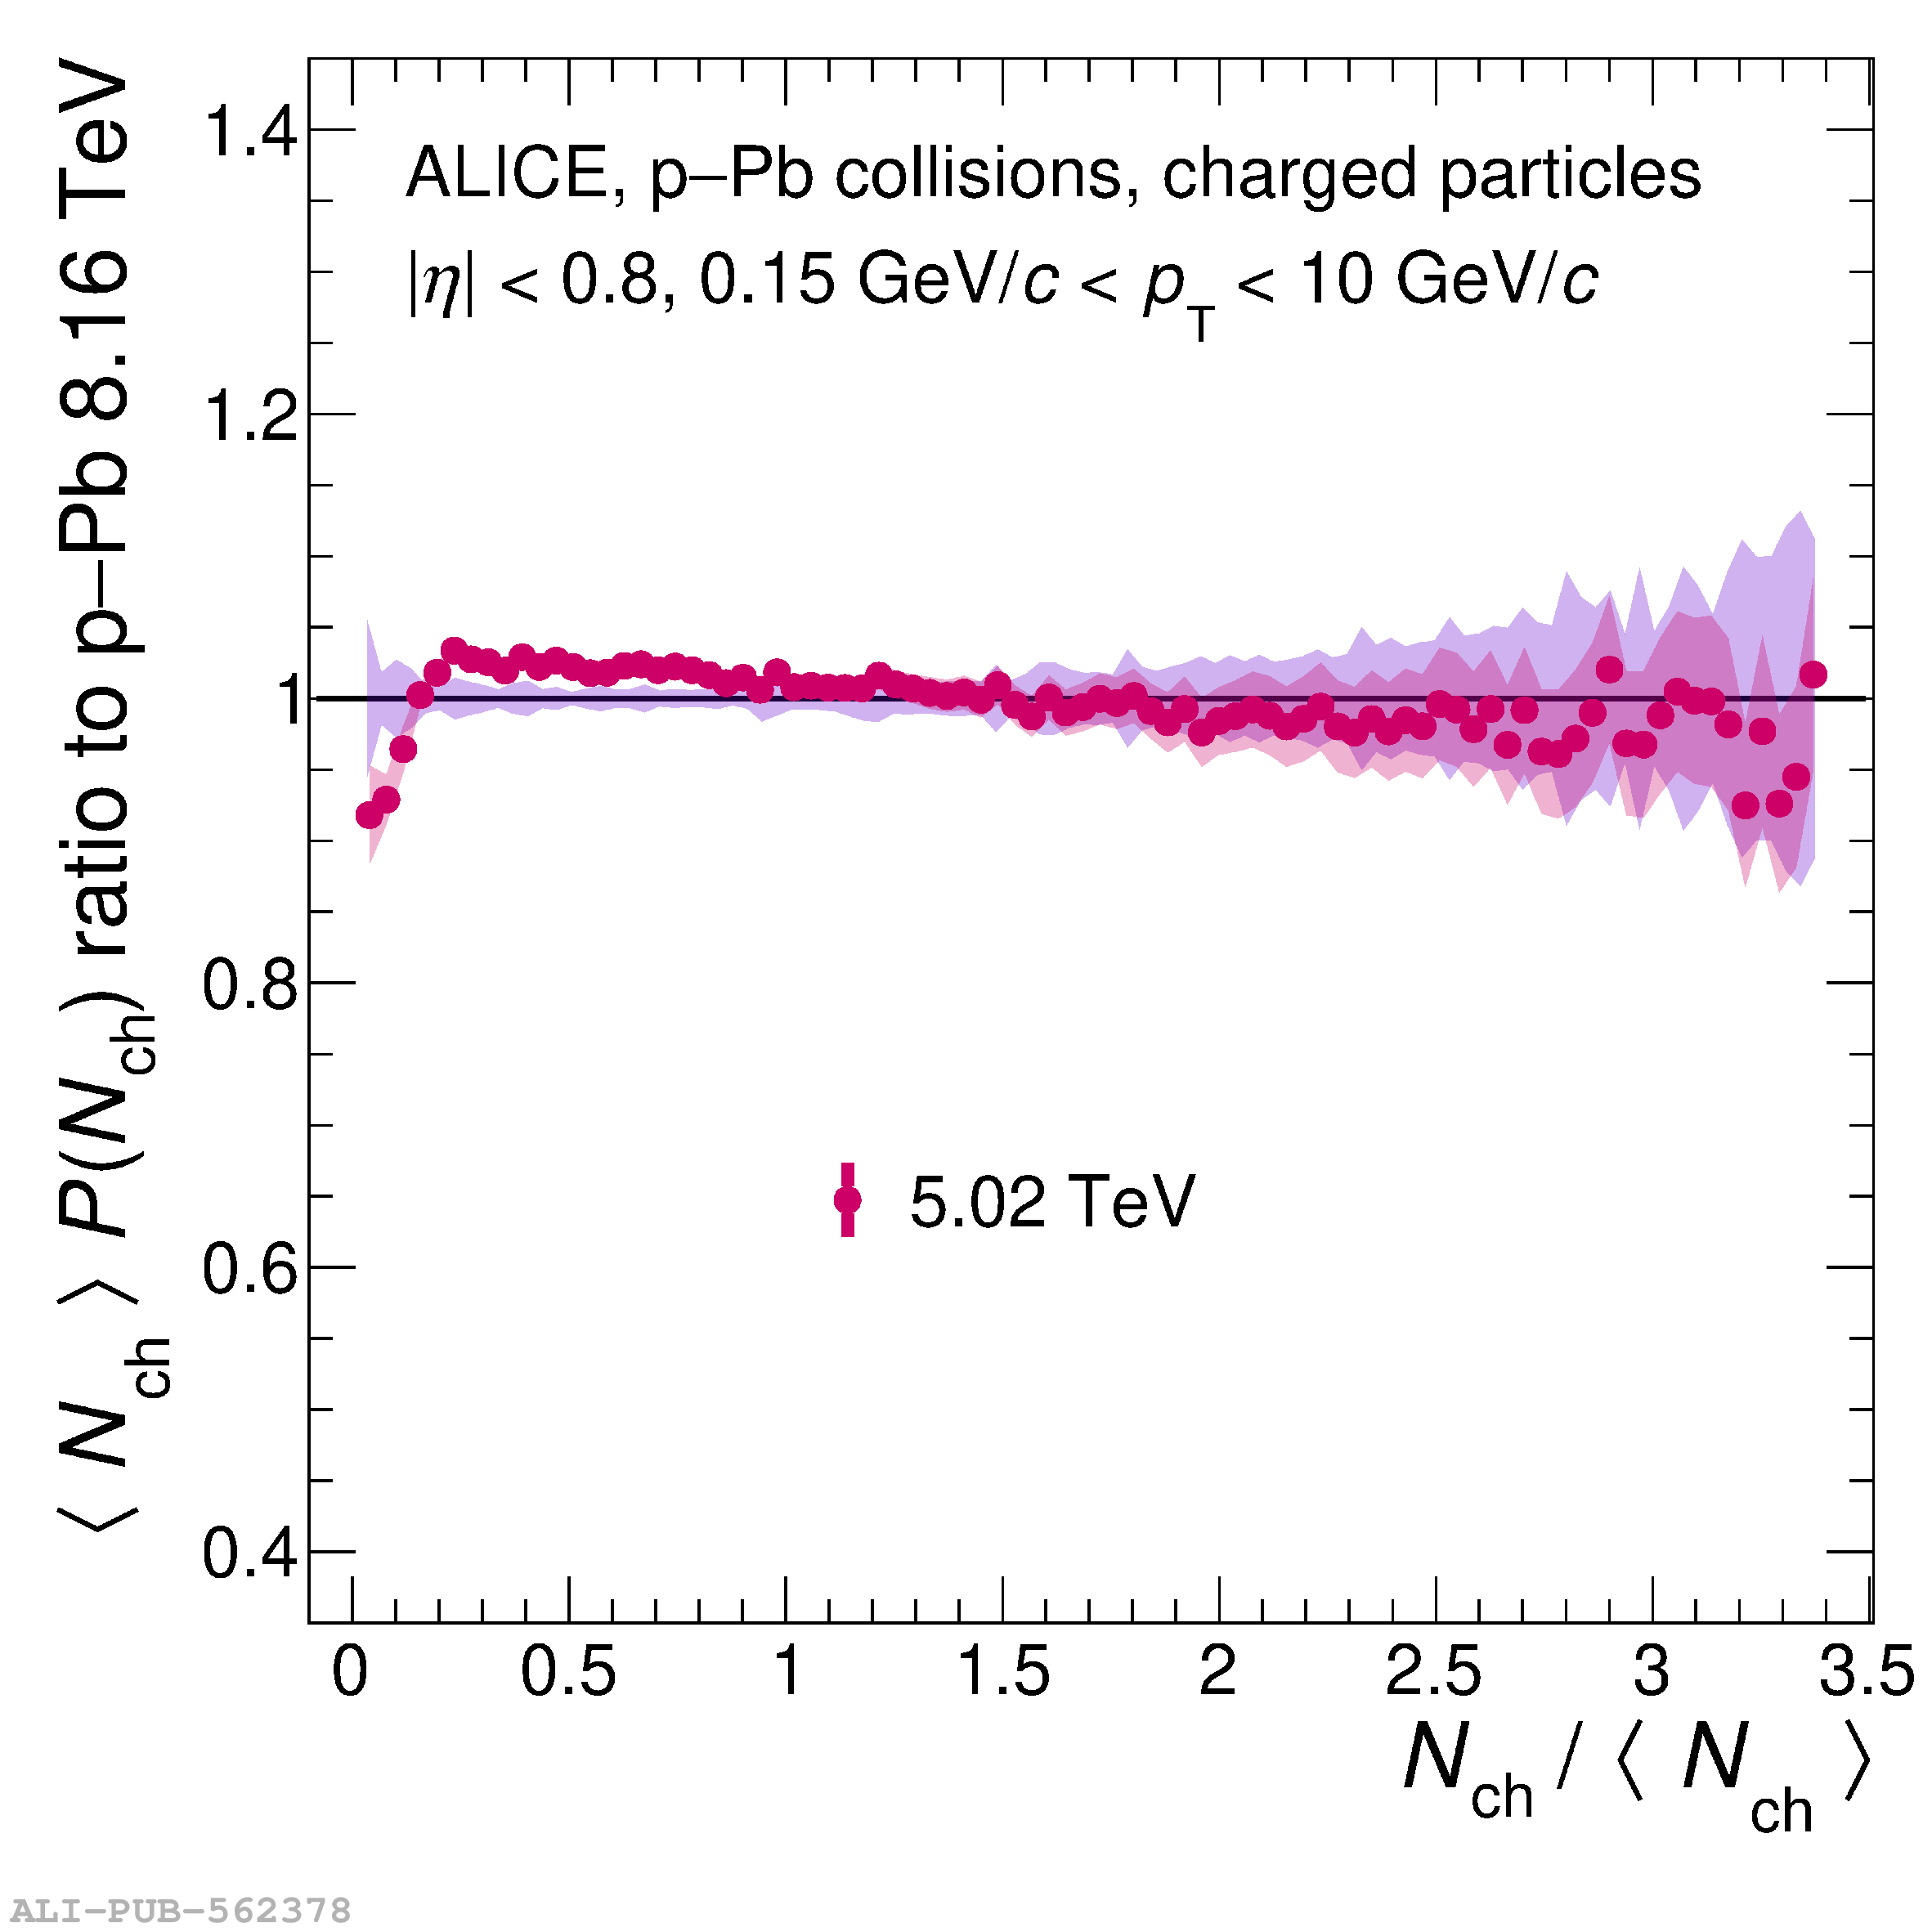 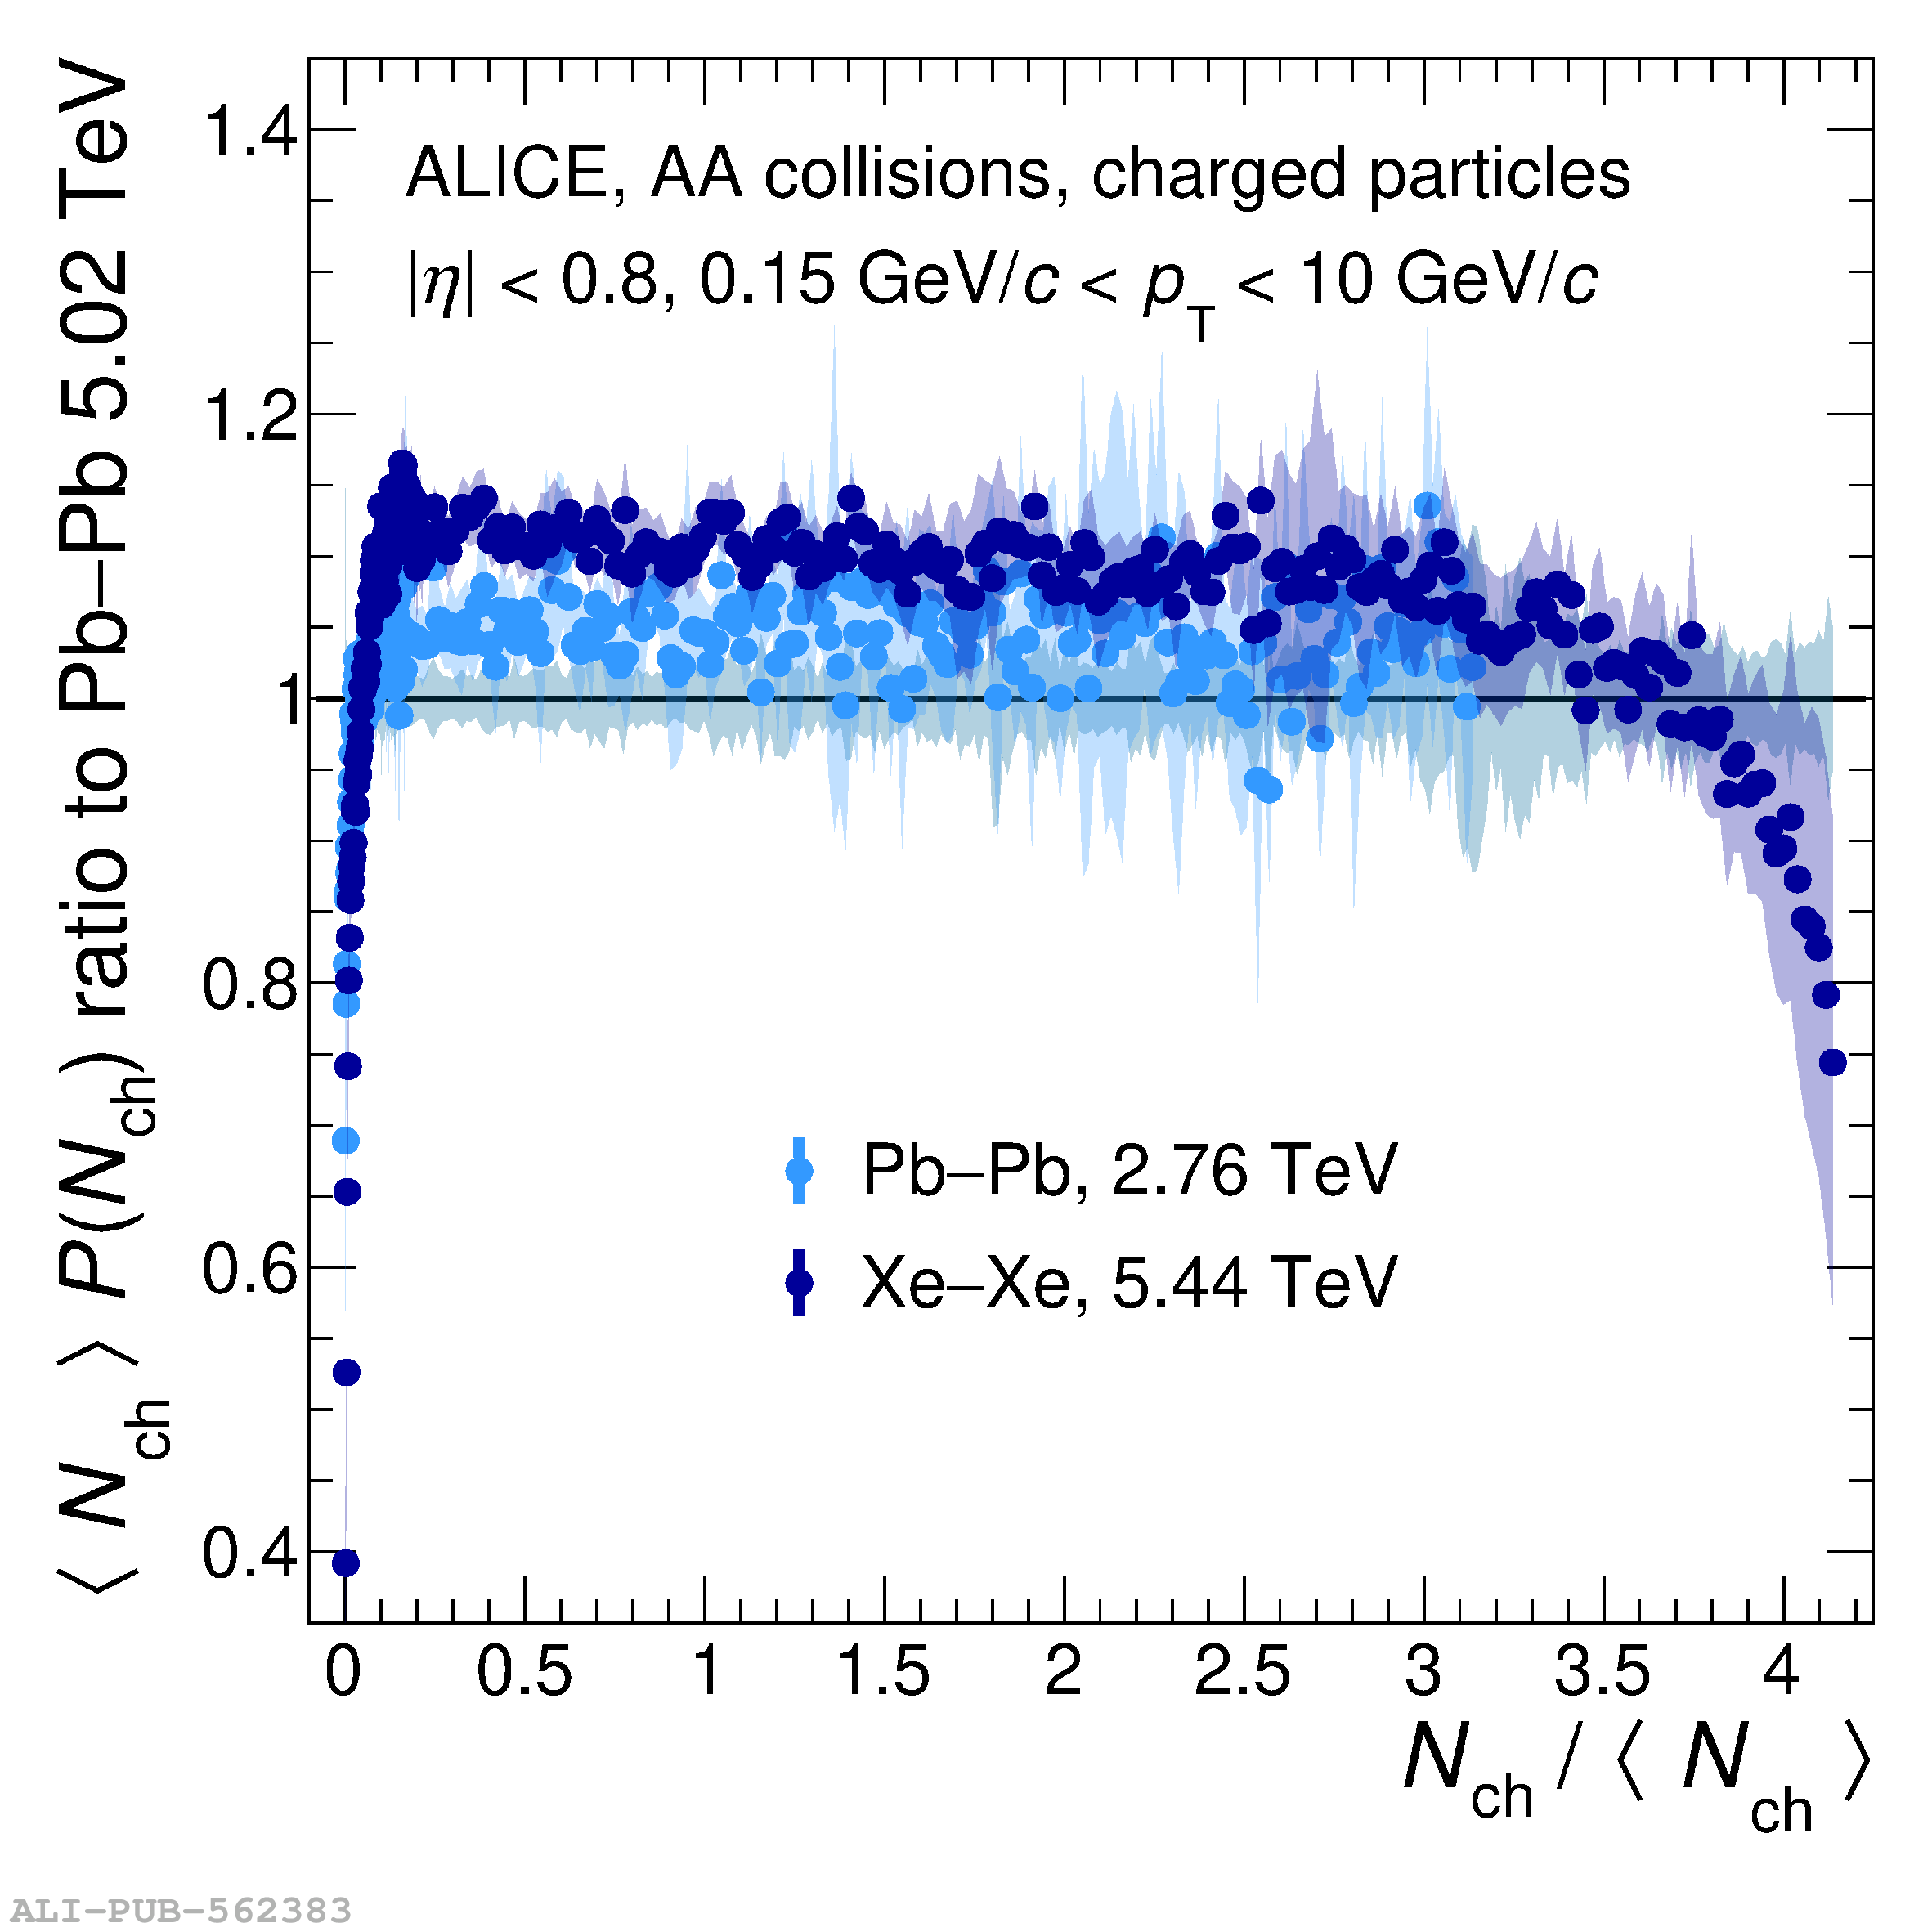 |
Figure 6
Mean (left) and standard deviation (right) of the charged-particle transverse momentum spectra as a function of the charged-particle multiplicity for pp, p$-$Pb, and Pb$-$Pb collisions at a centre-of-mass energy per nucleon pair of $\sqrt{s_{\rm NN}}$ = 5.02 TeV. Statistical and systematic uncertainties are shown as bars and semi-transparent bands, respectively. | 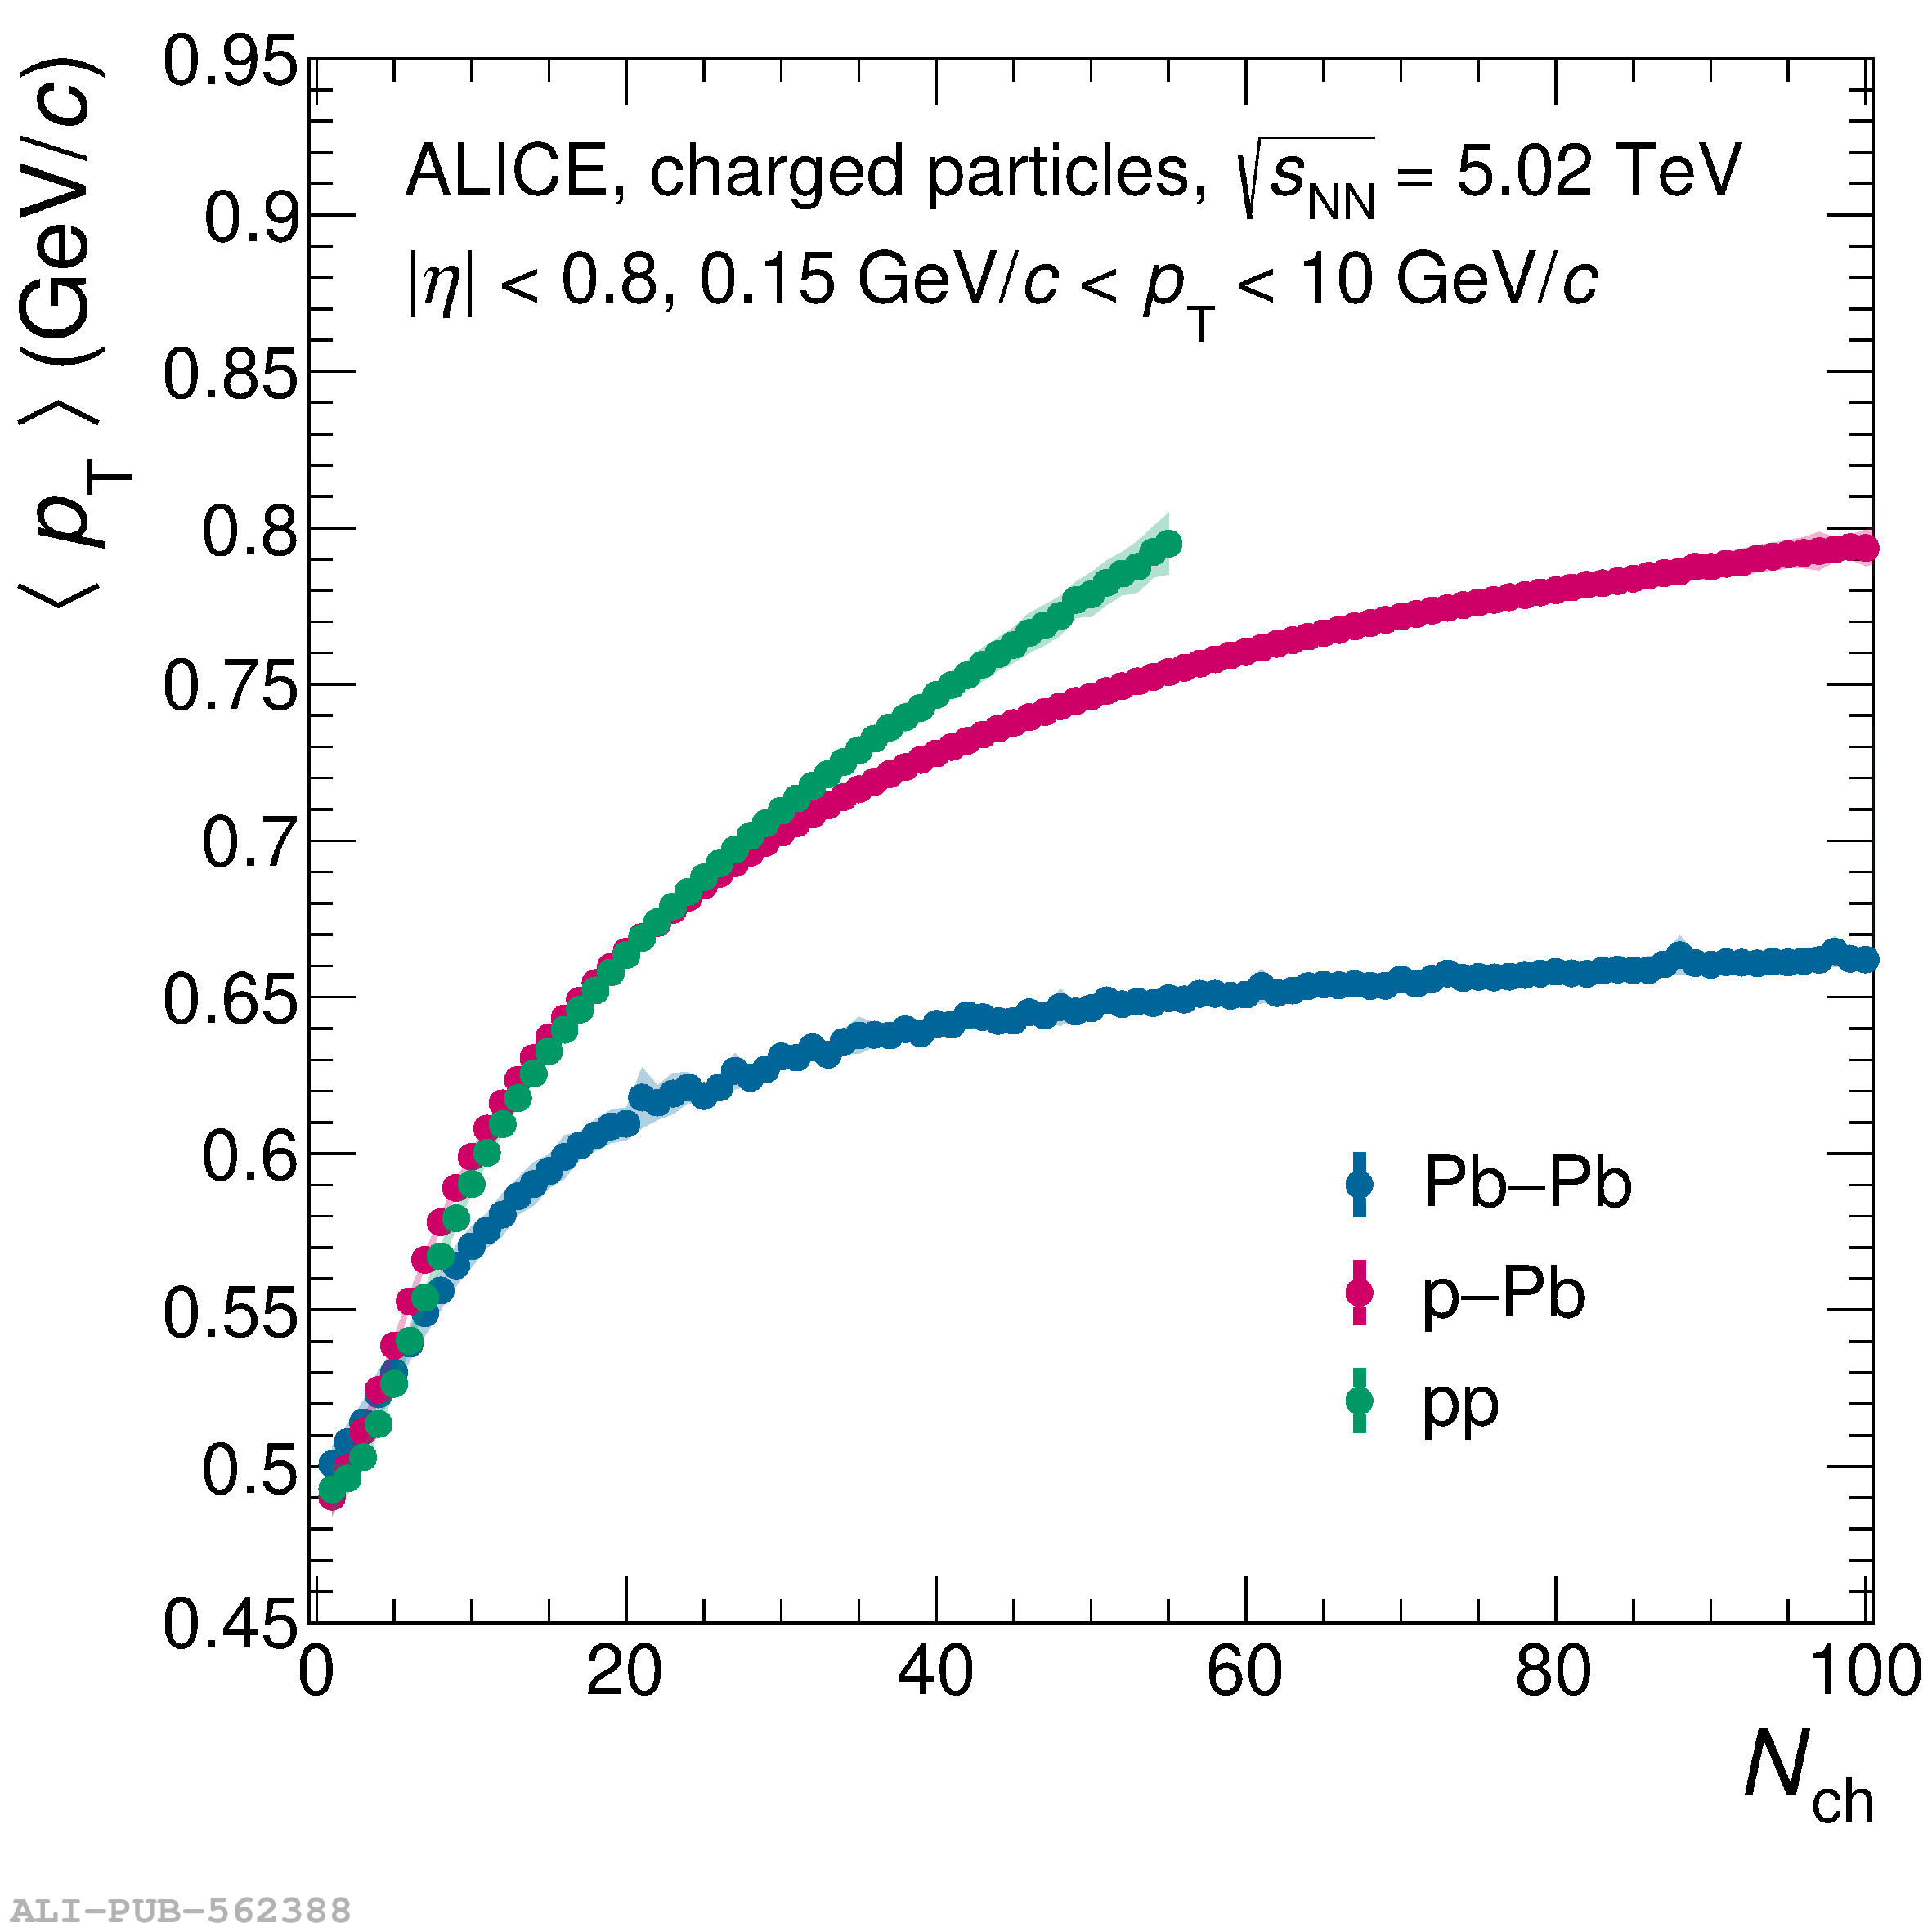  |
Figure 7
Mean (left) and standard deviation (right) of the charged-particle transverse momentum spectra as a function of the charged-particle multiplicity for pp (top), p$-$Pb (middle), and AA (bottom) collisions at different centre-of-mass energies per nucleon pair. Statistical and systematic uncertainties are shown as bars and semi-transparent bands, respectively. | 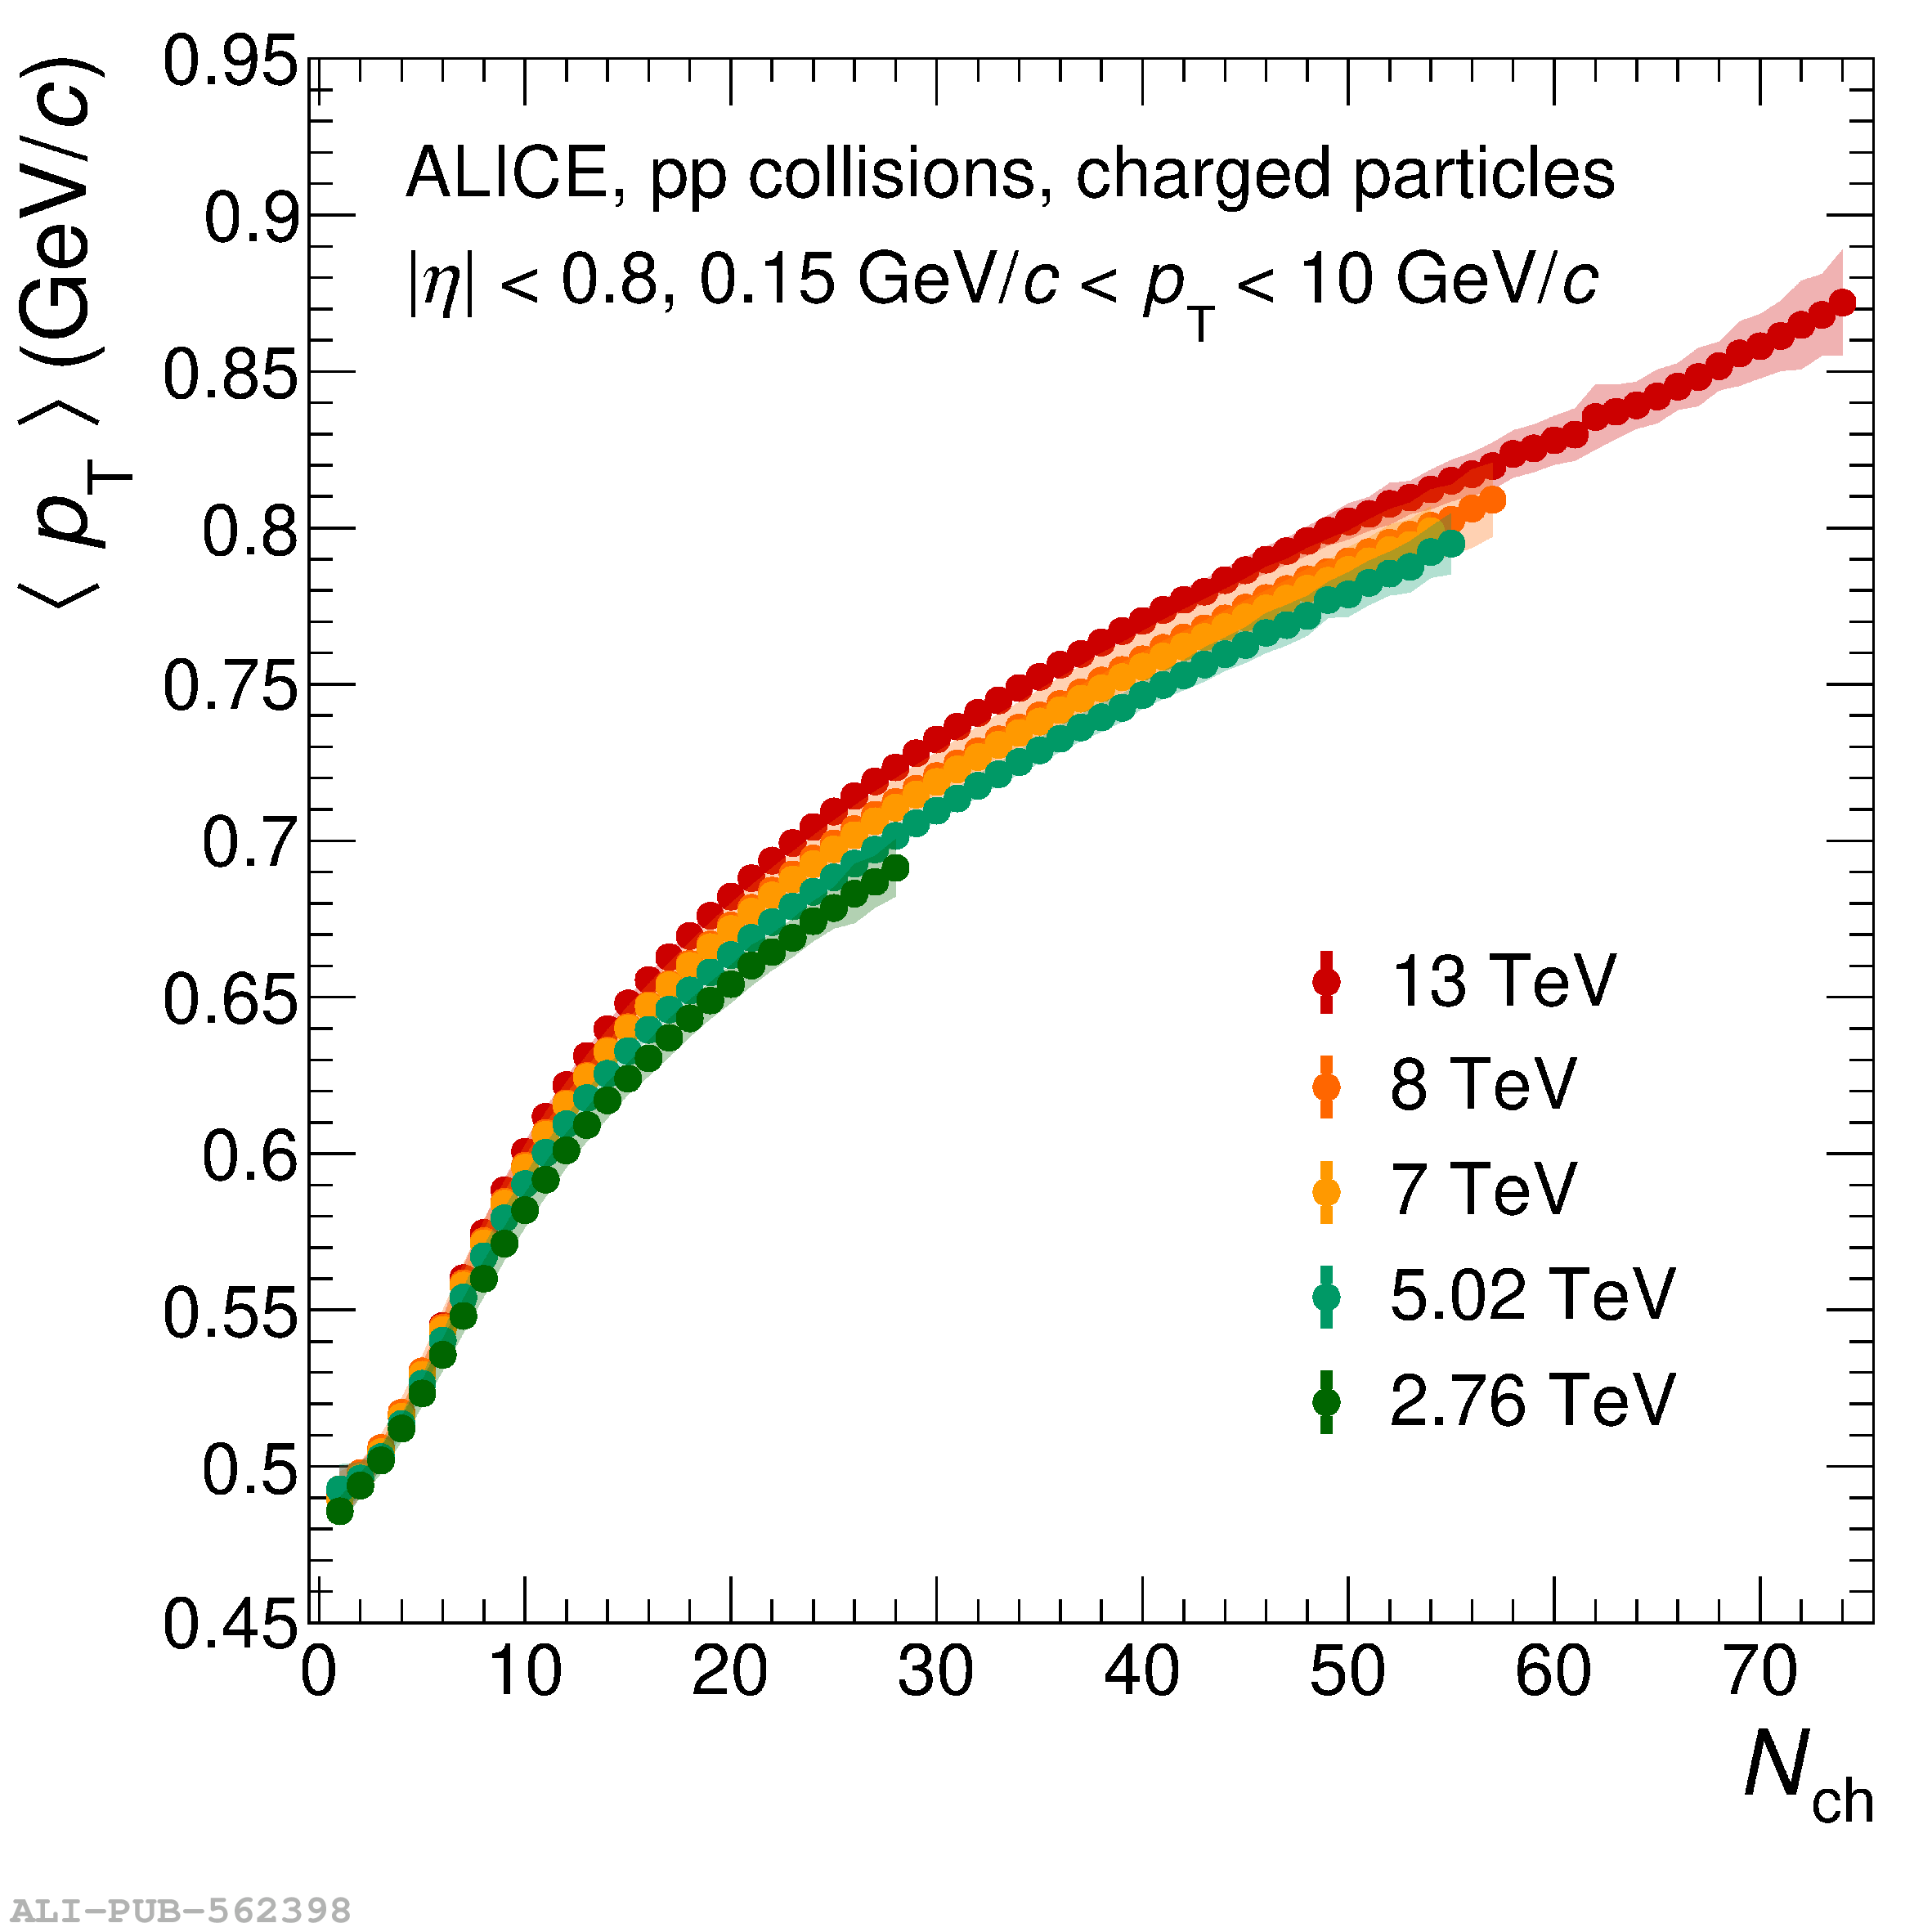 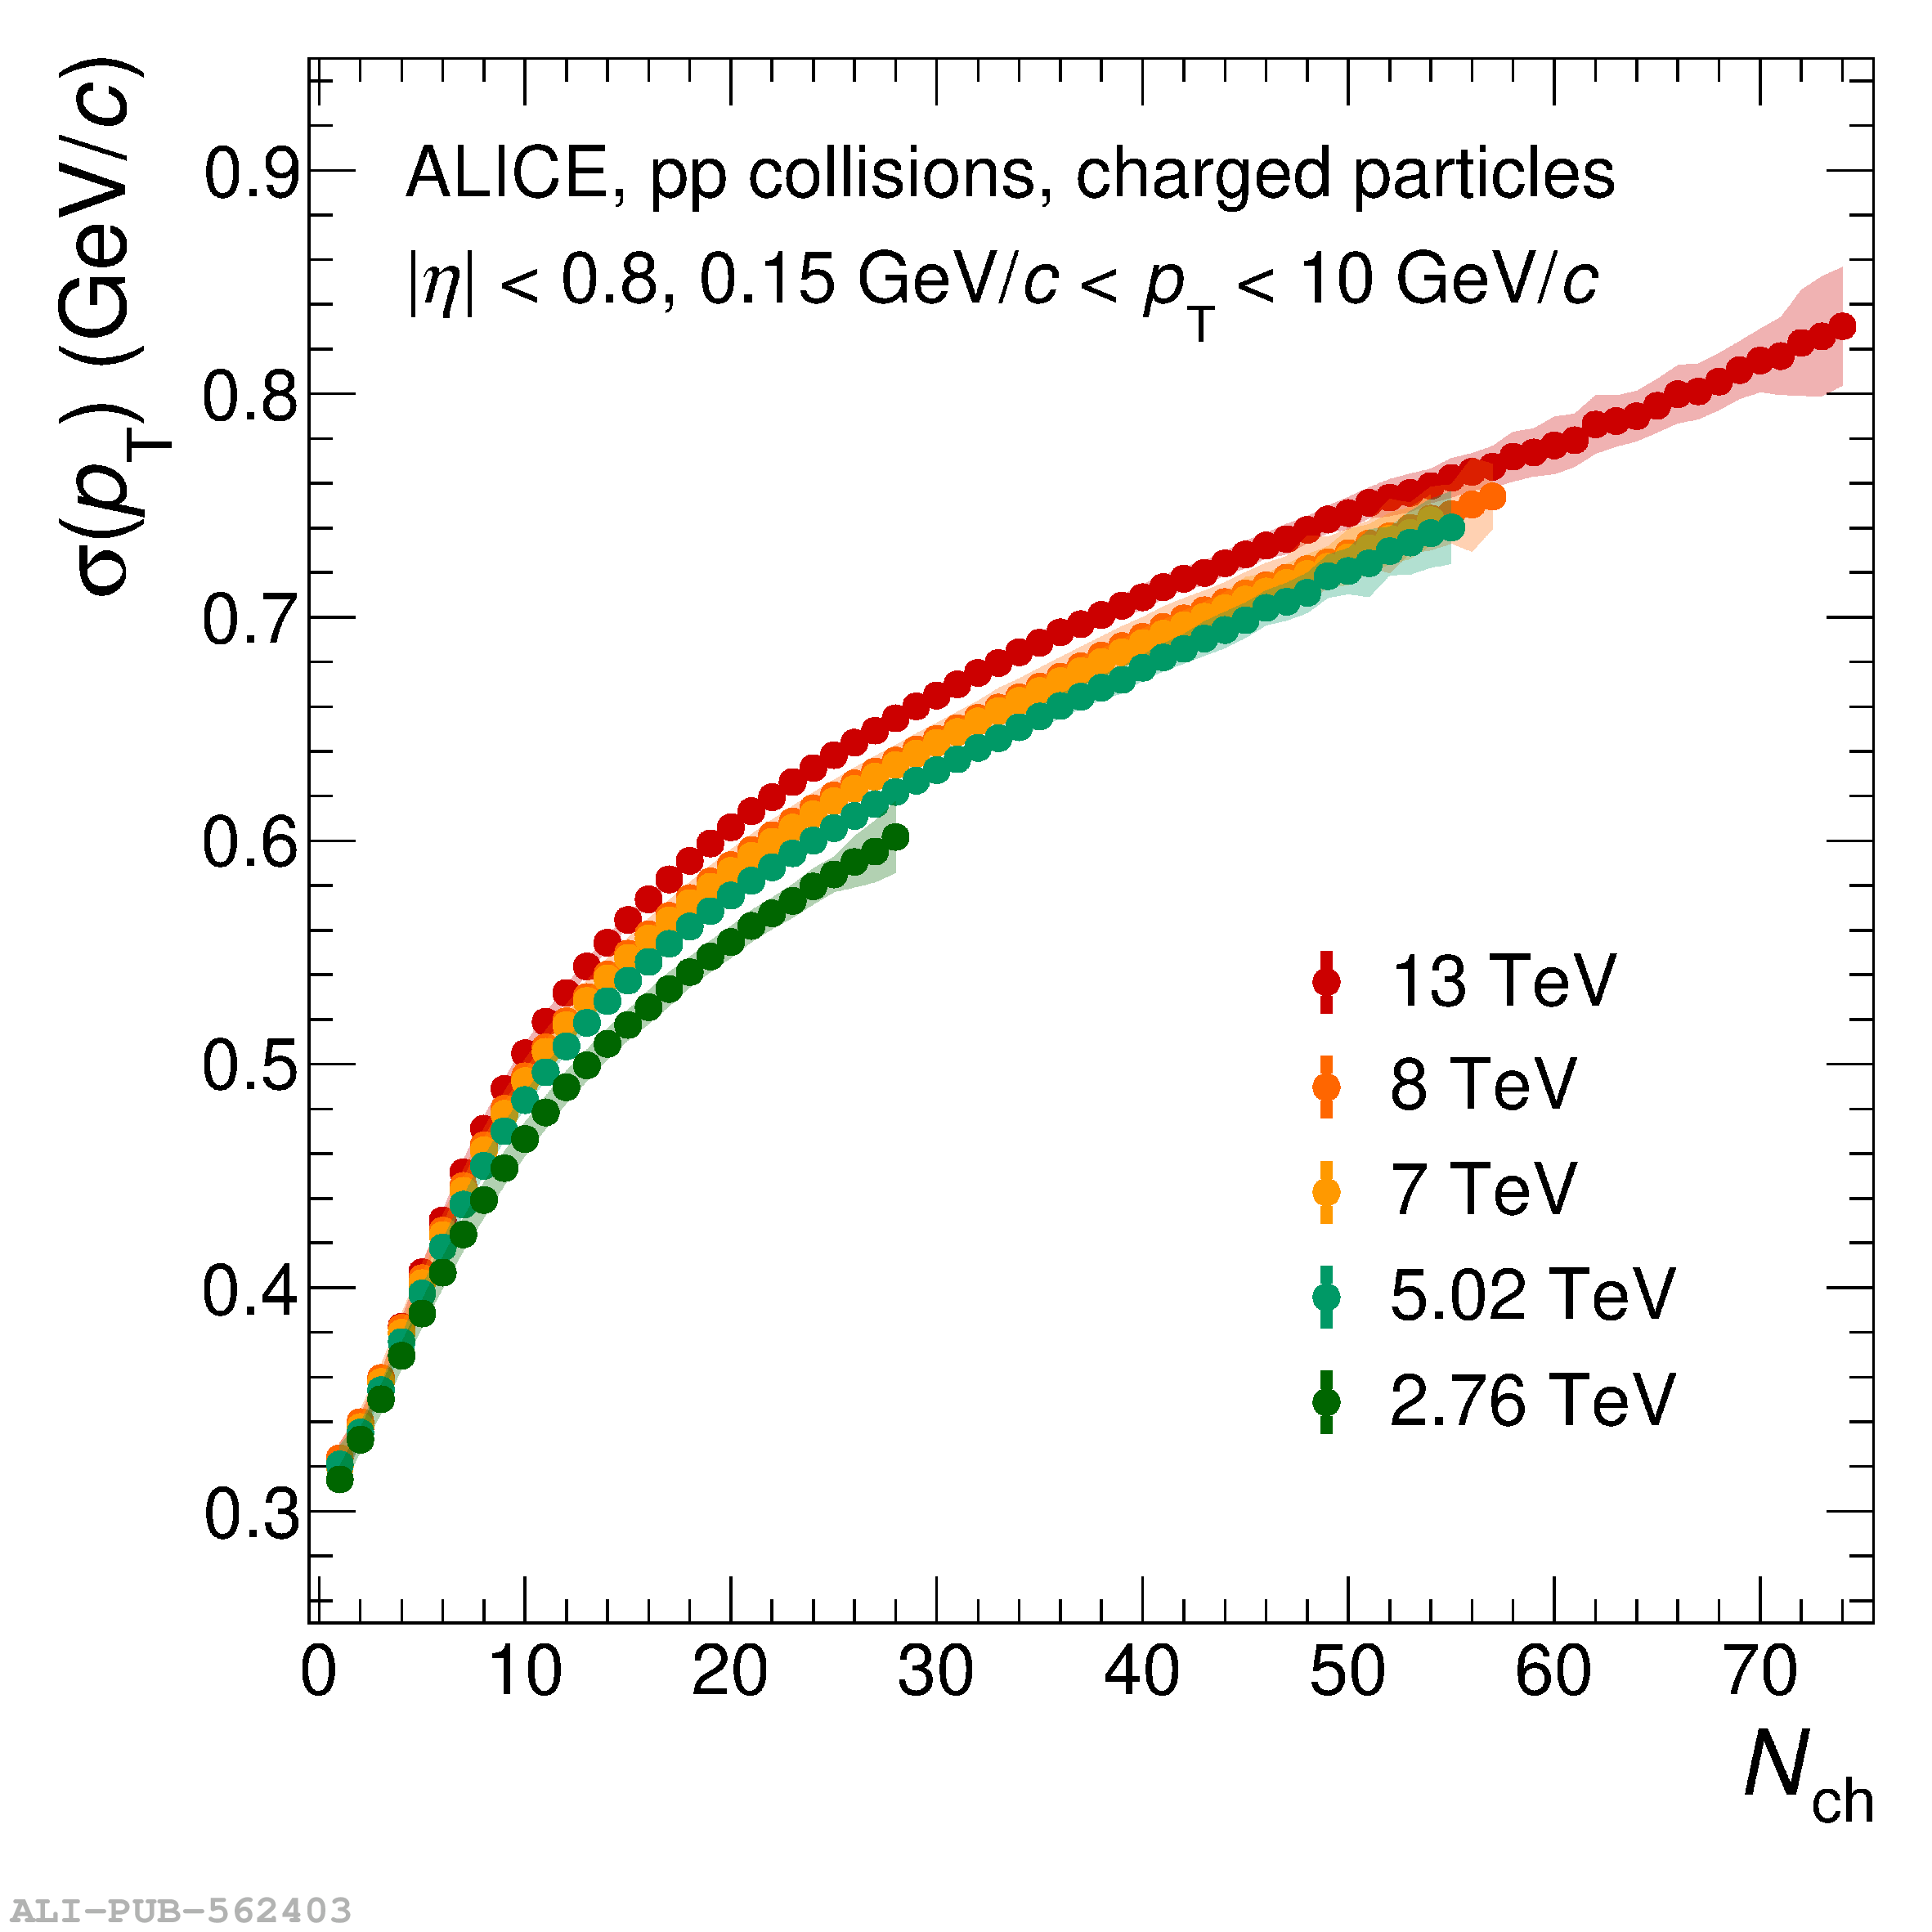 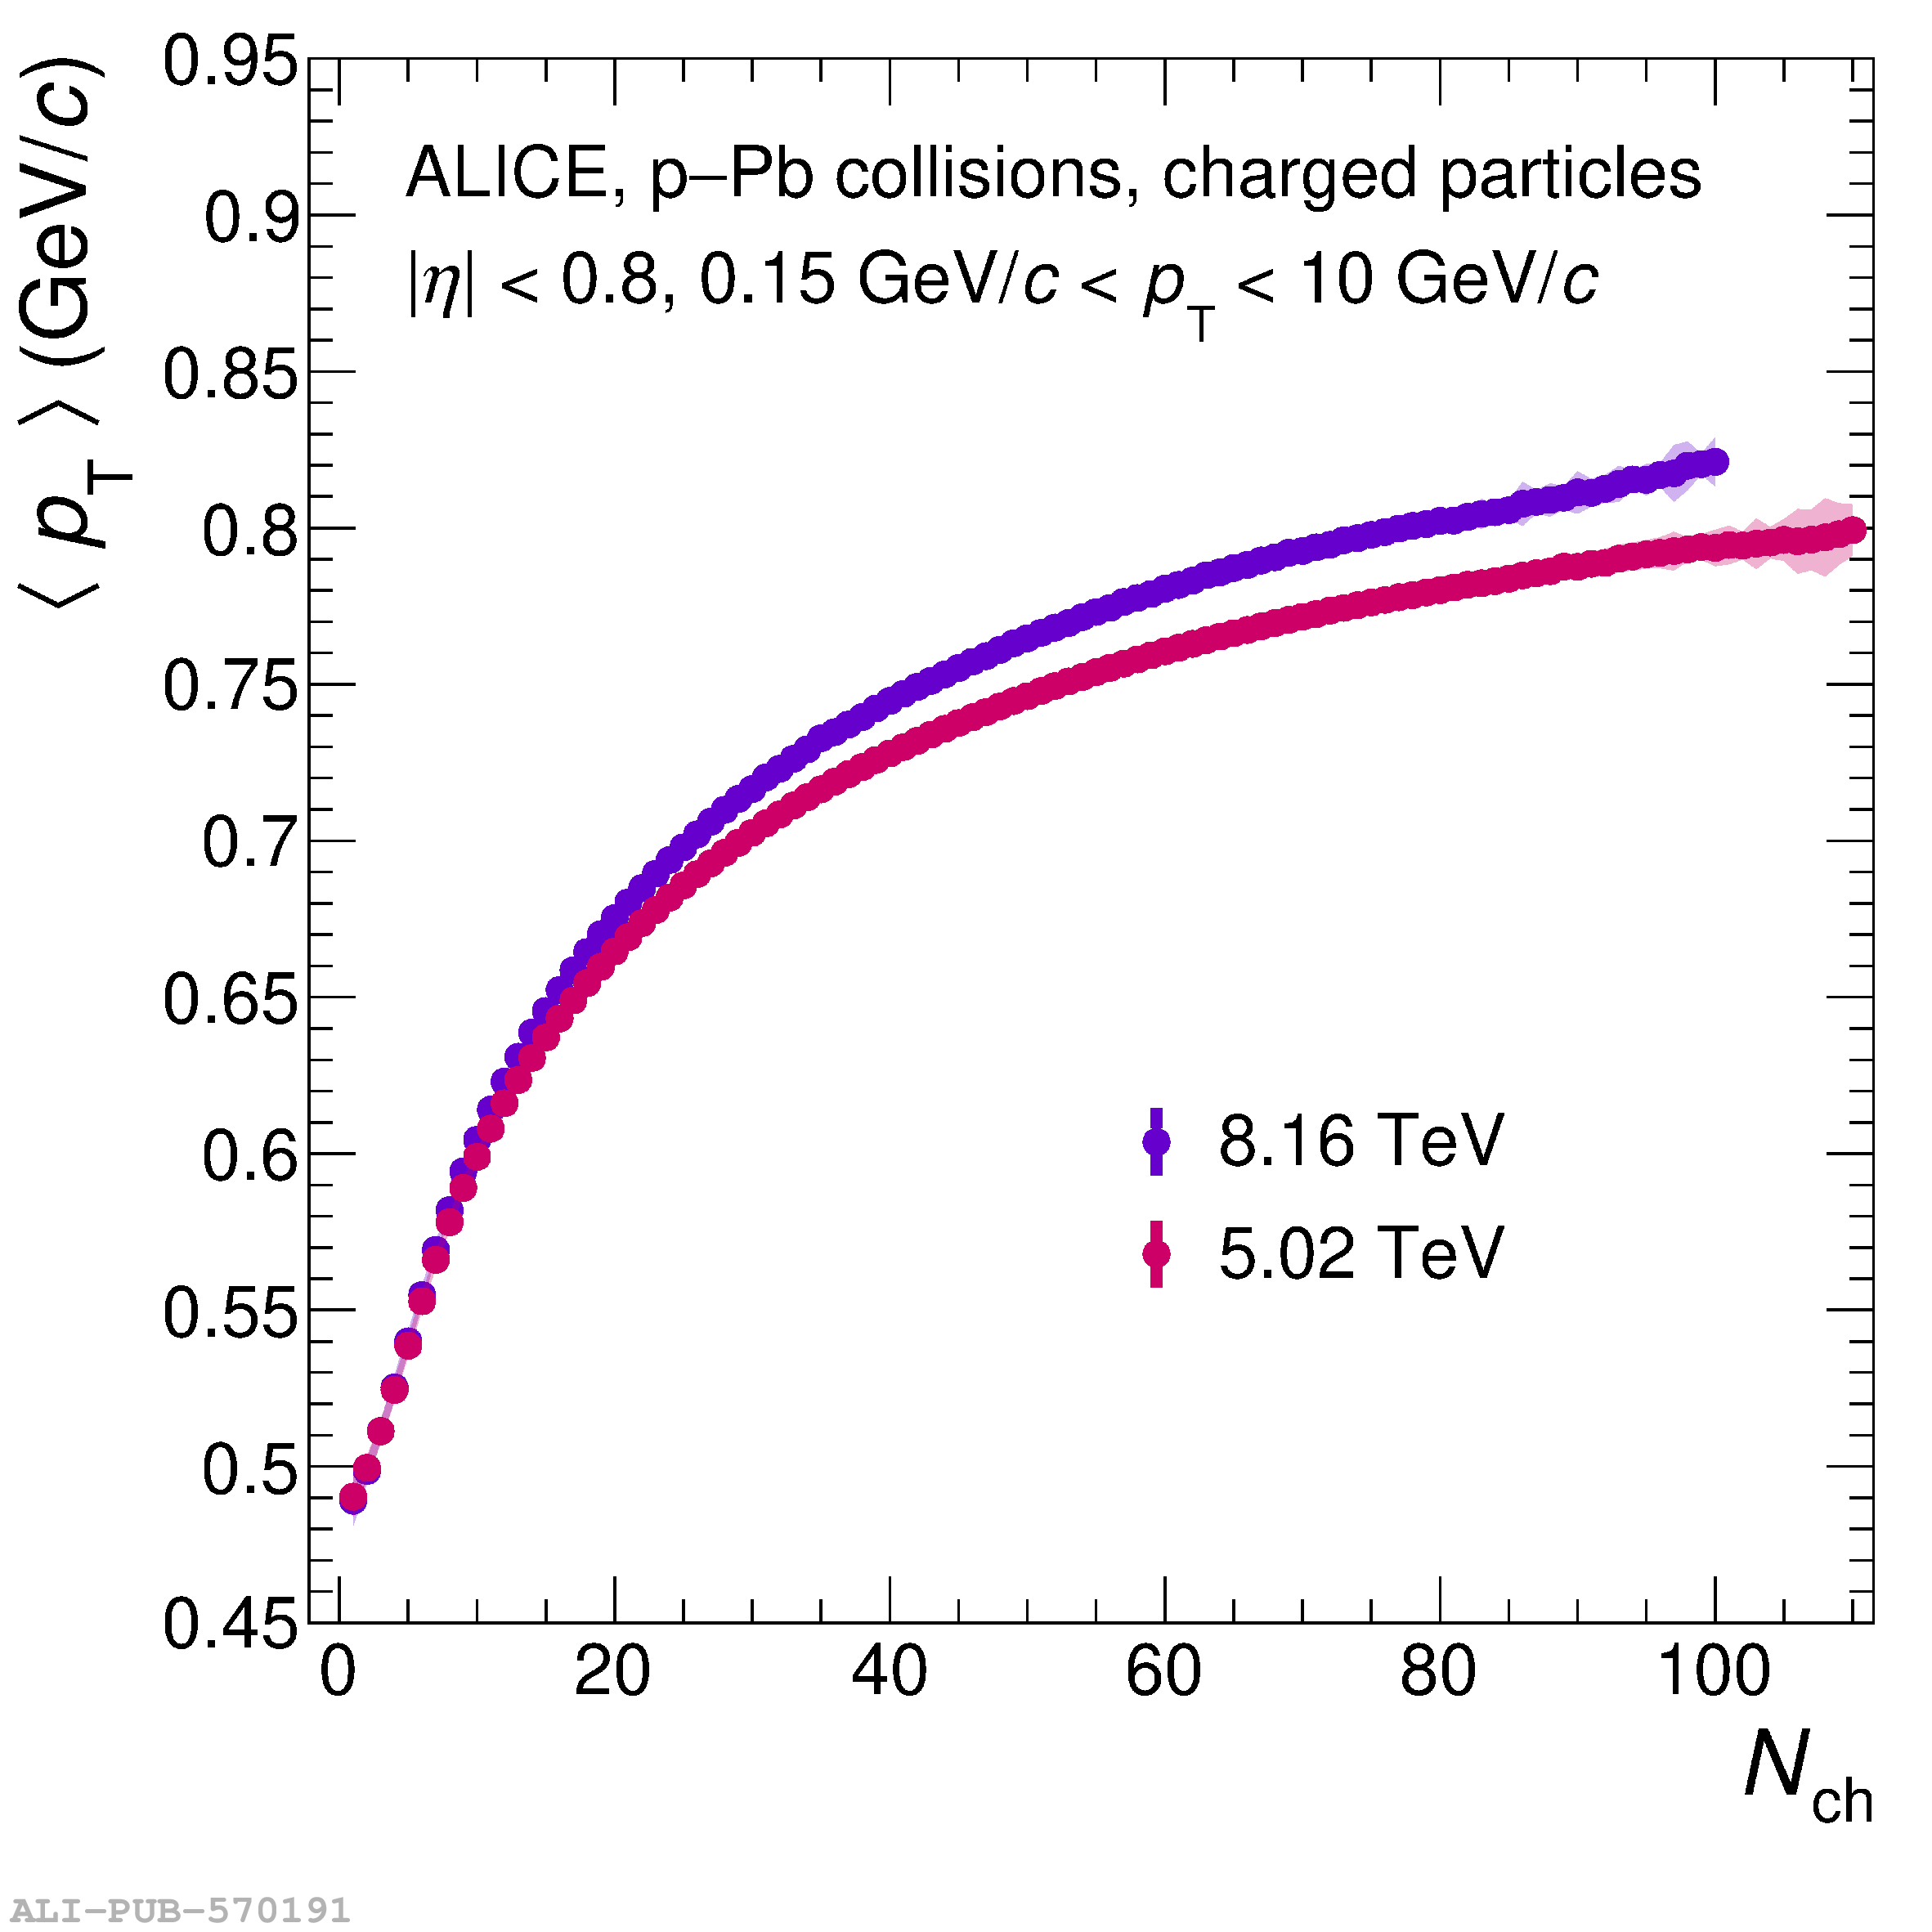 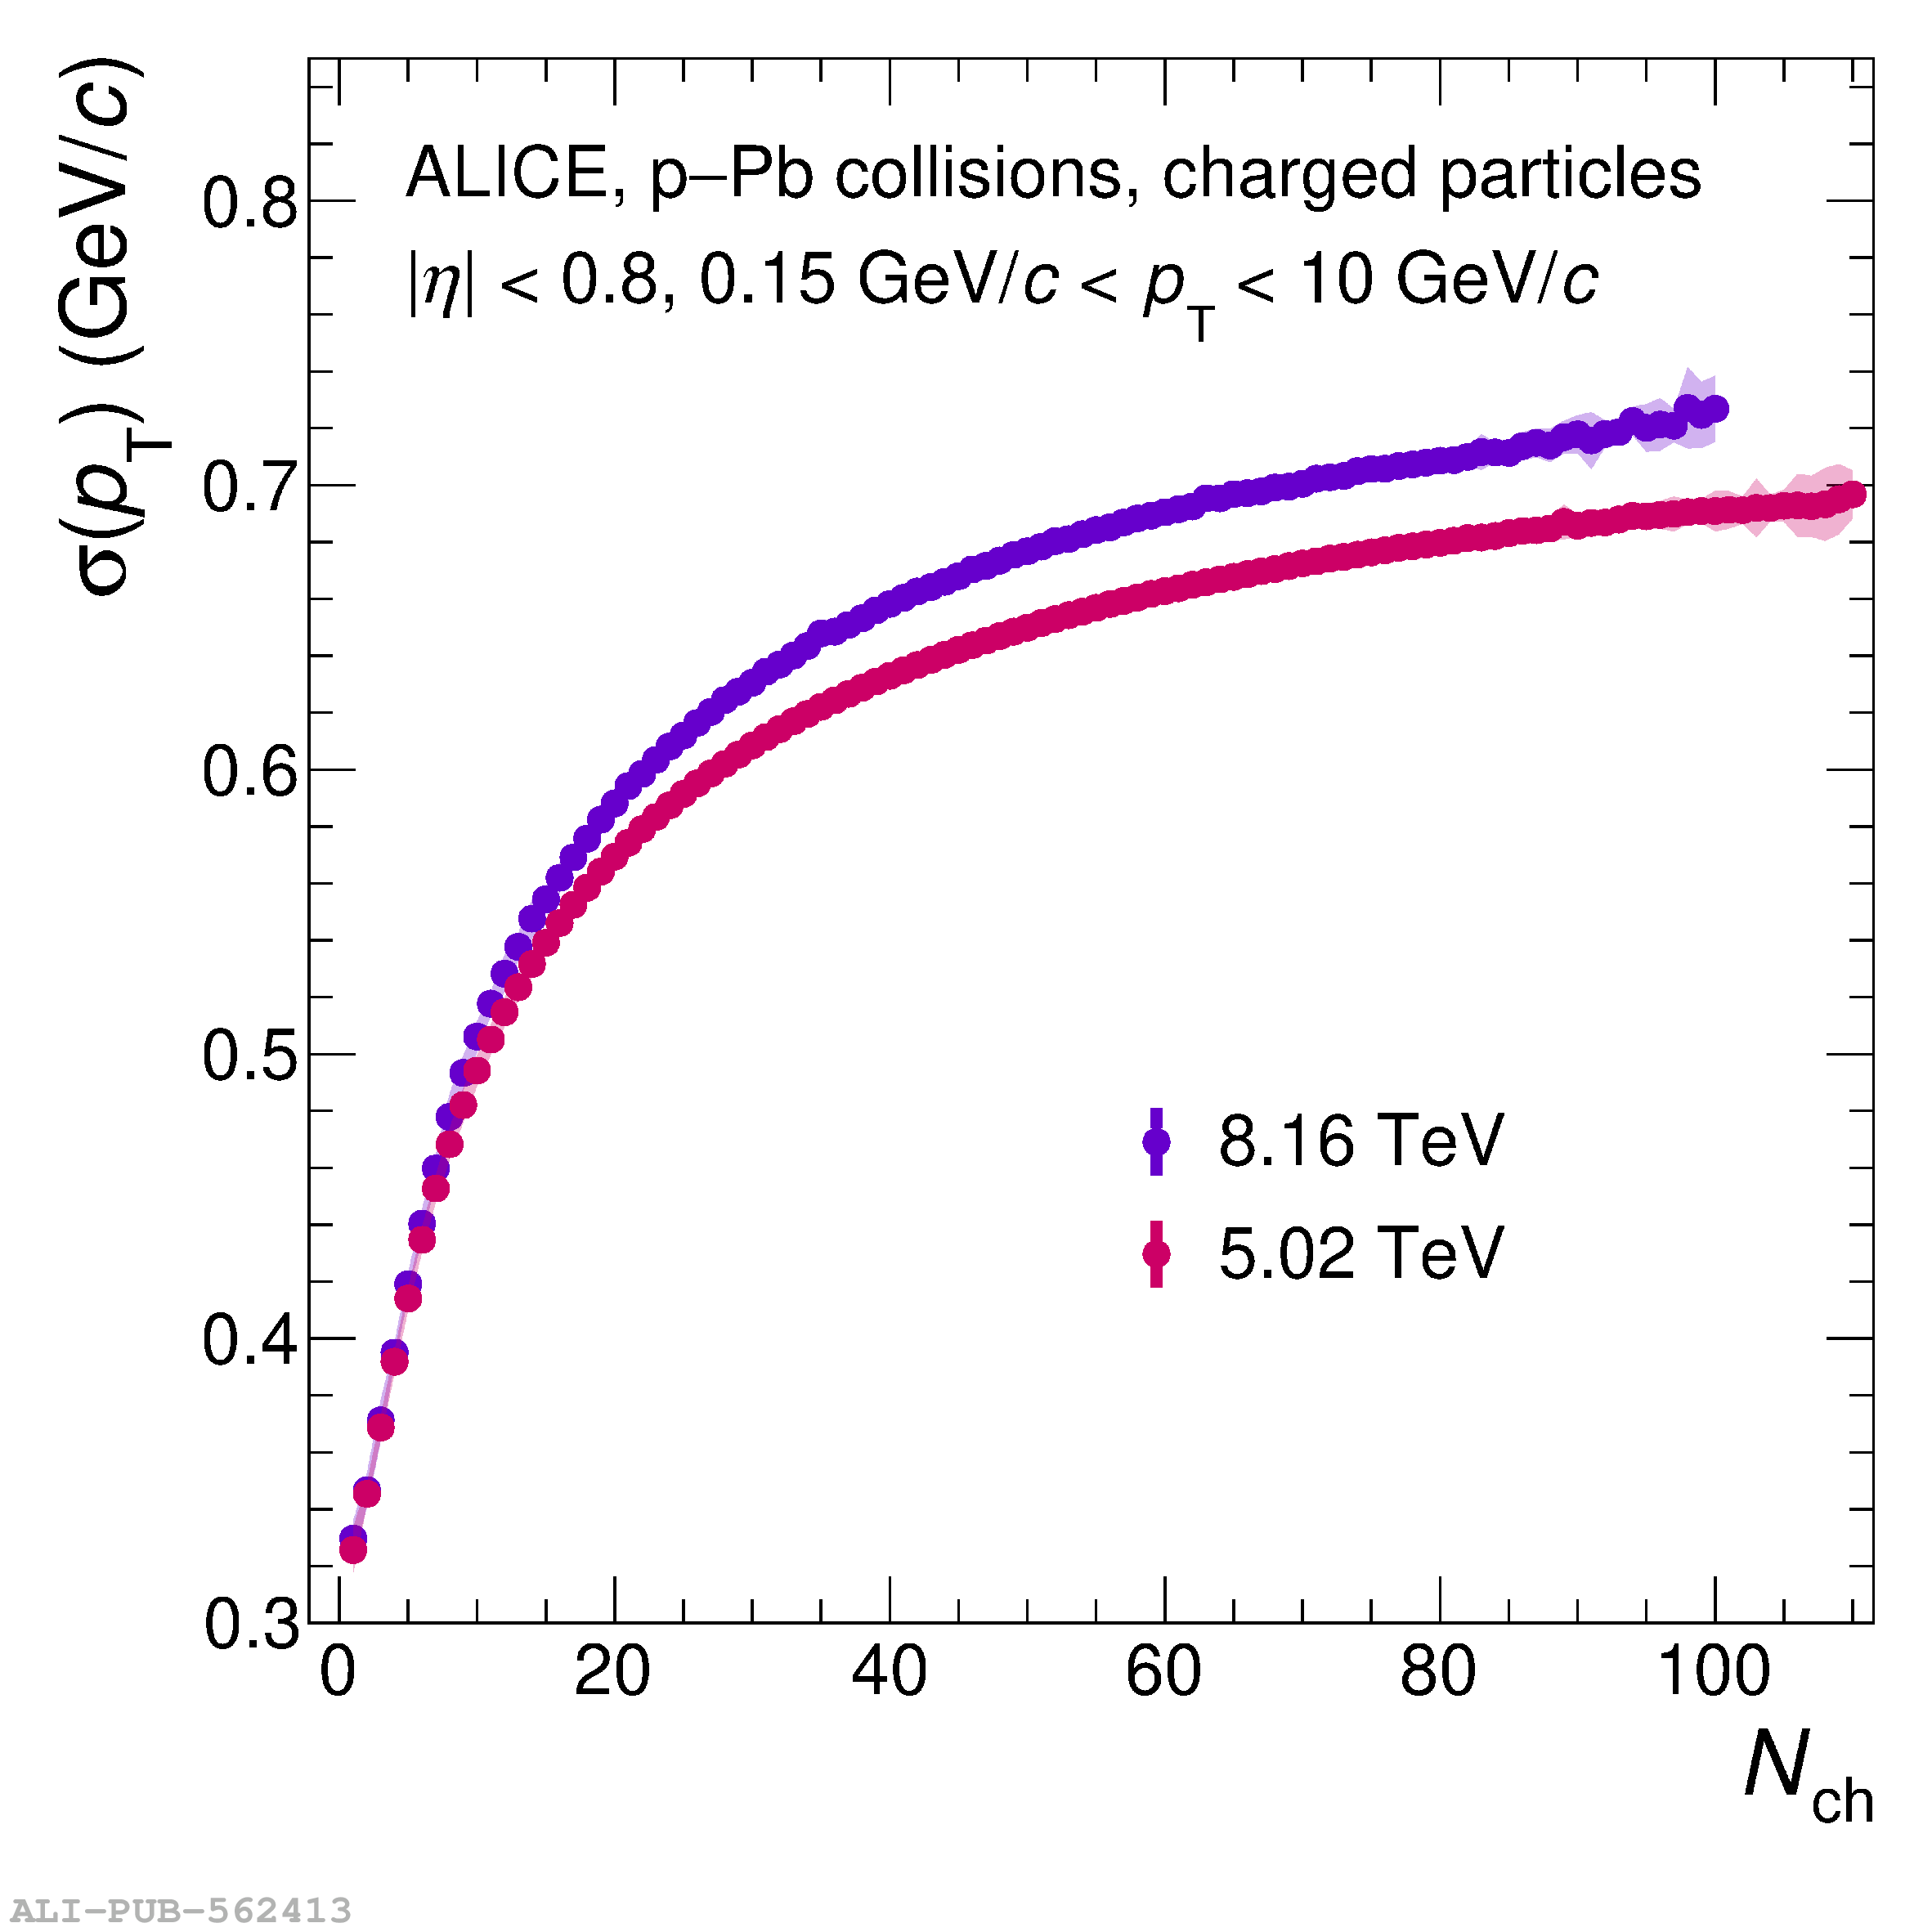  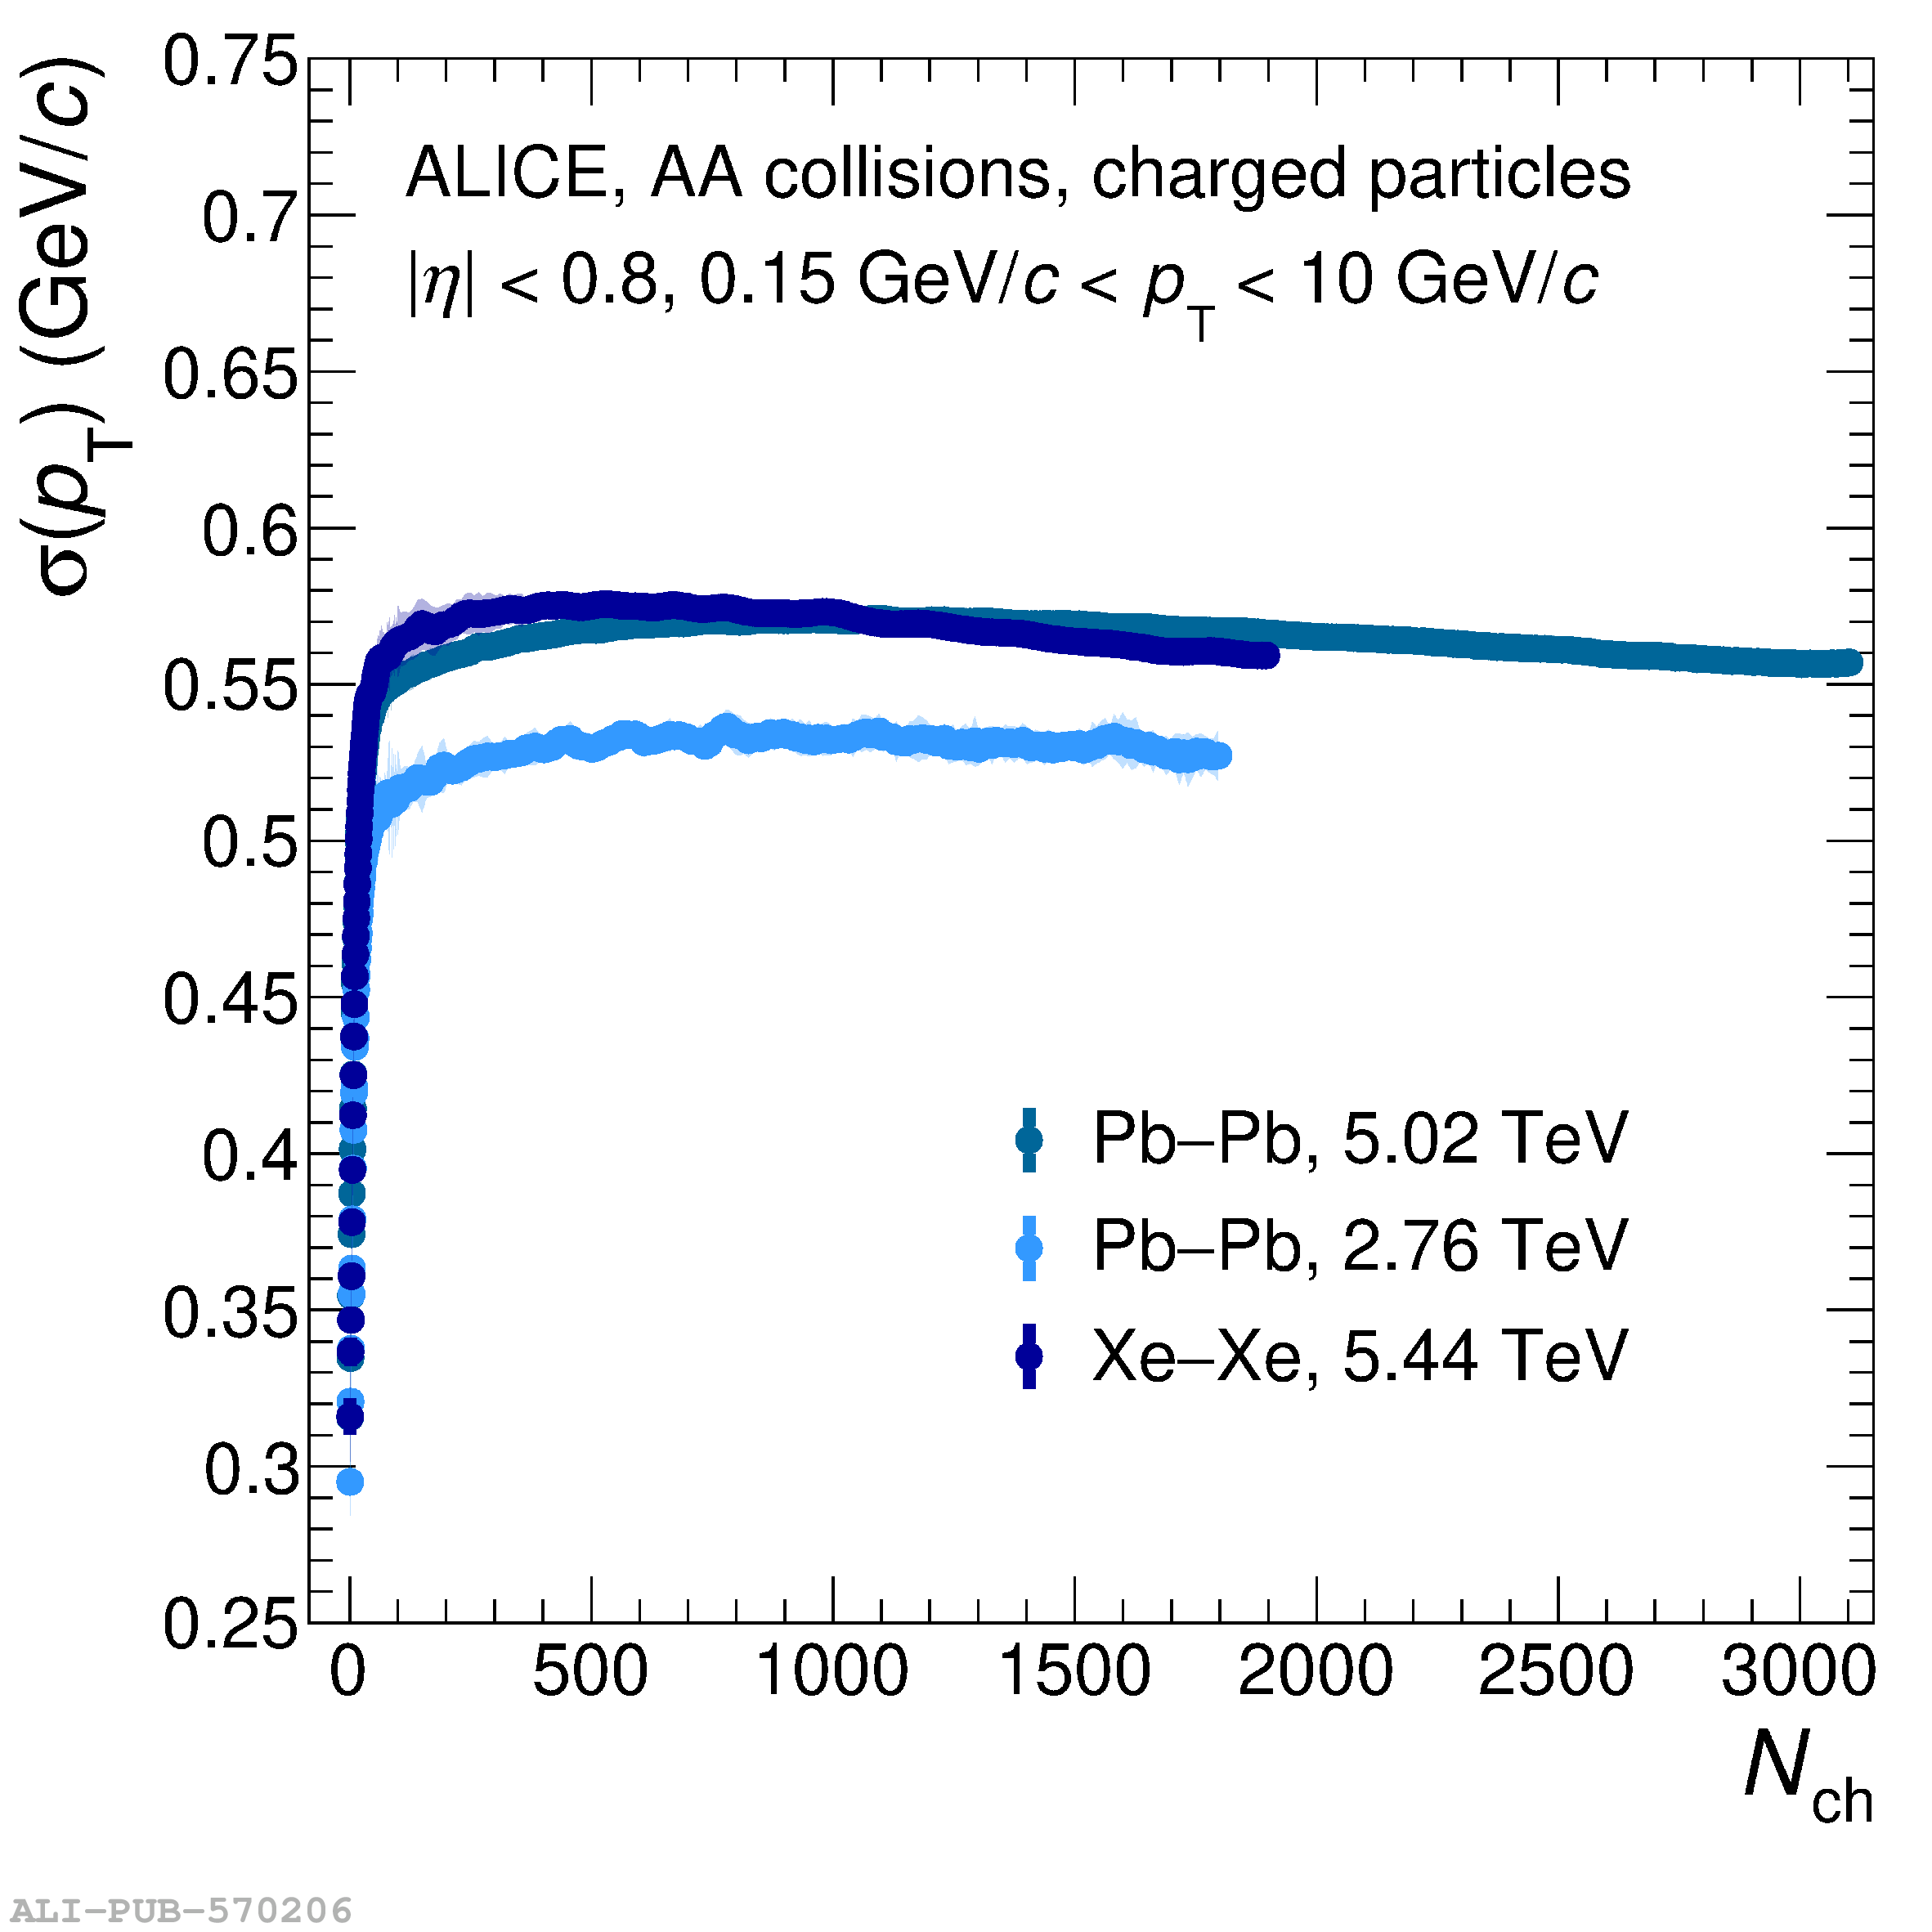 |
Figure 8
Mean (left) and standard deviation (right) of the charged-particle transverse momentum spectra as a function of the charged-particle multiplicity (top) and relative multiplicity $\nch / \langle \nch \rangle$ (middle, bottom) for pp, p$-$Pb, Xe$-$Xe and Pb$-$Pb collisions at various centre-of-mass energies per nucleon pair. The bottom panels show both quantities relative to their multiplicity-inclusive value. Statistical and systematic uncertainties are shown as bars and semi-transparent bands, respectively. |  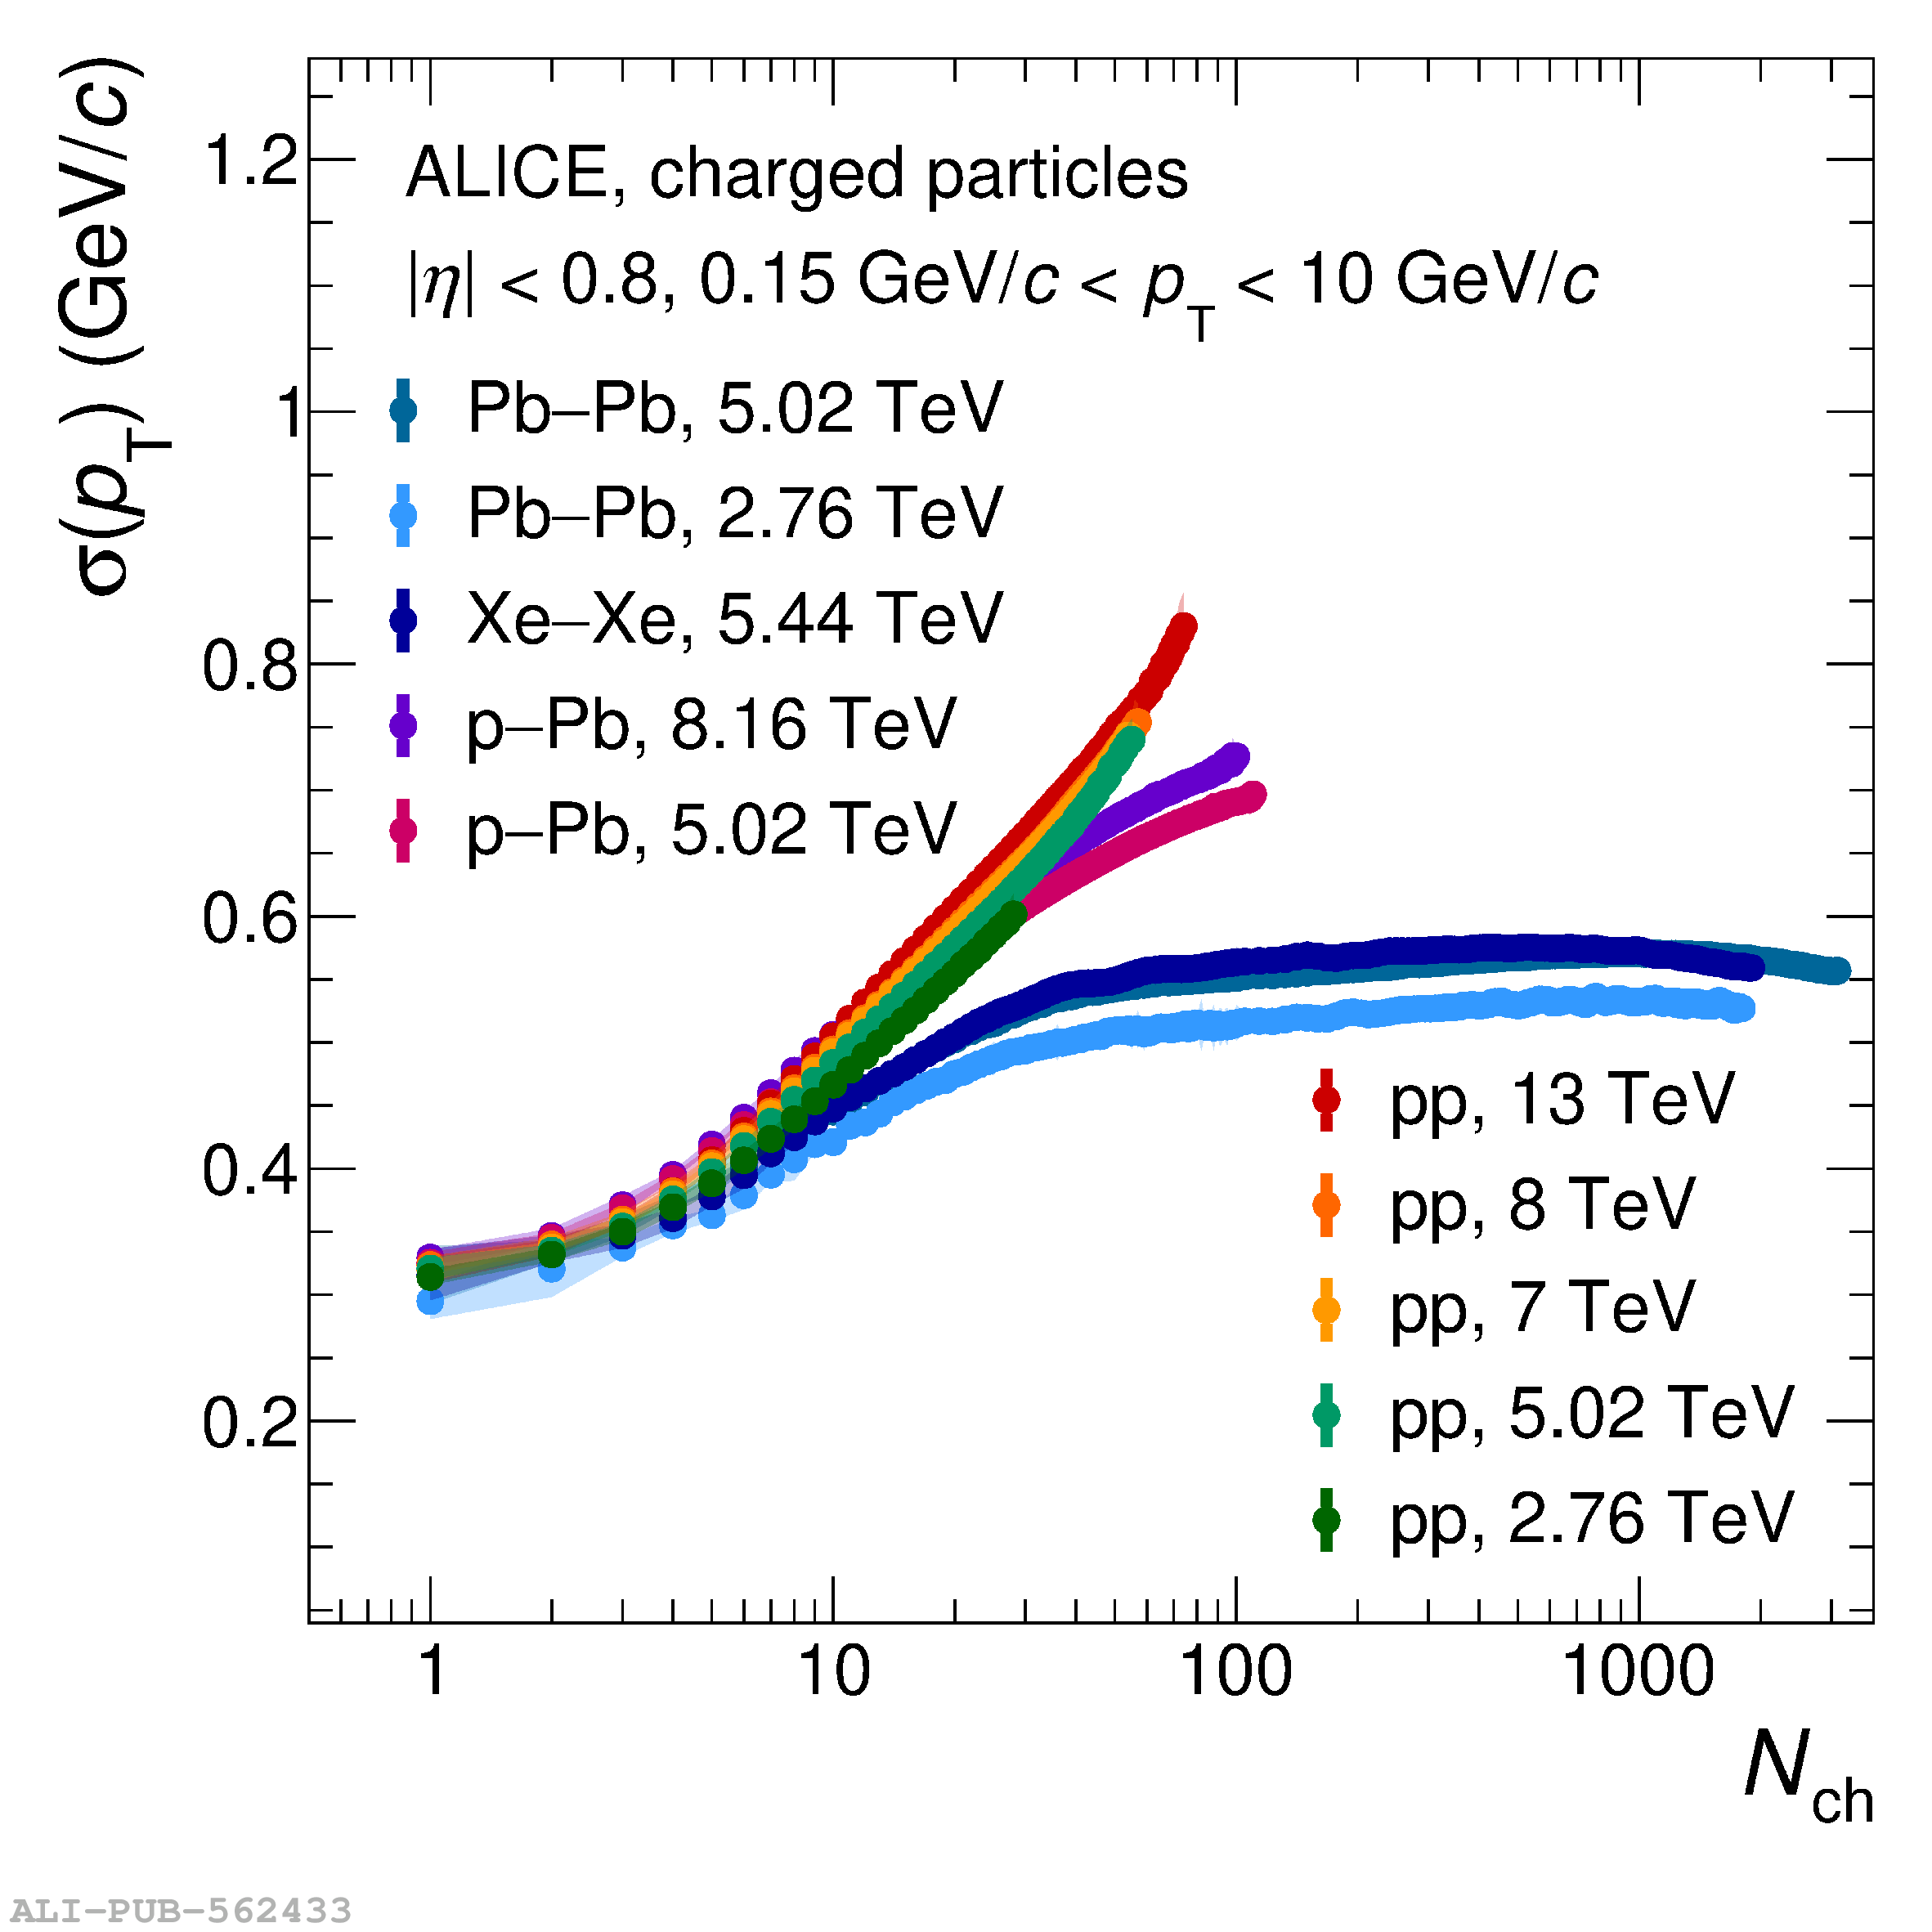 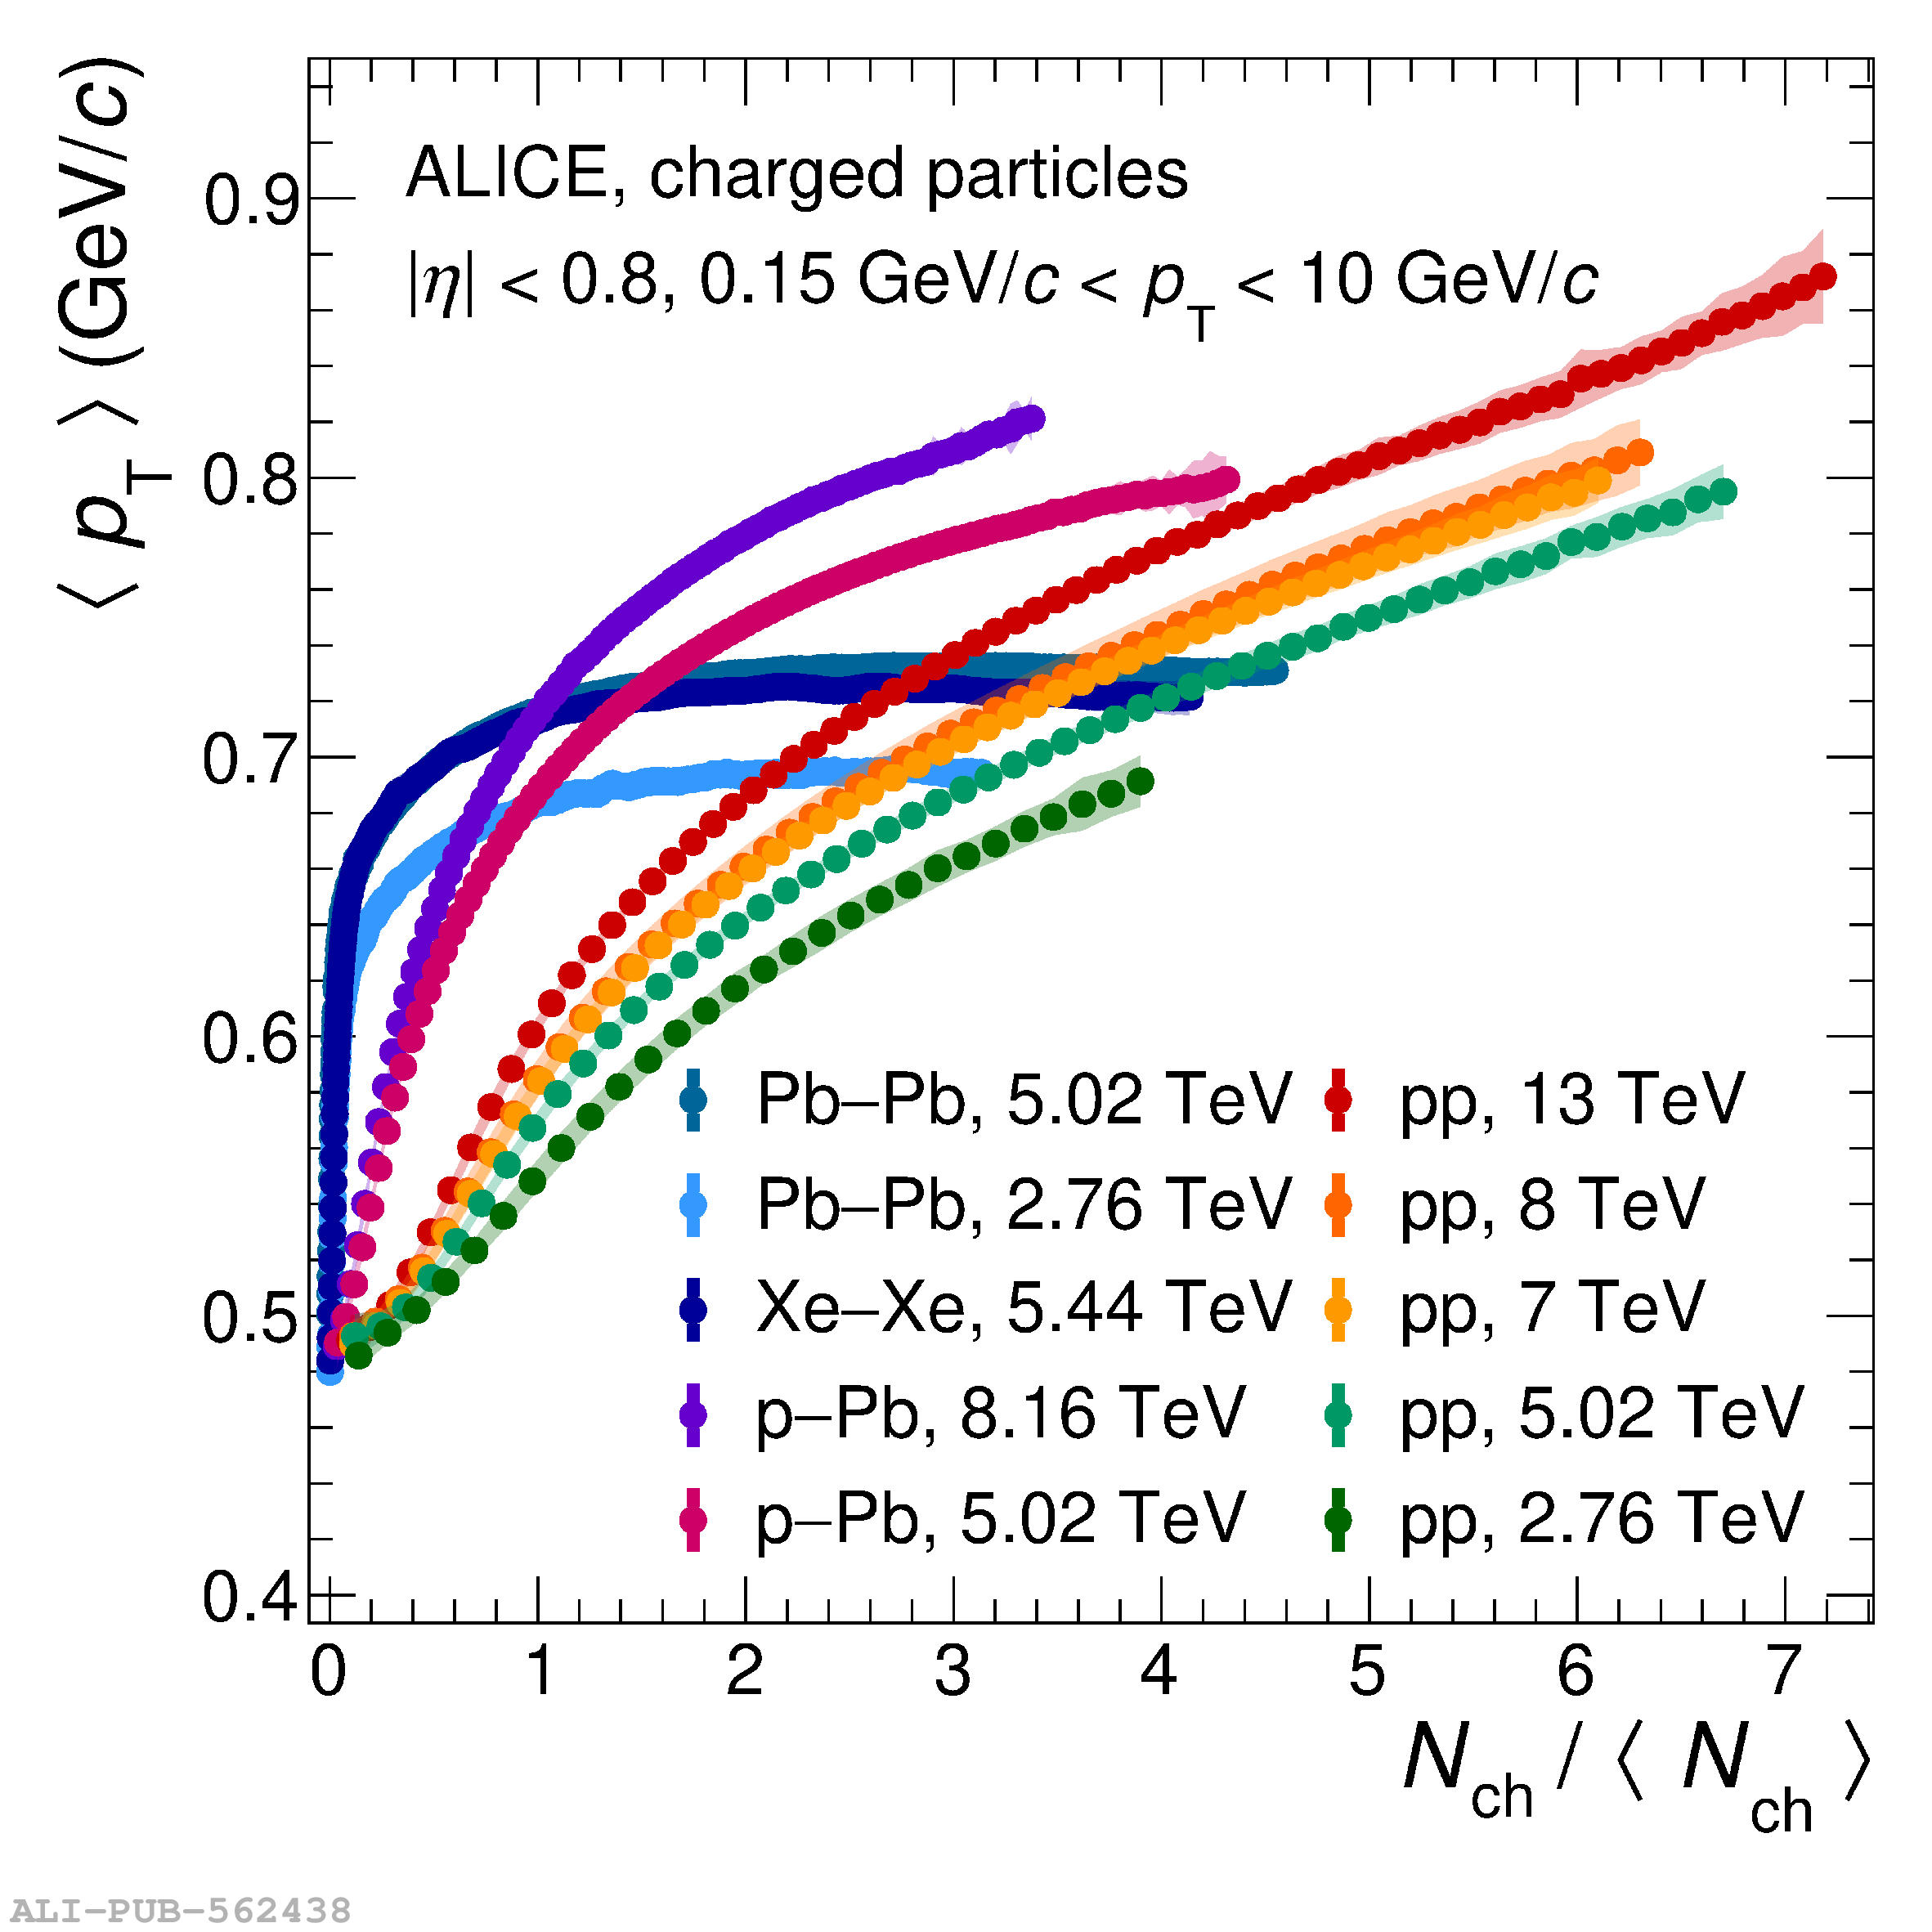 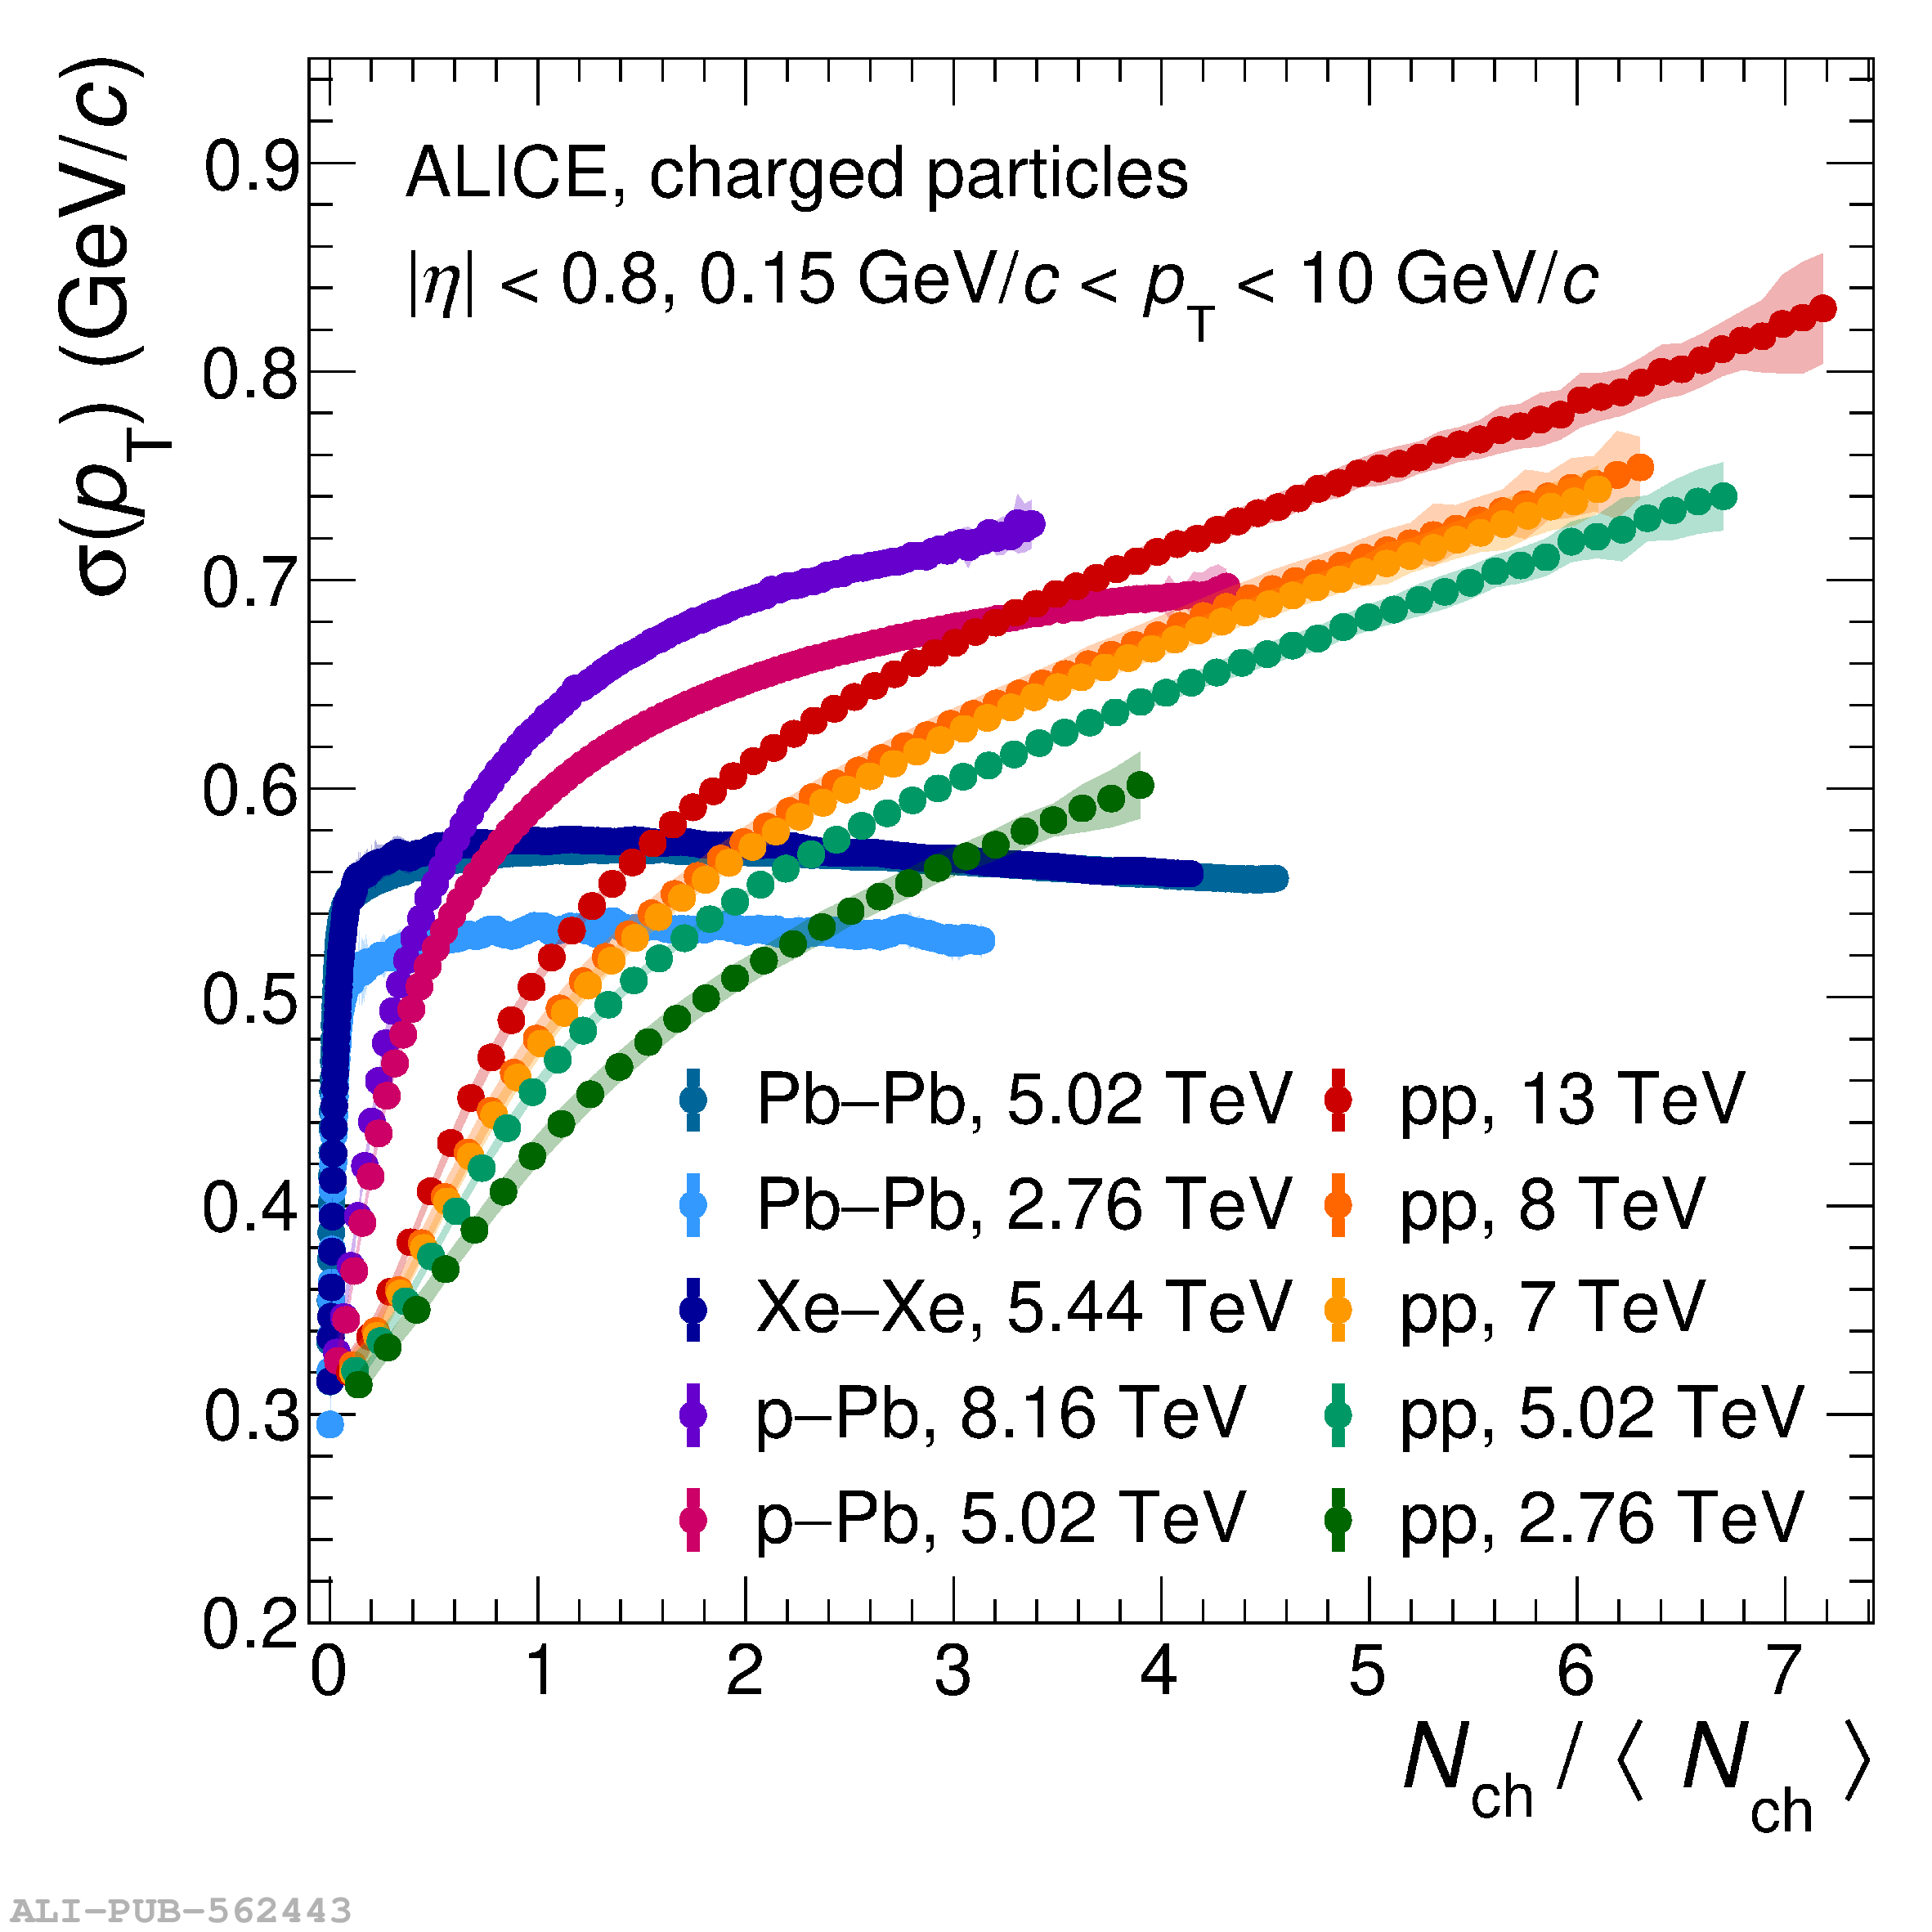 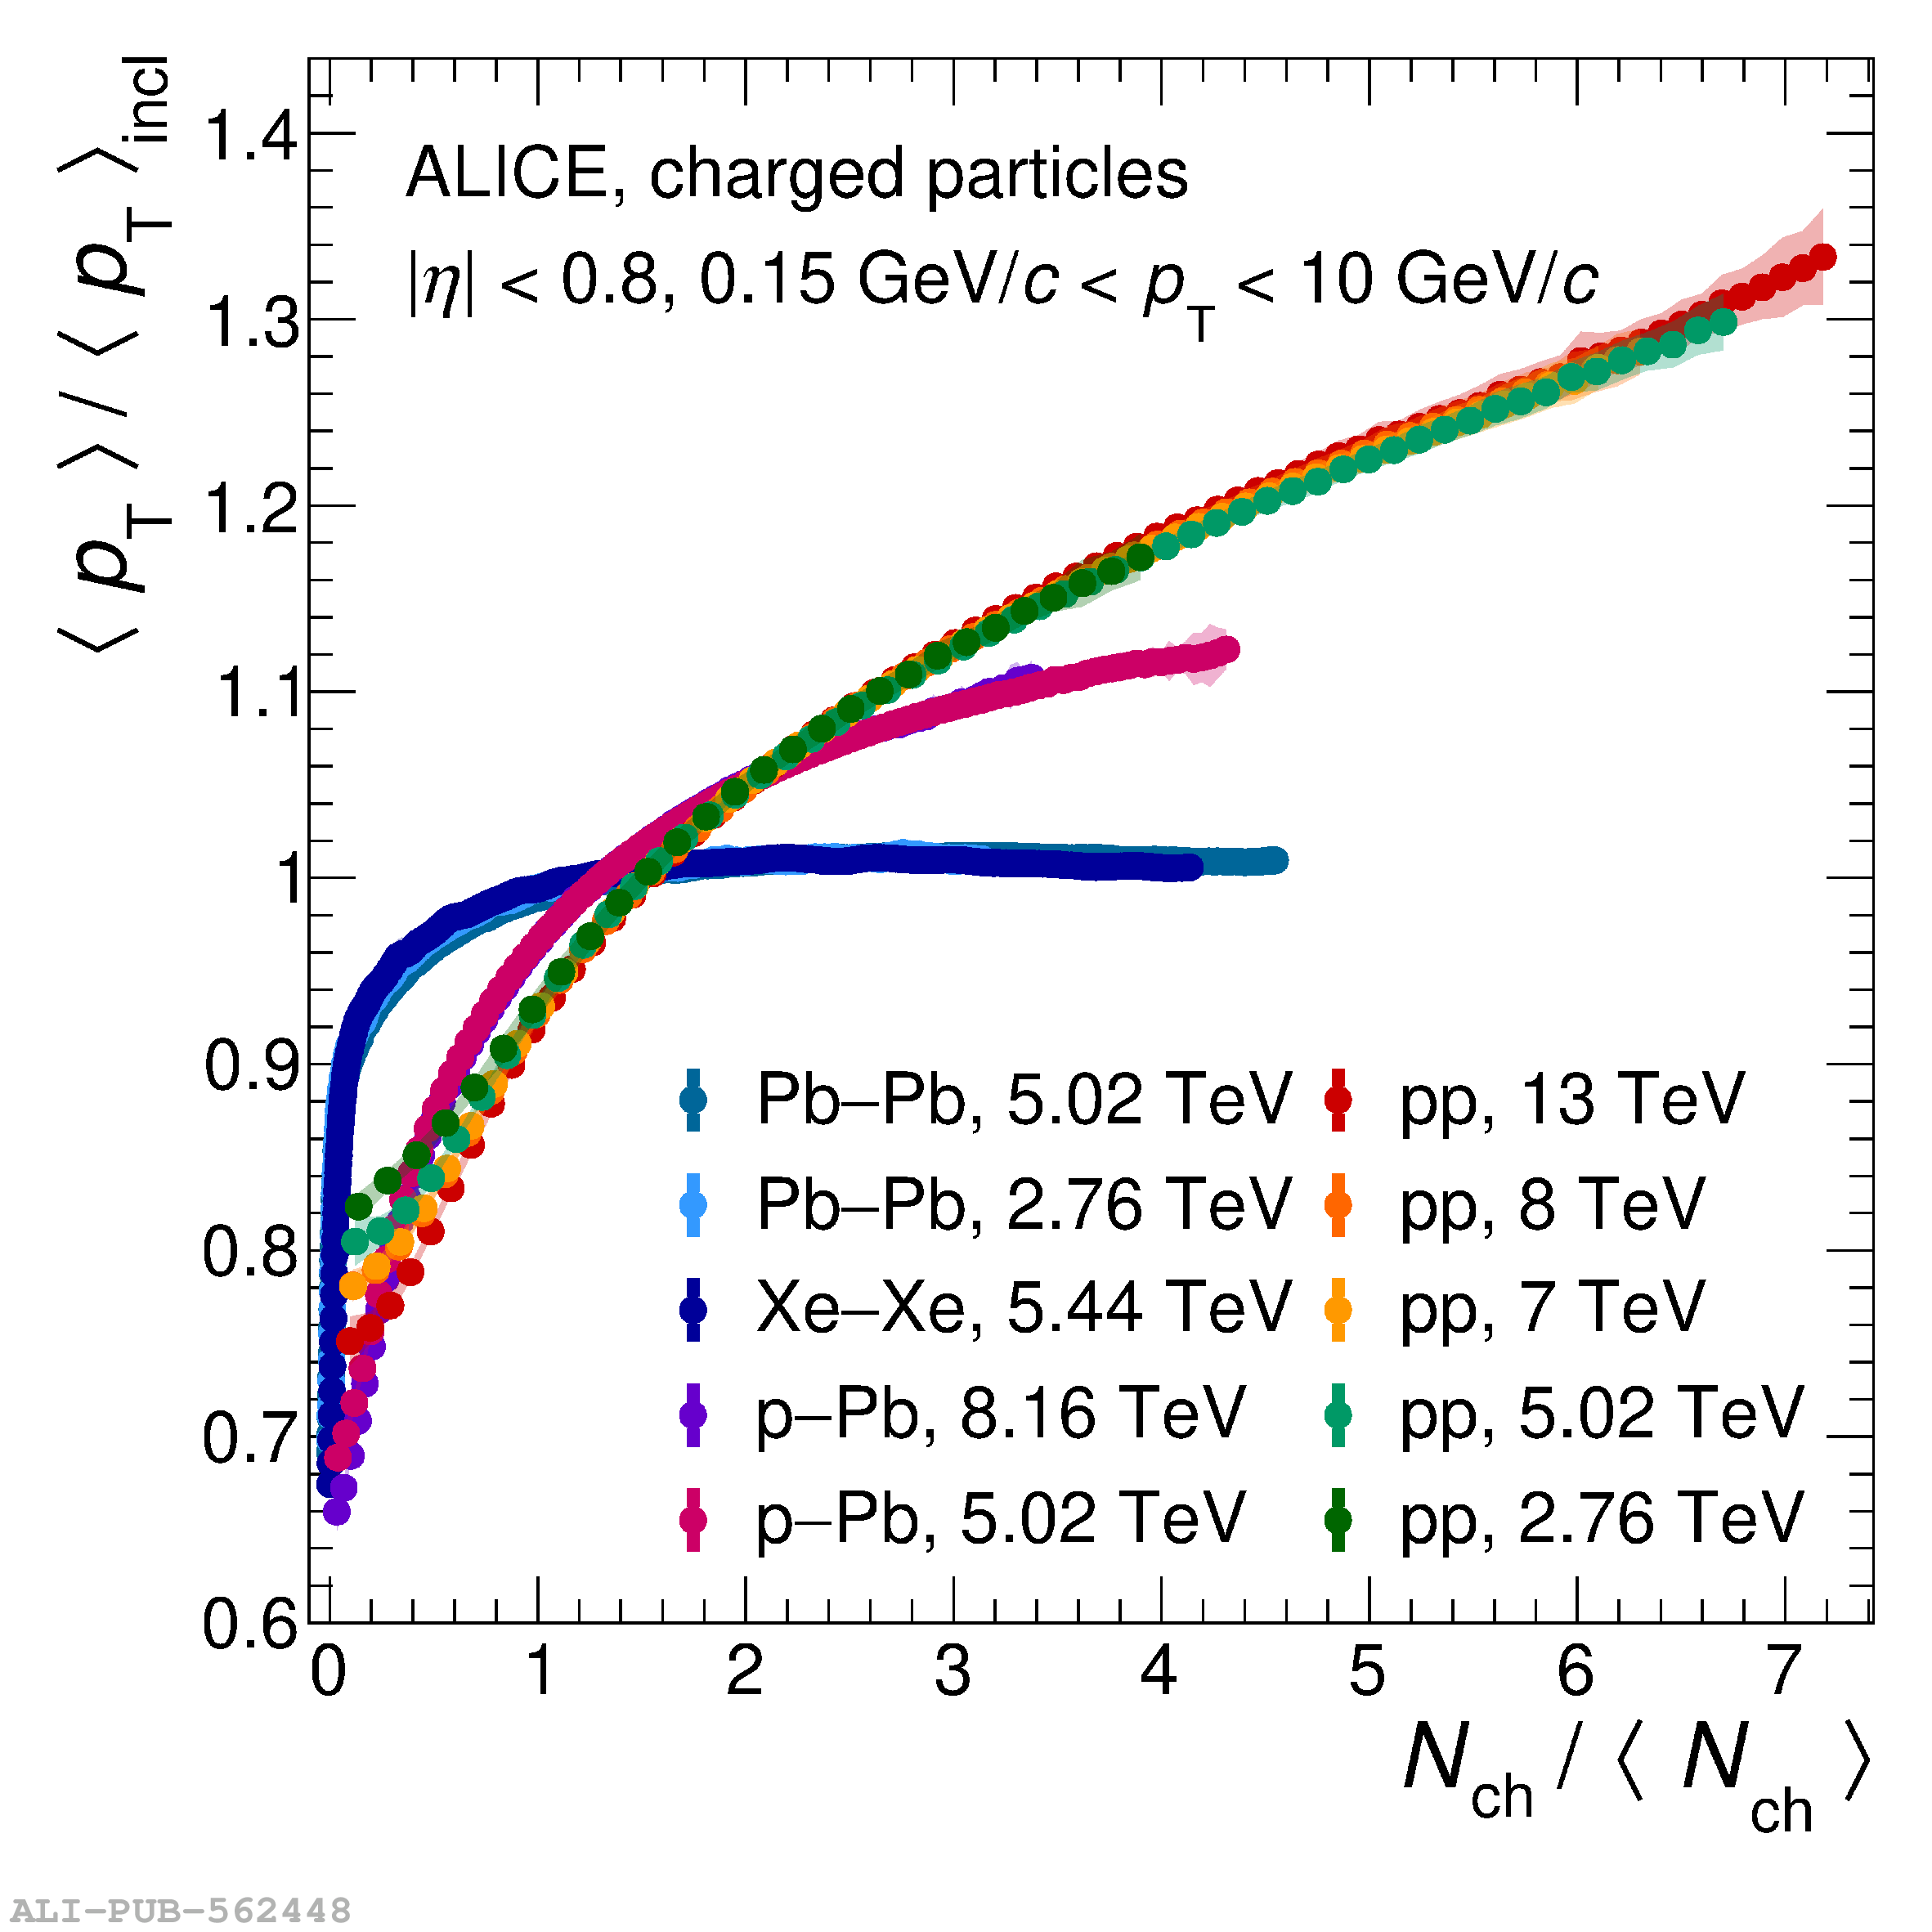 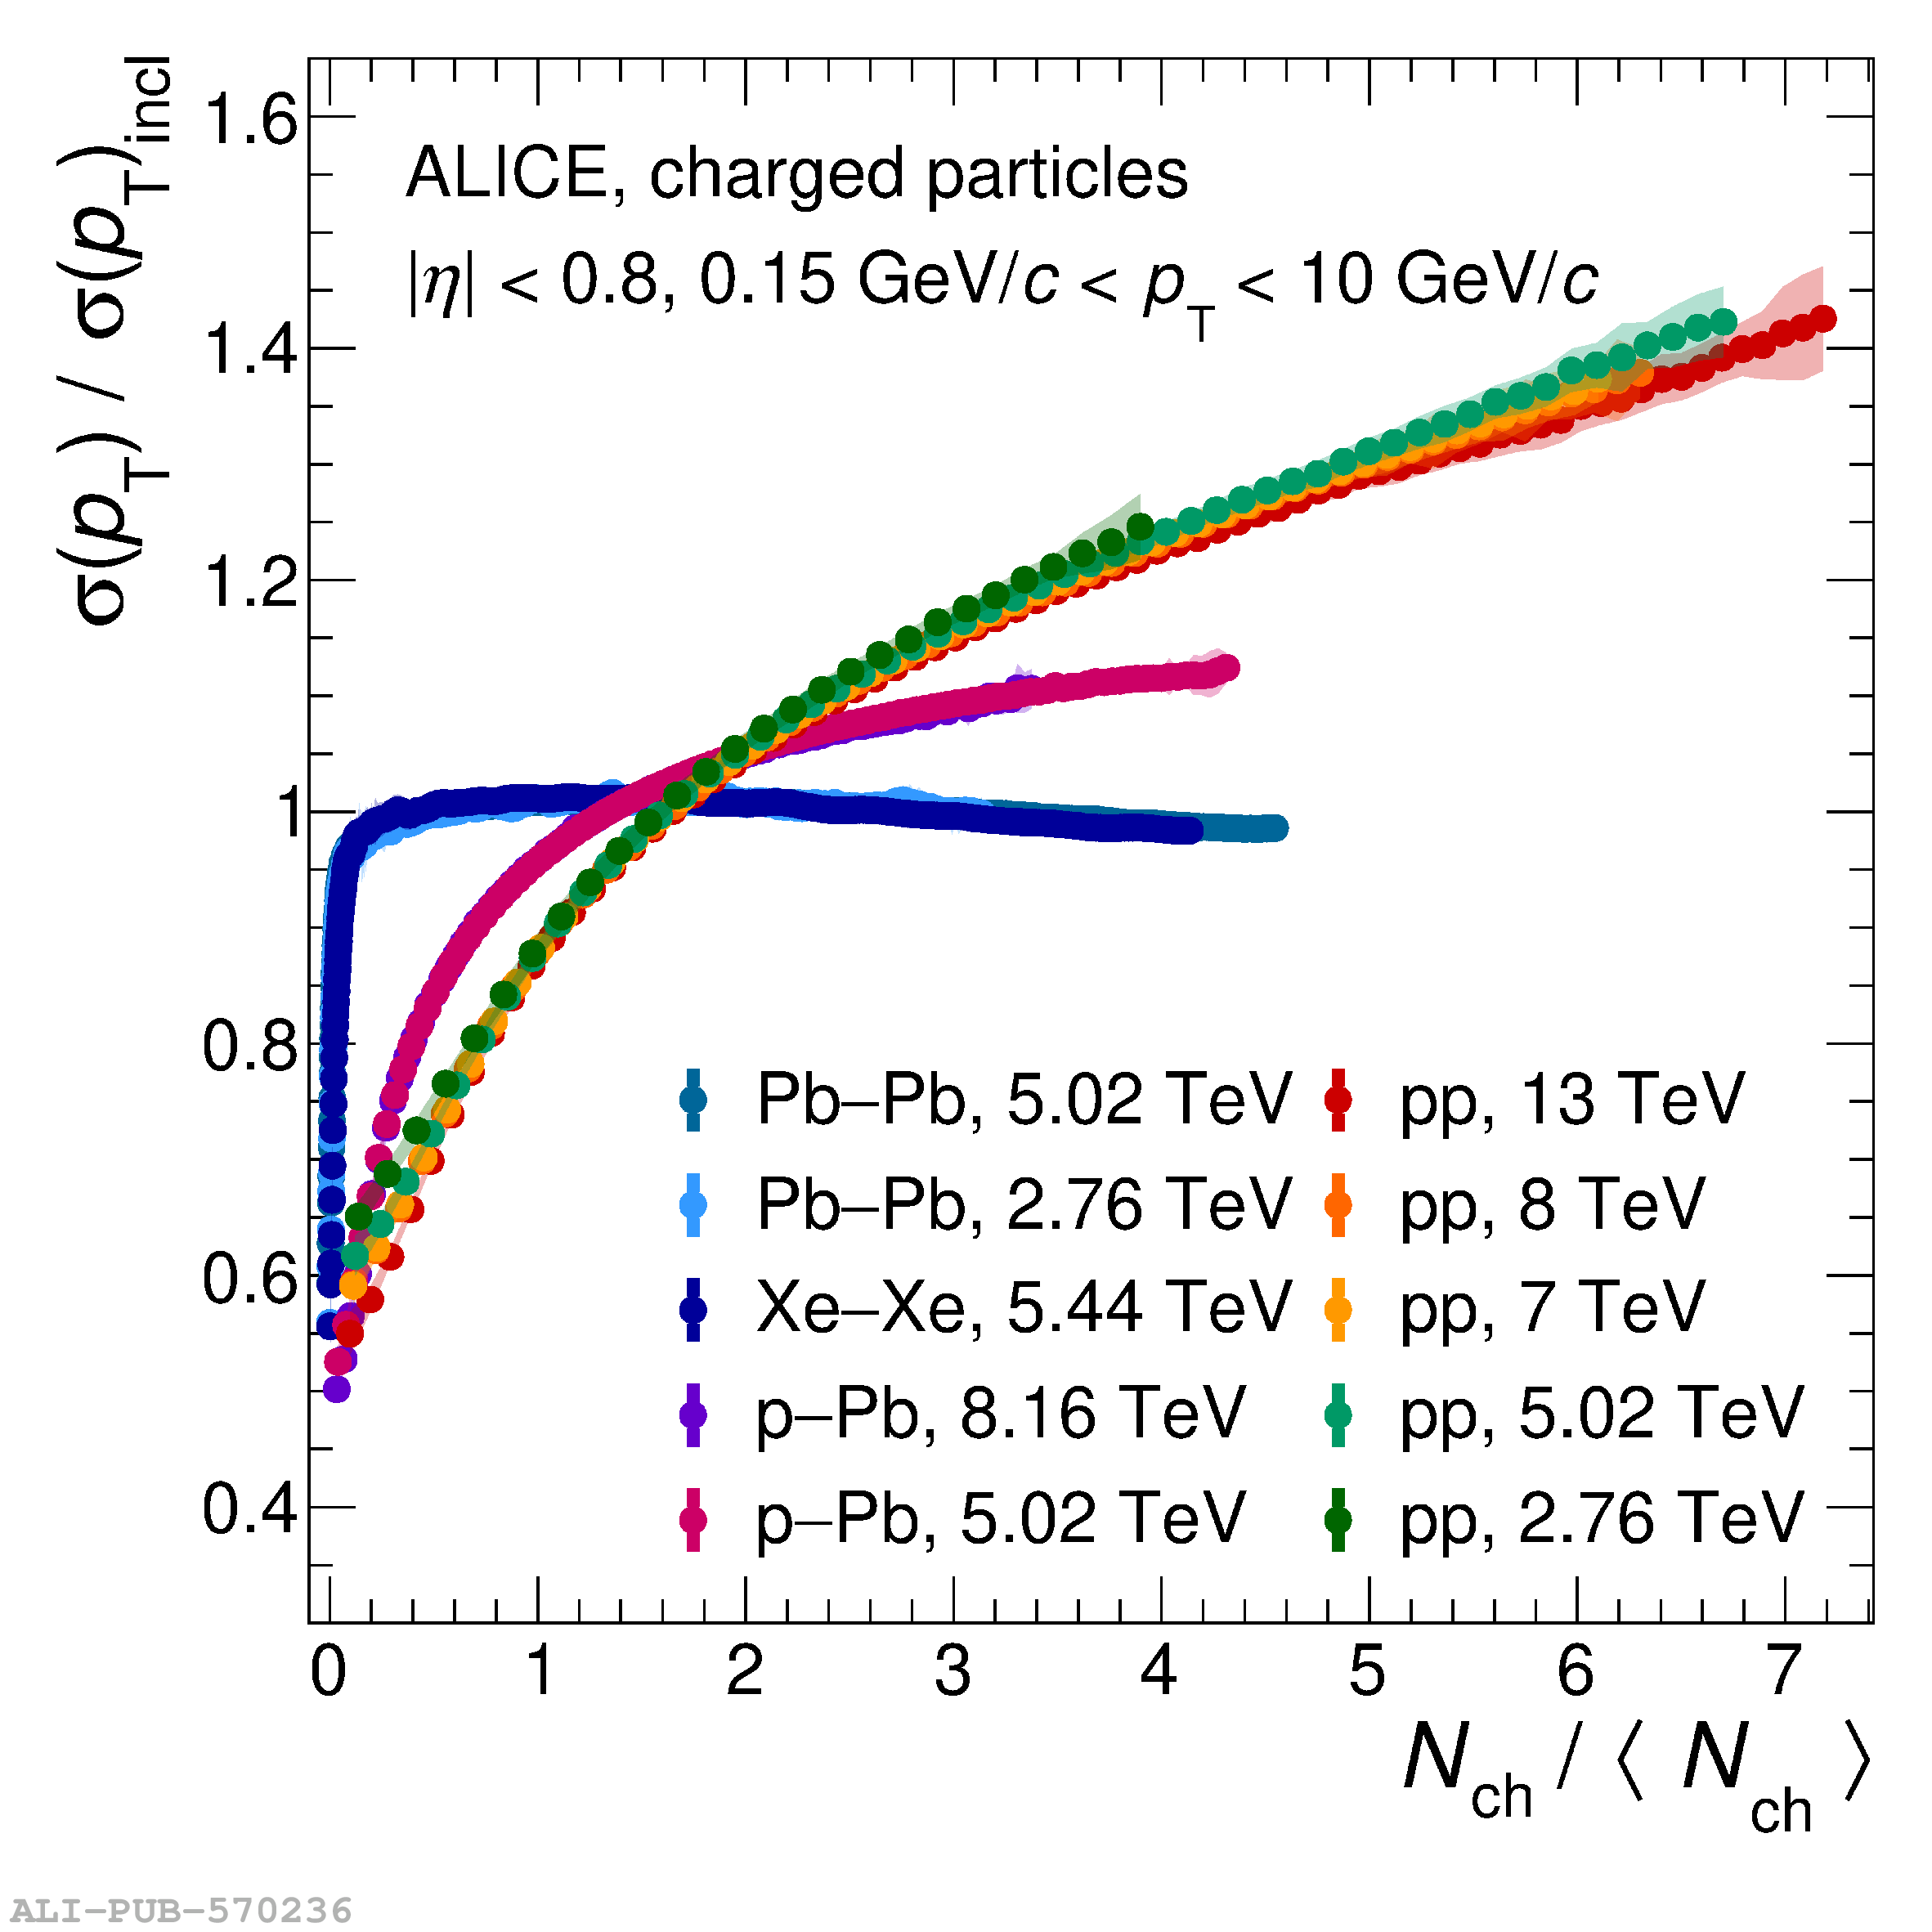 |
Figure 9
Relative standard deviation of the charged-particle transverse momentum spectra as a function of the absolute (left) and relative (right) charged-particle multiplicity for pp, p$-$Pb, Xe$-$Xe and Pb$-$Pb collisions at various centre-of-mass energies per nucleon pair Statistical and systematic uncertainties are shown as bars and semi-transparent bands, respectively. | 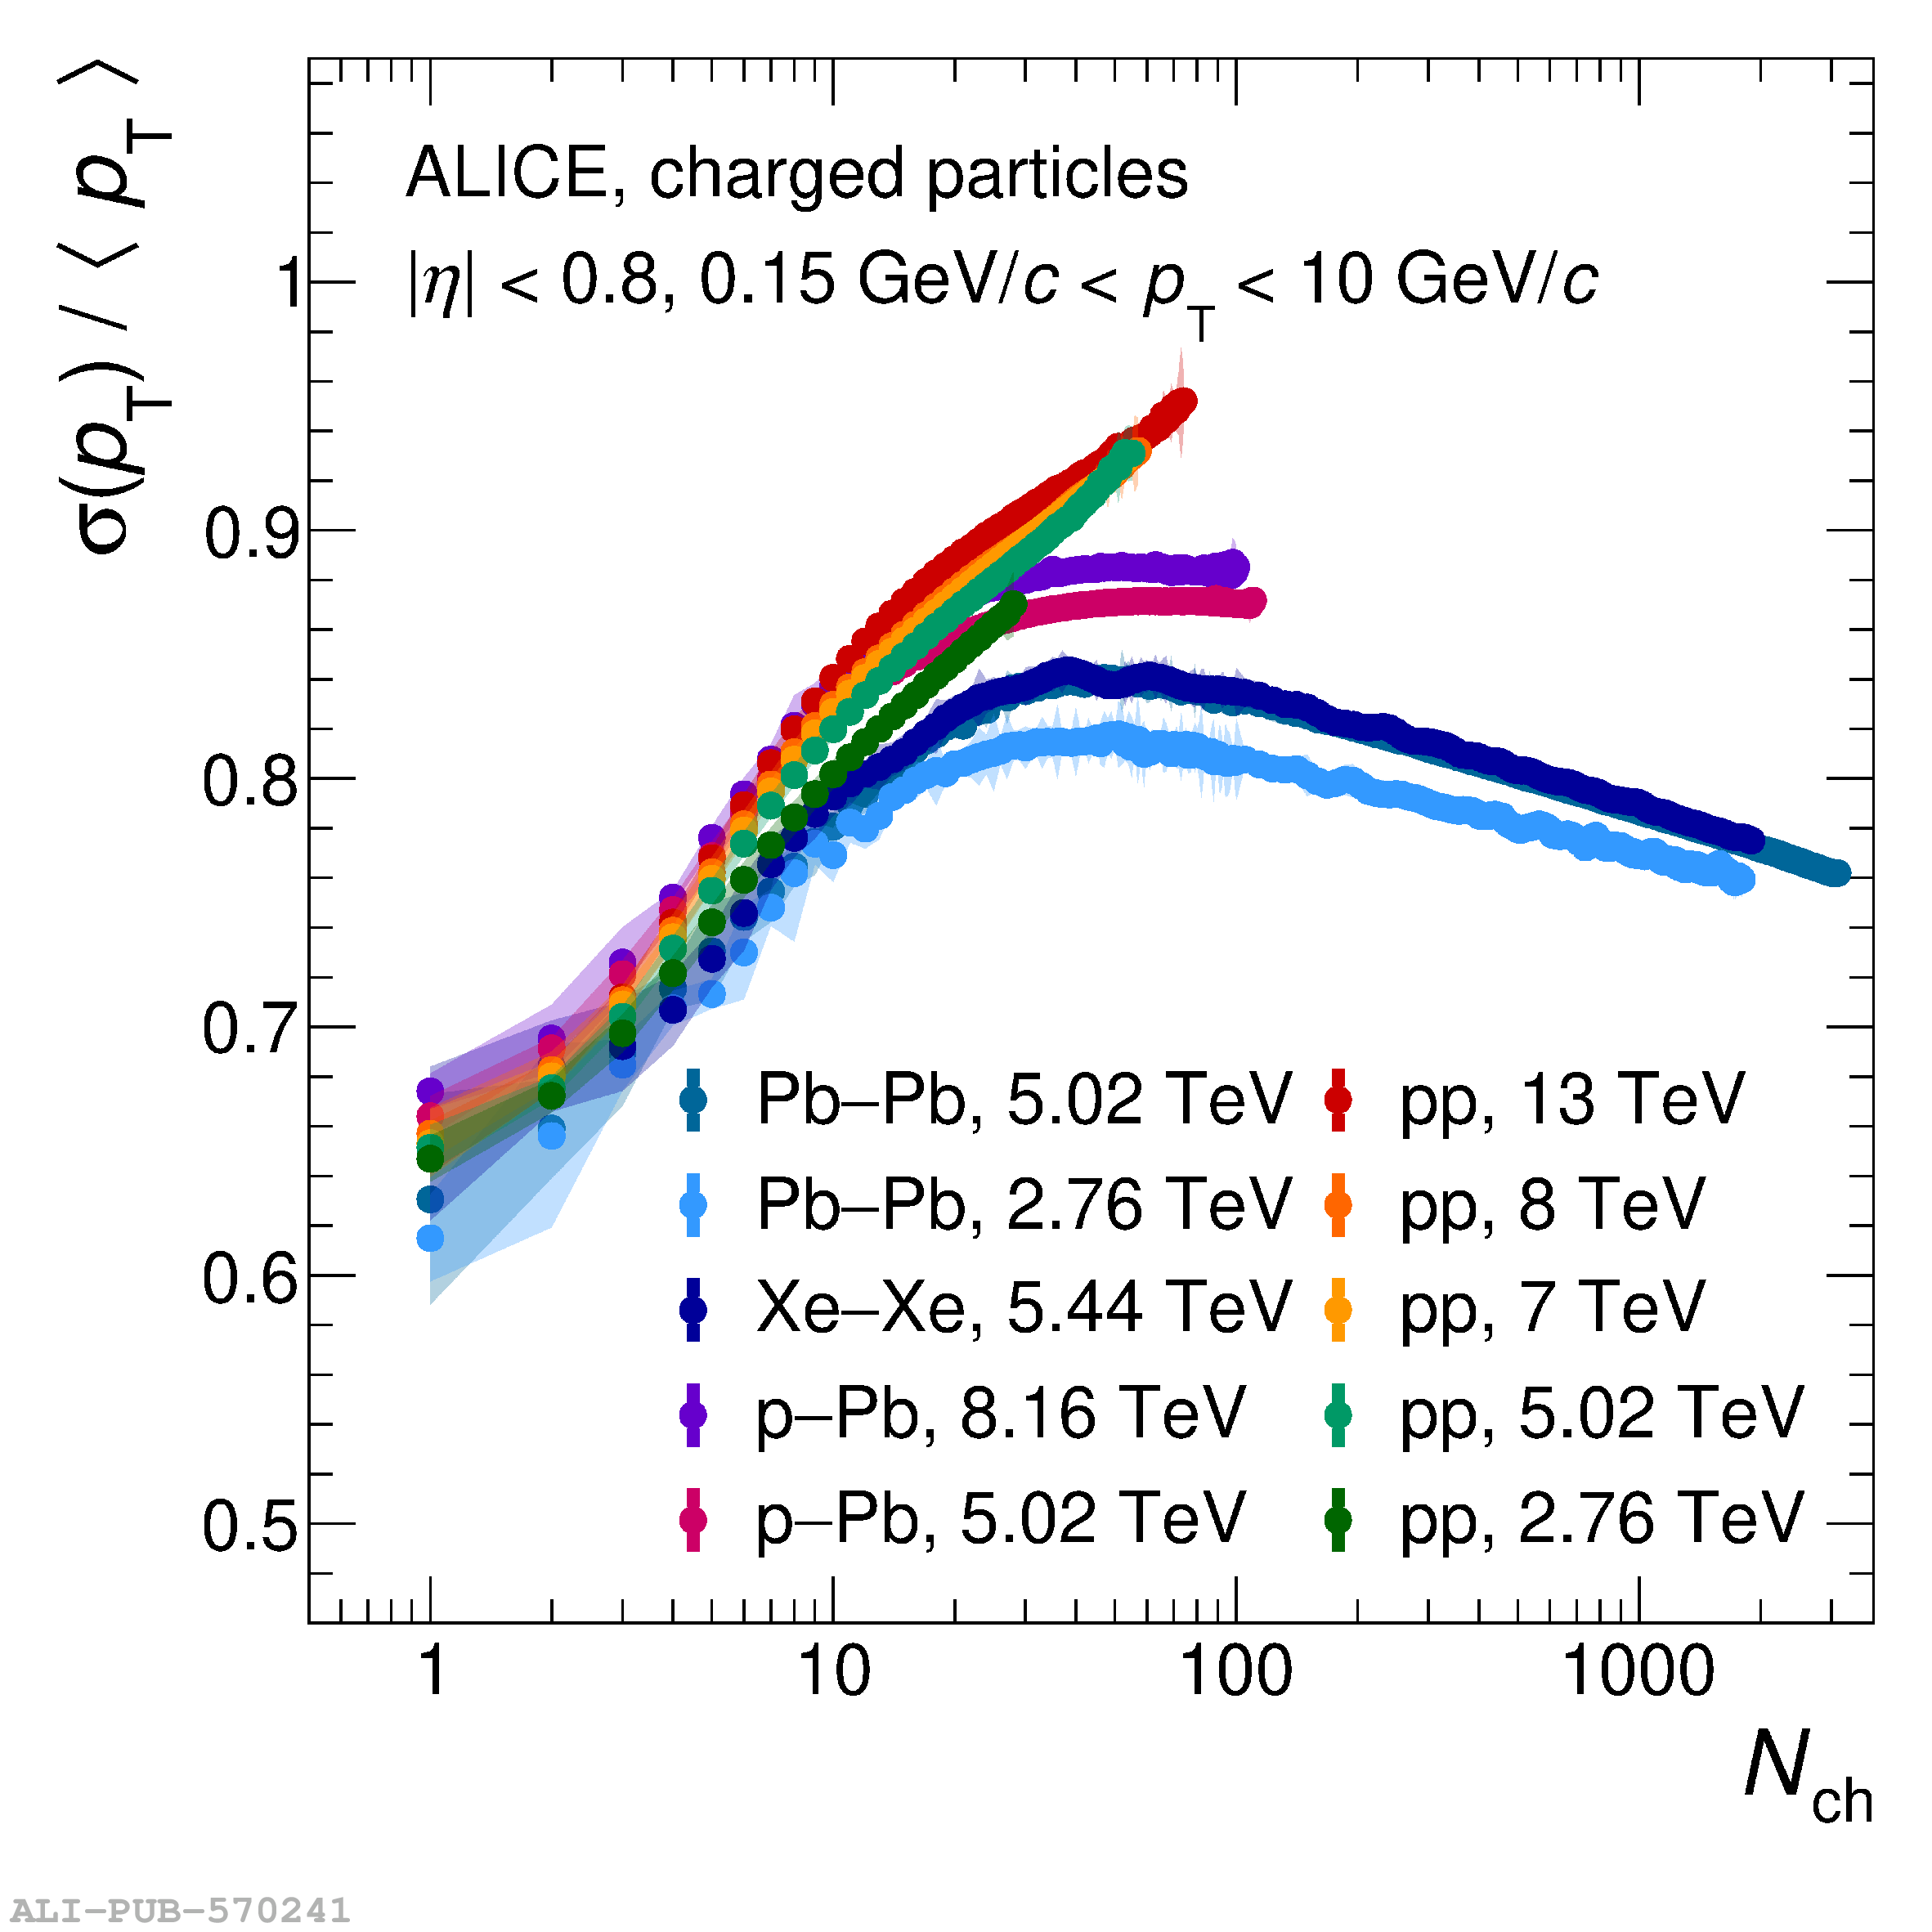 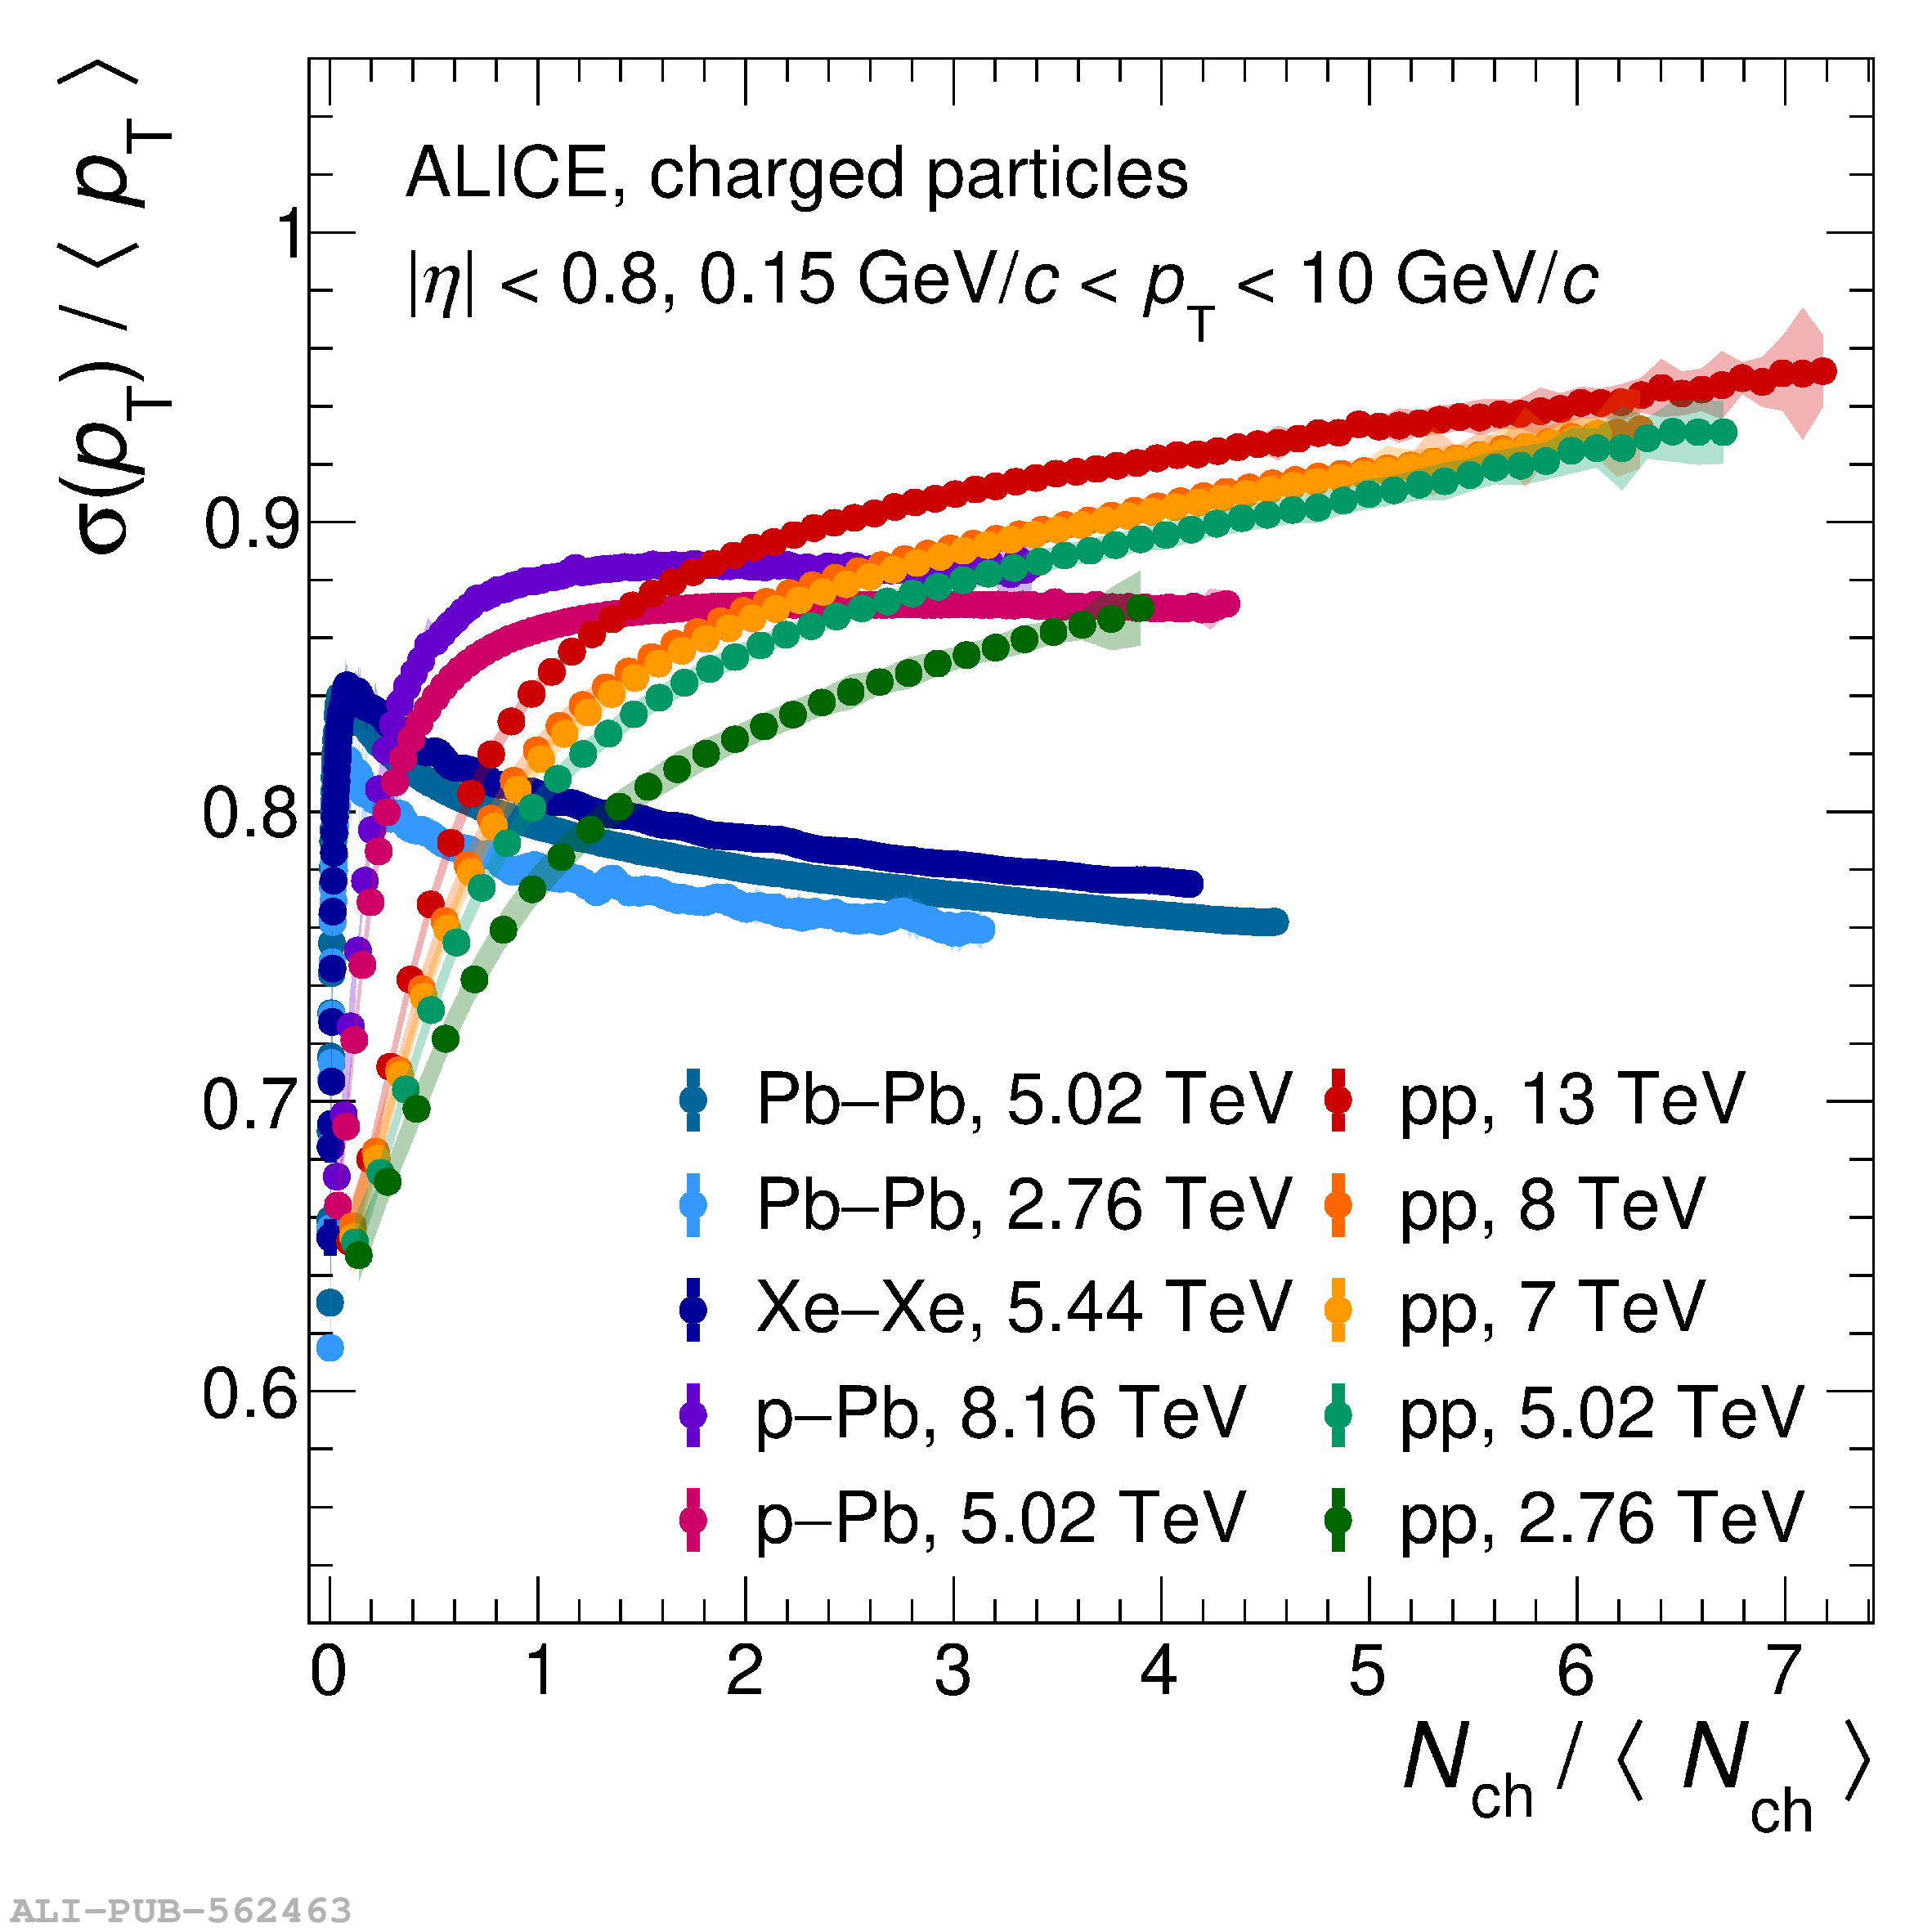 |
Figure 10
Ratio of model predictions to data for pp collisions at various energies. The upper panels show it for the multiplicity distributions (left) and their KNO-scaling form (right), the bottom panels represent $\langle \pt \rangle$ (left) and $\sigma(\pt)$ (right). The semi-transparent bands indicate the relative systematic uncertainties of the data. | 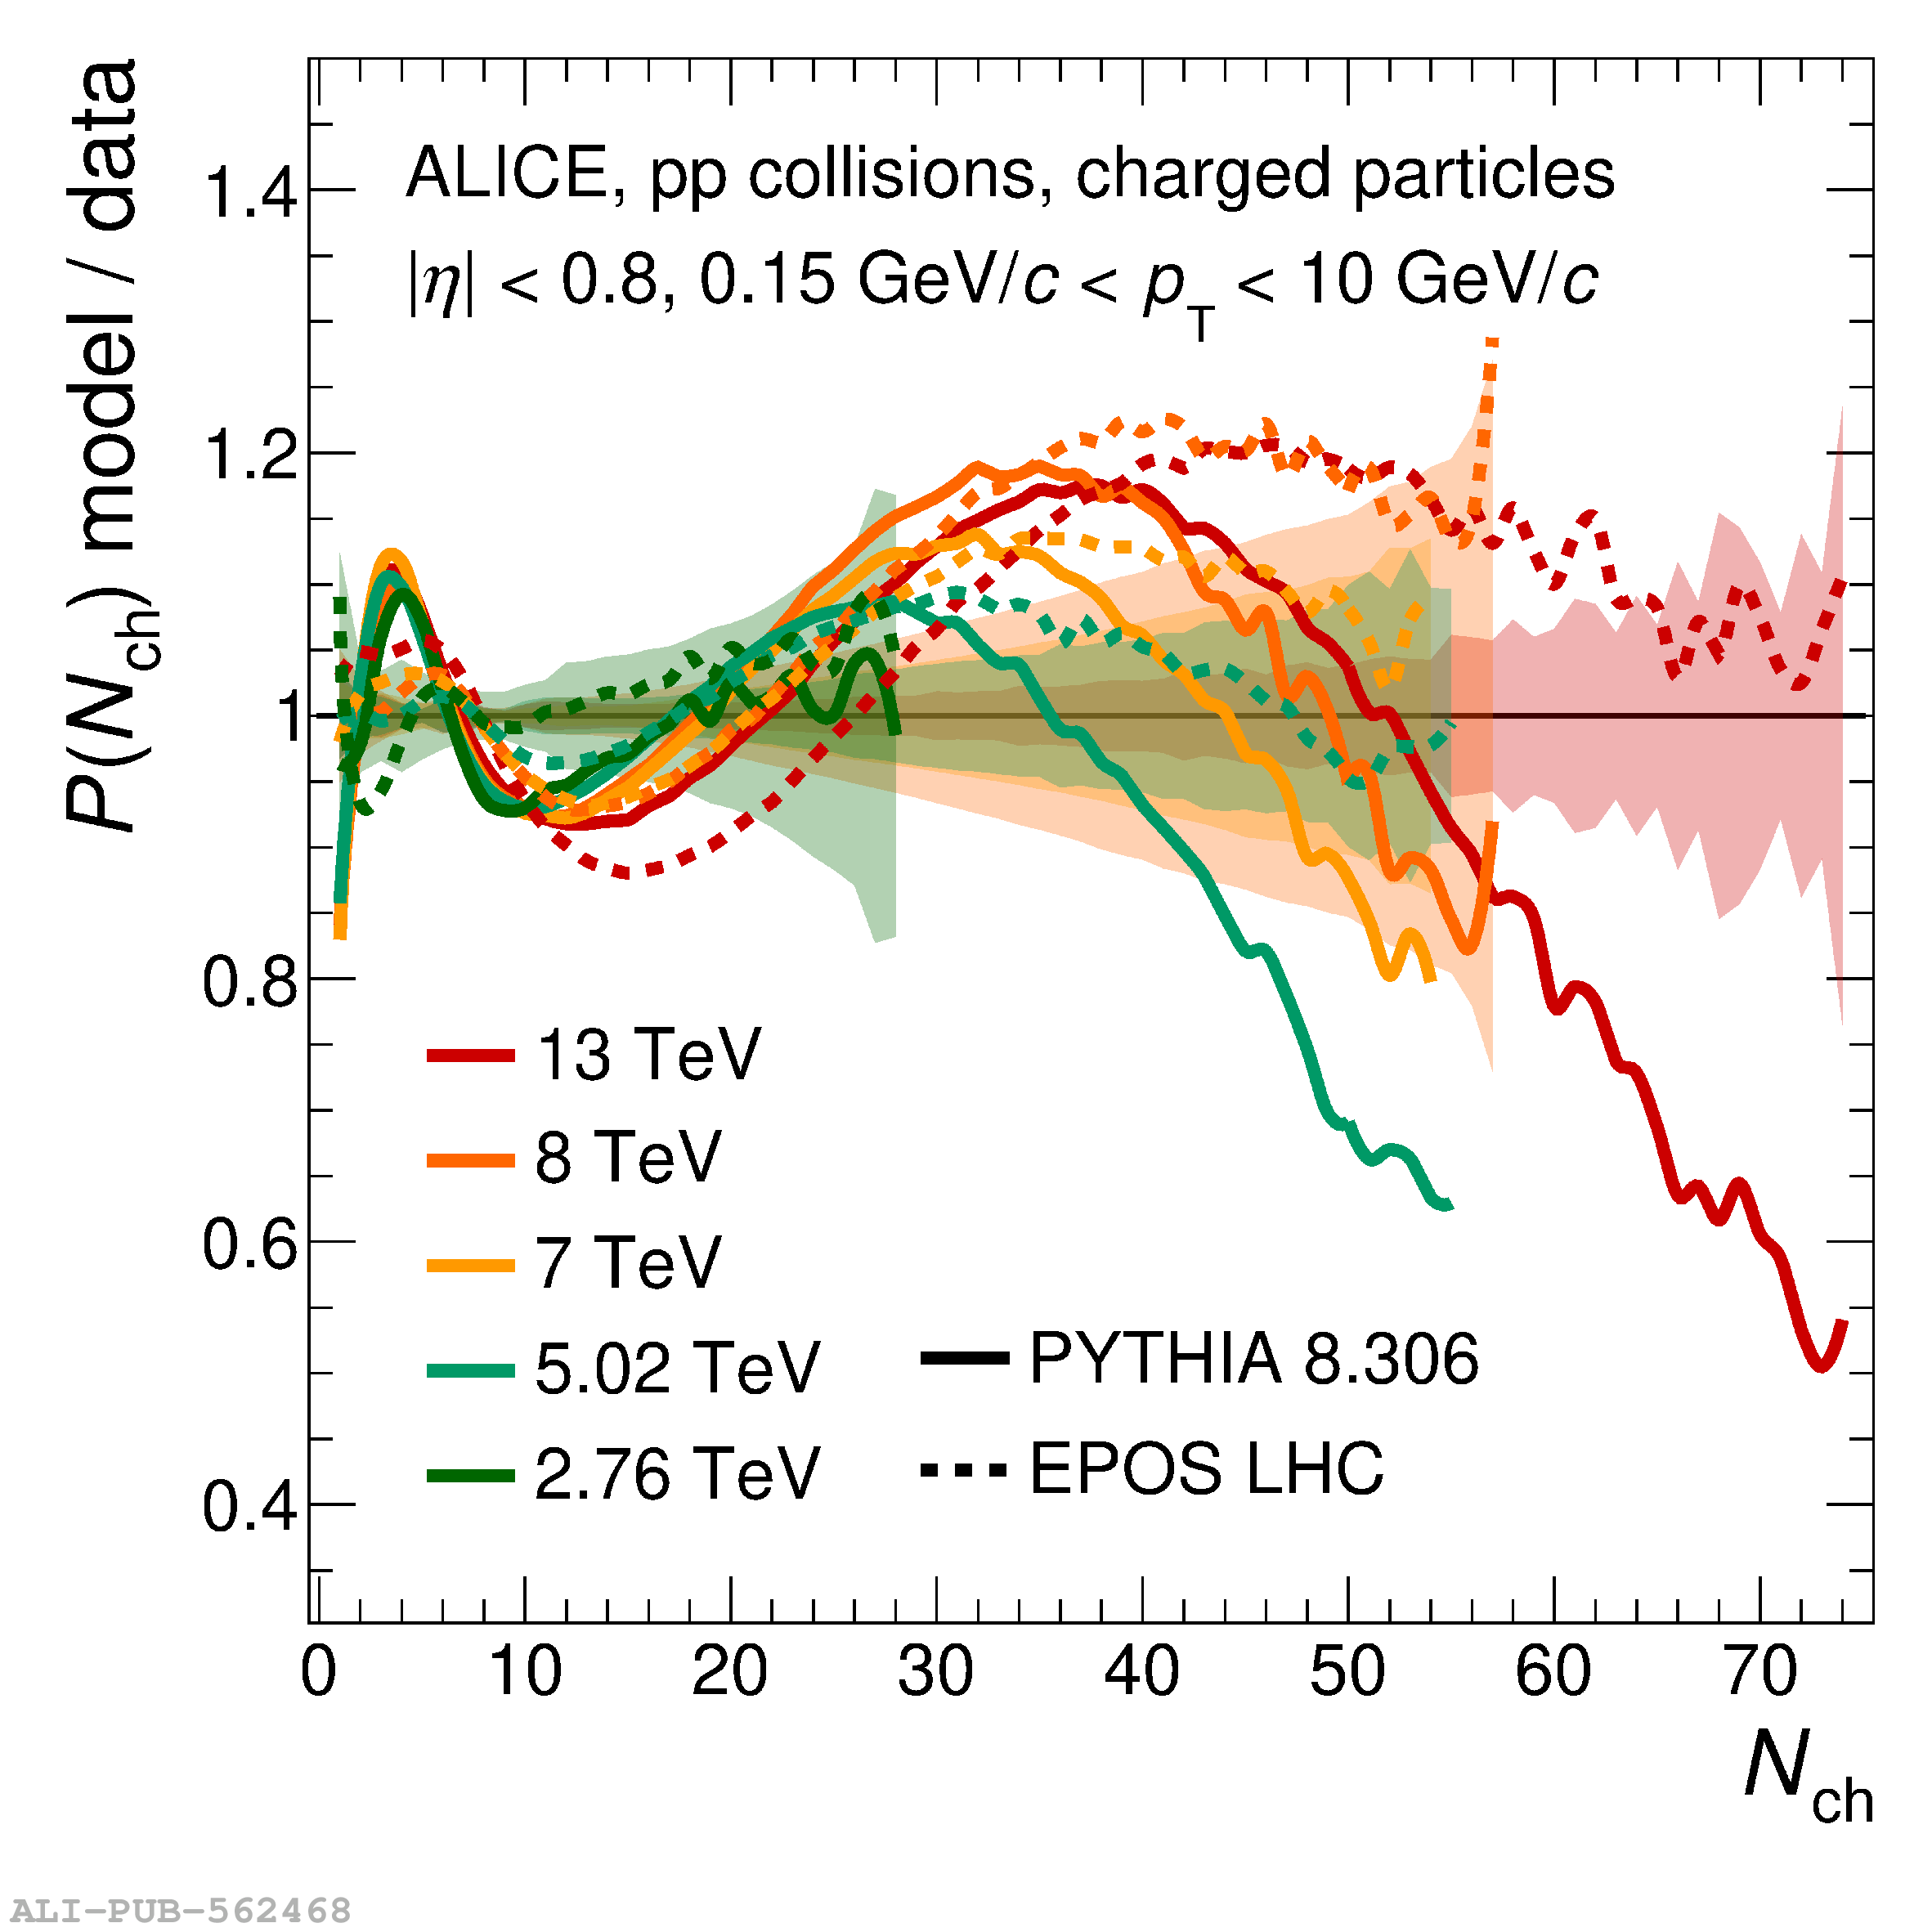 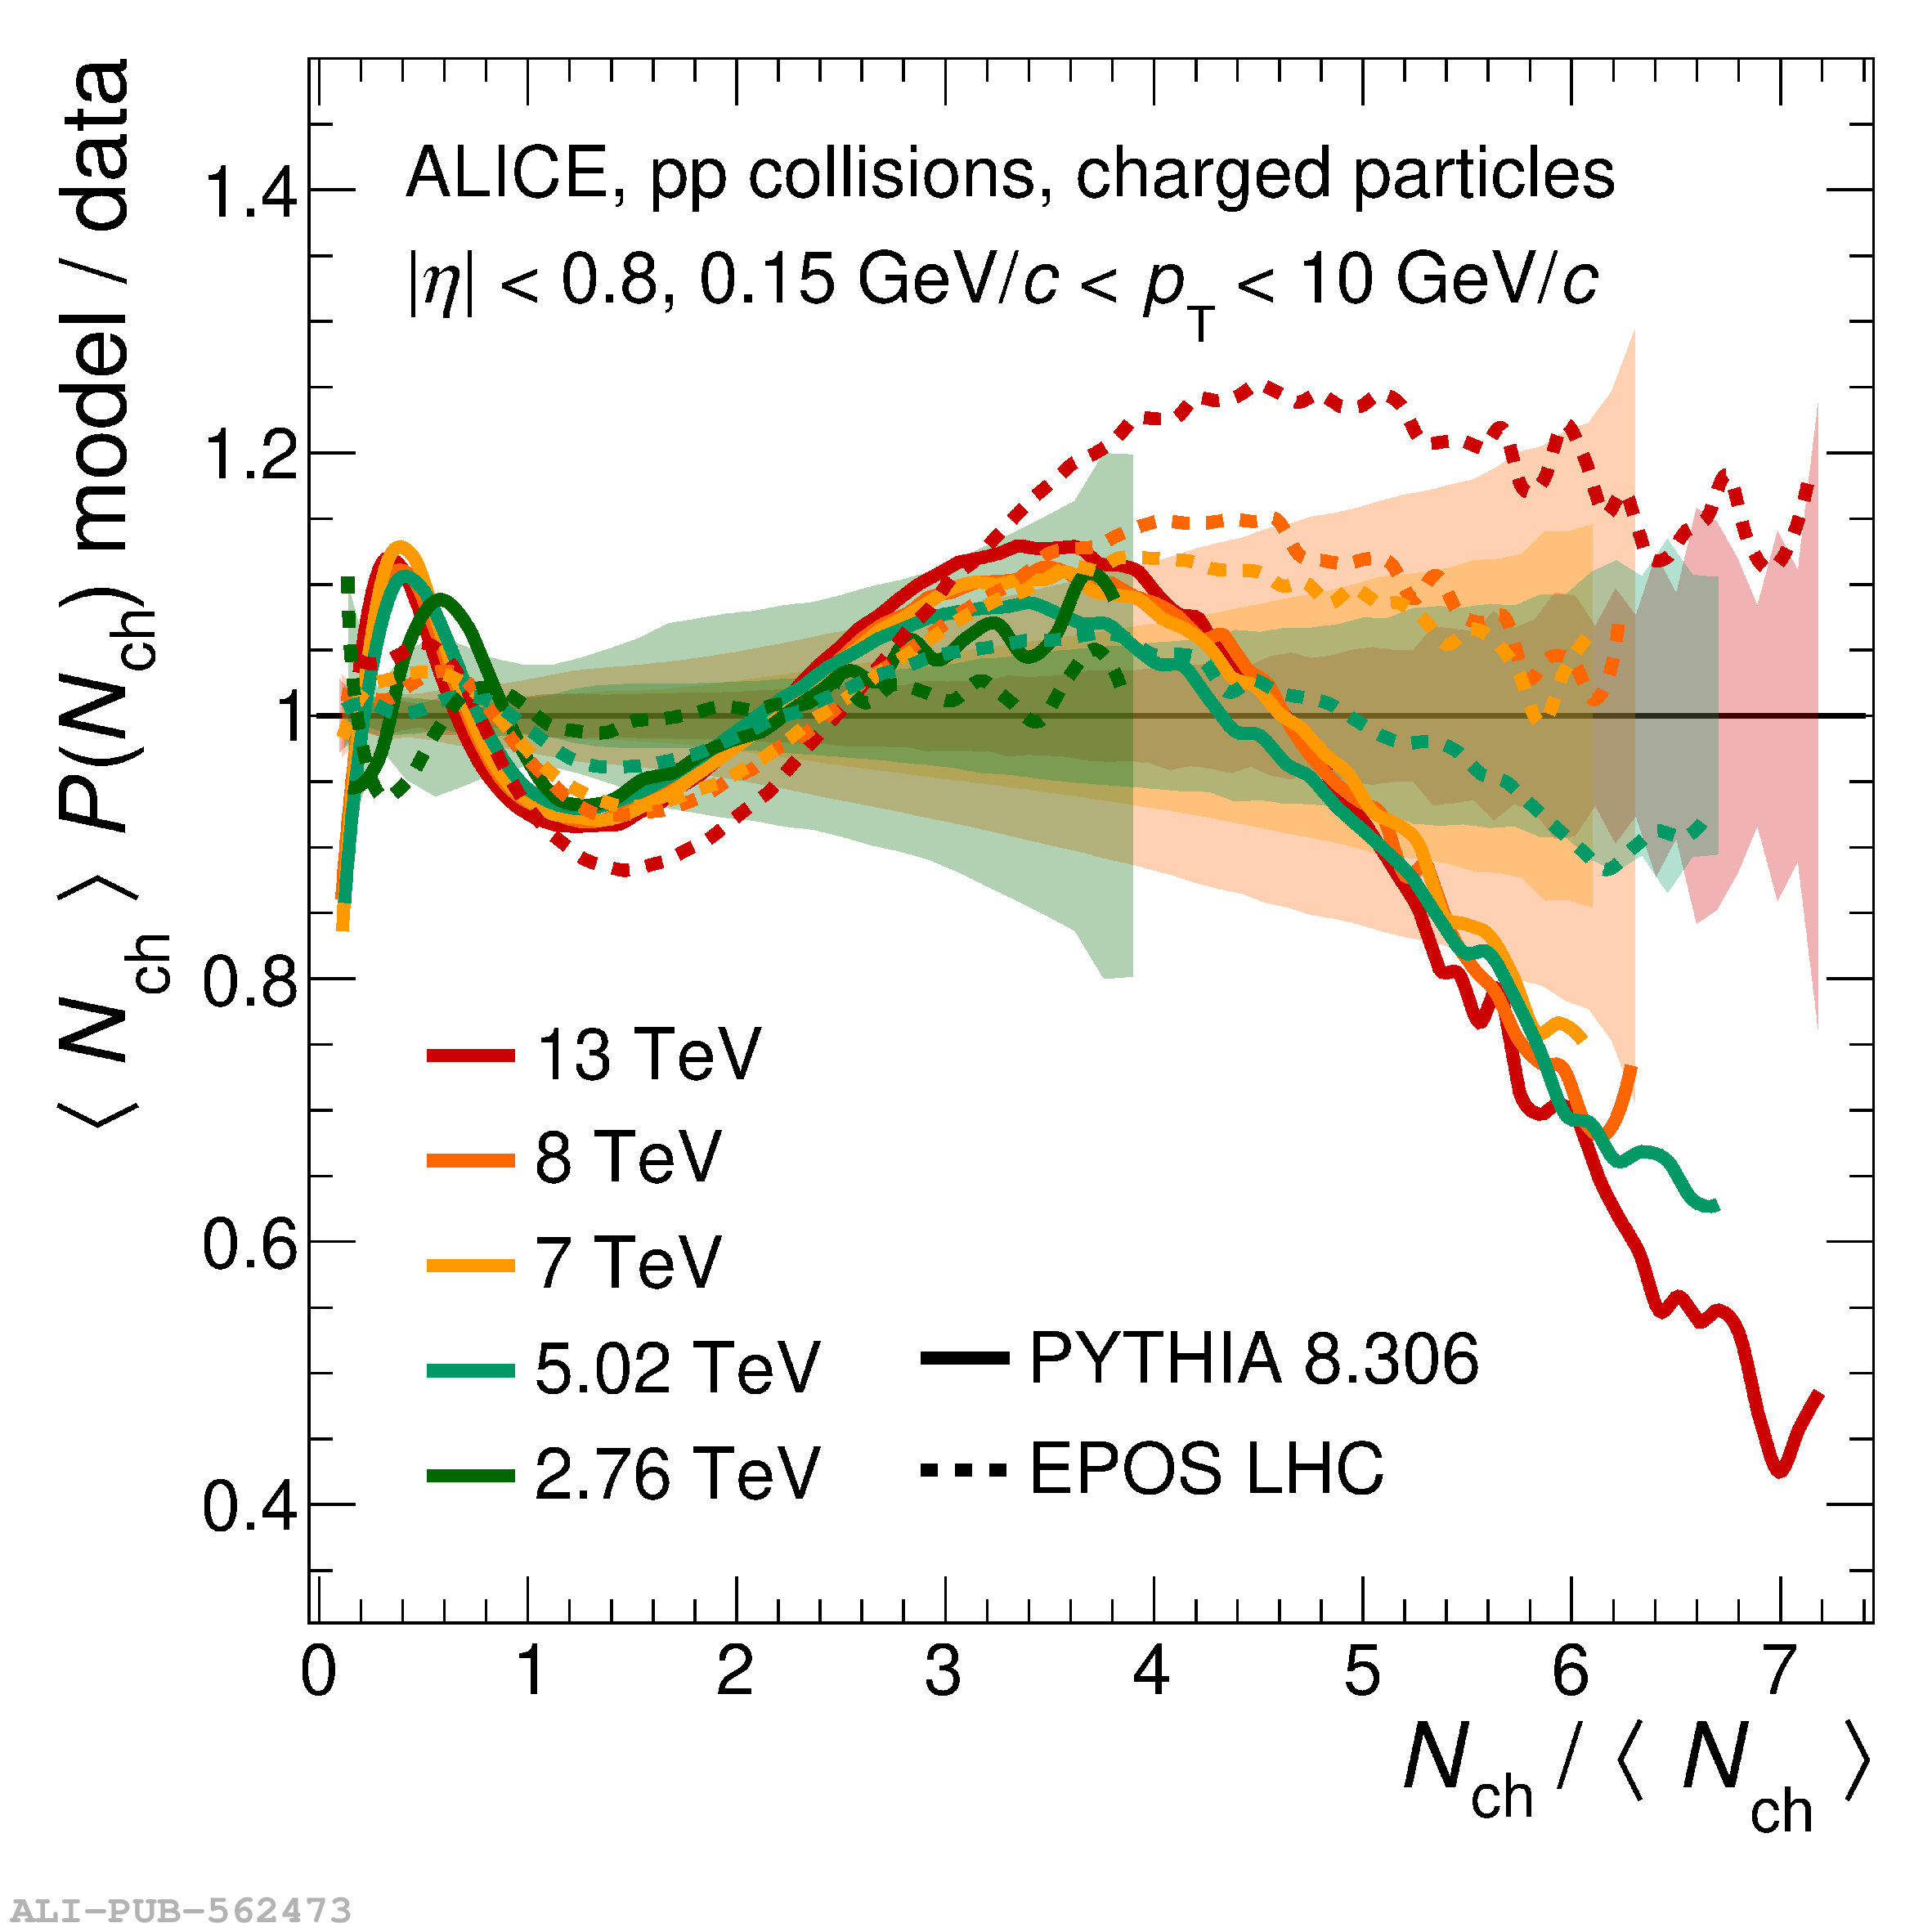  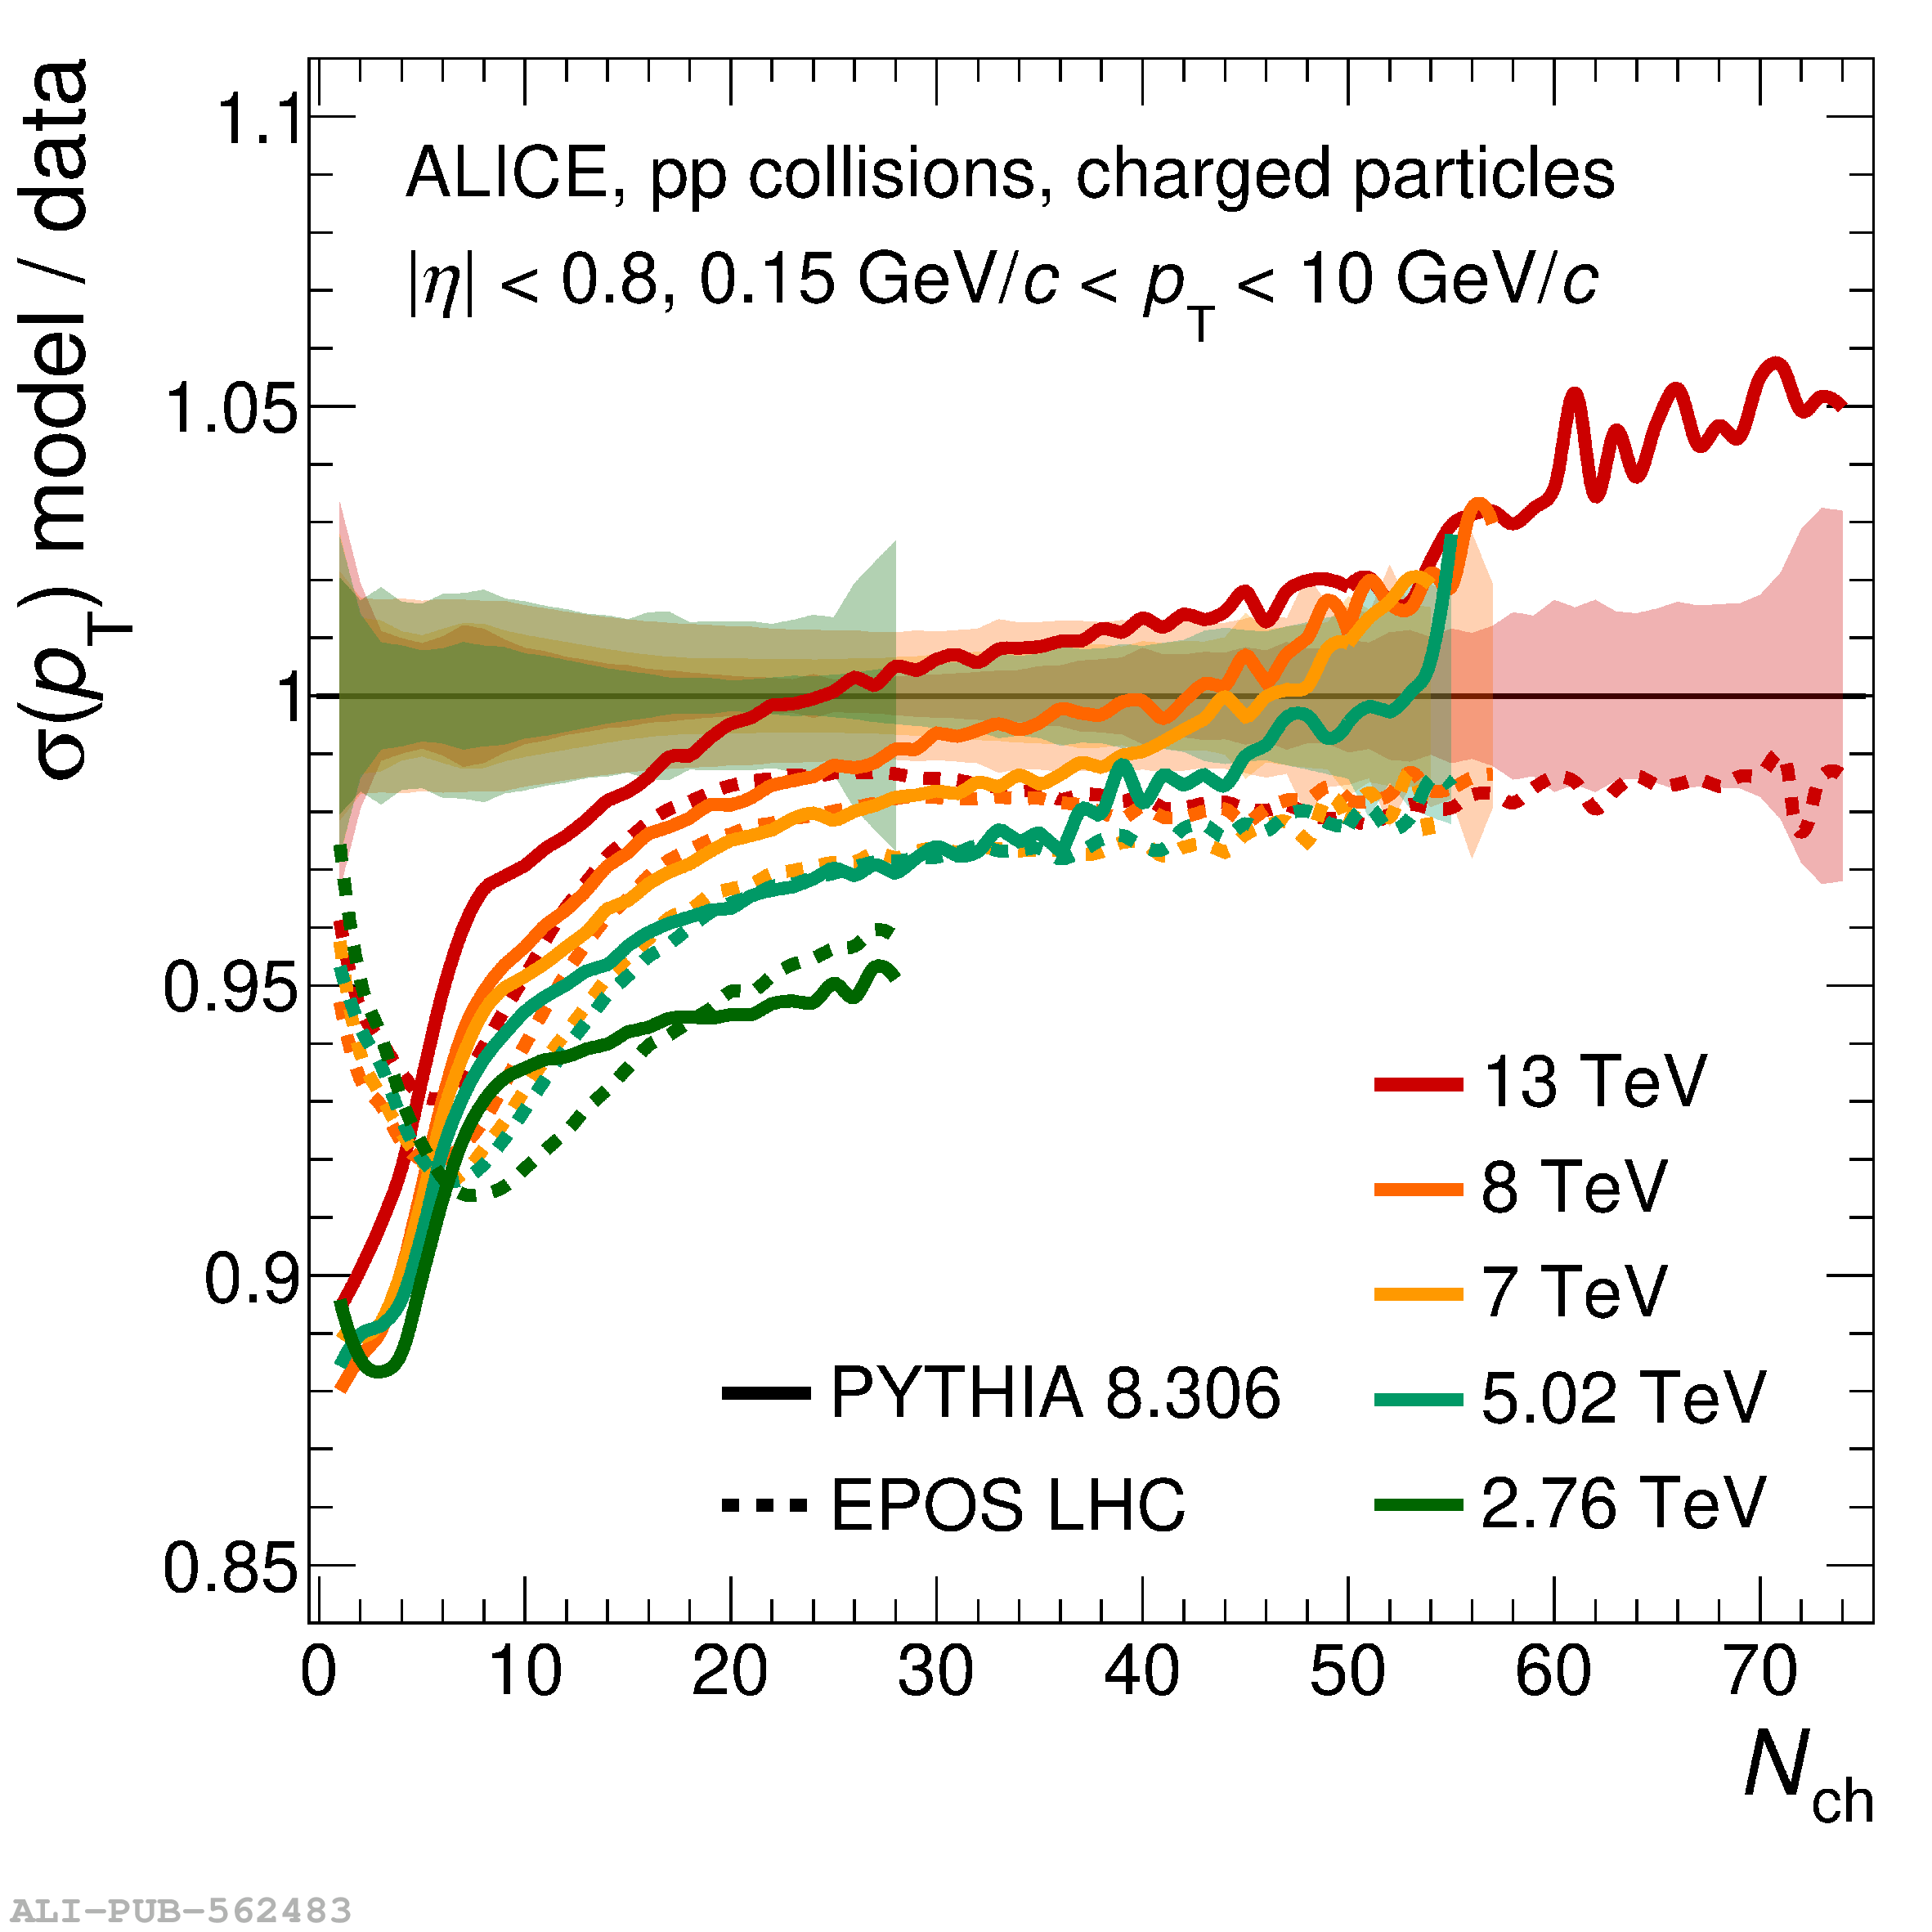 |
Figure 11
Ratio of model predictions to data for p$-$Pb collisions at various energies. The upper panels show it for the multiplicity distributions (left) and their KNO-scaling form (right), the bottom panels represent $\langle \pt \rangle$ (left) and $\sigma(\pt)$ (right). The semi-transparent bands indicate the relative systematic uncertainties of the data. | 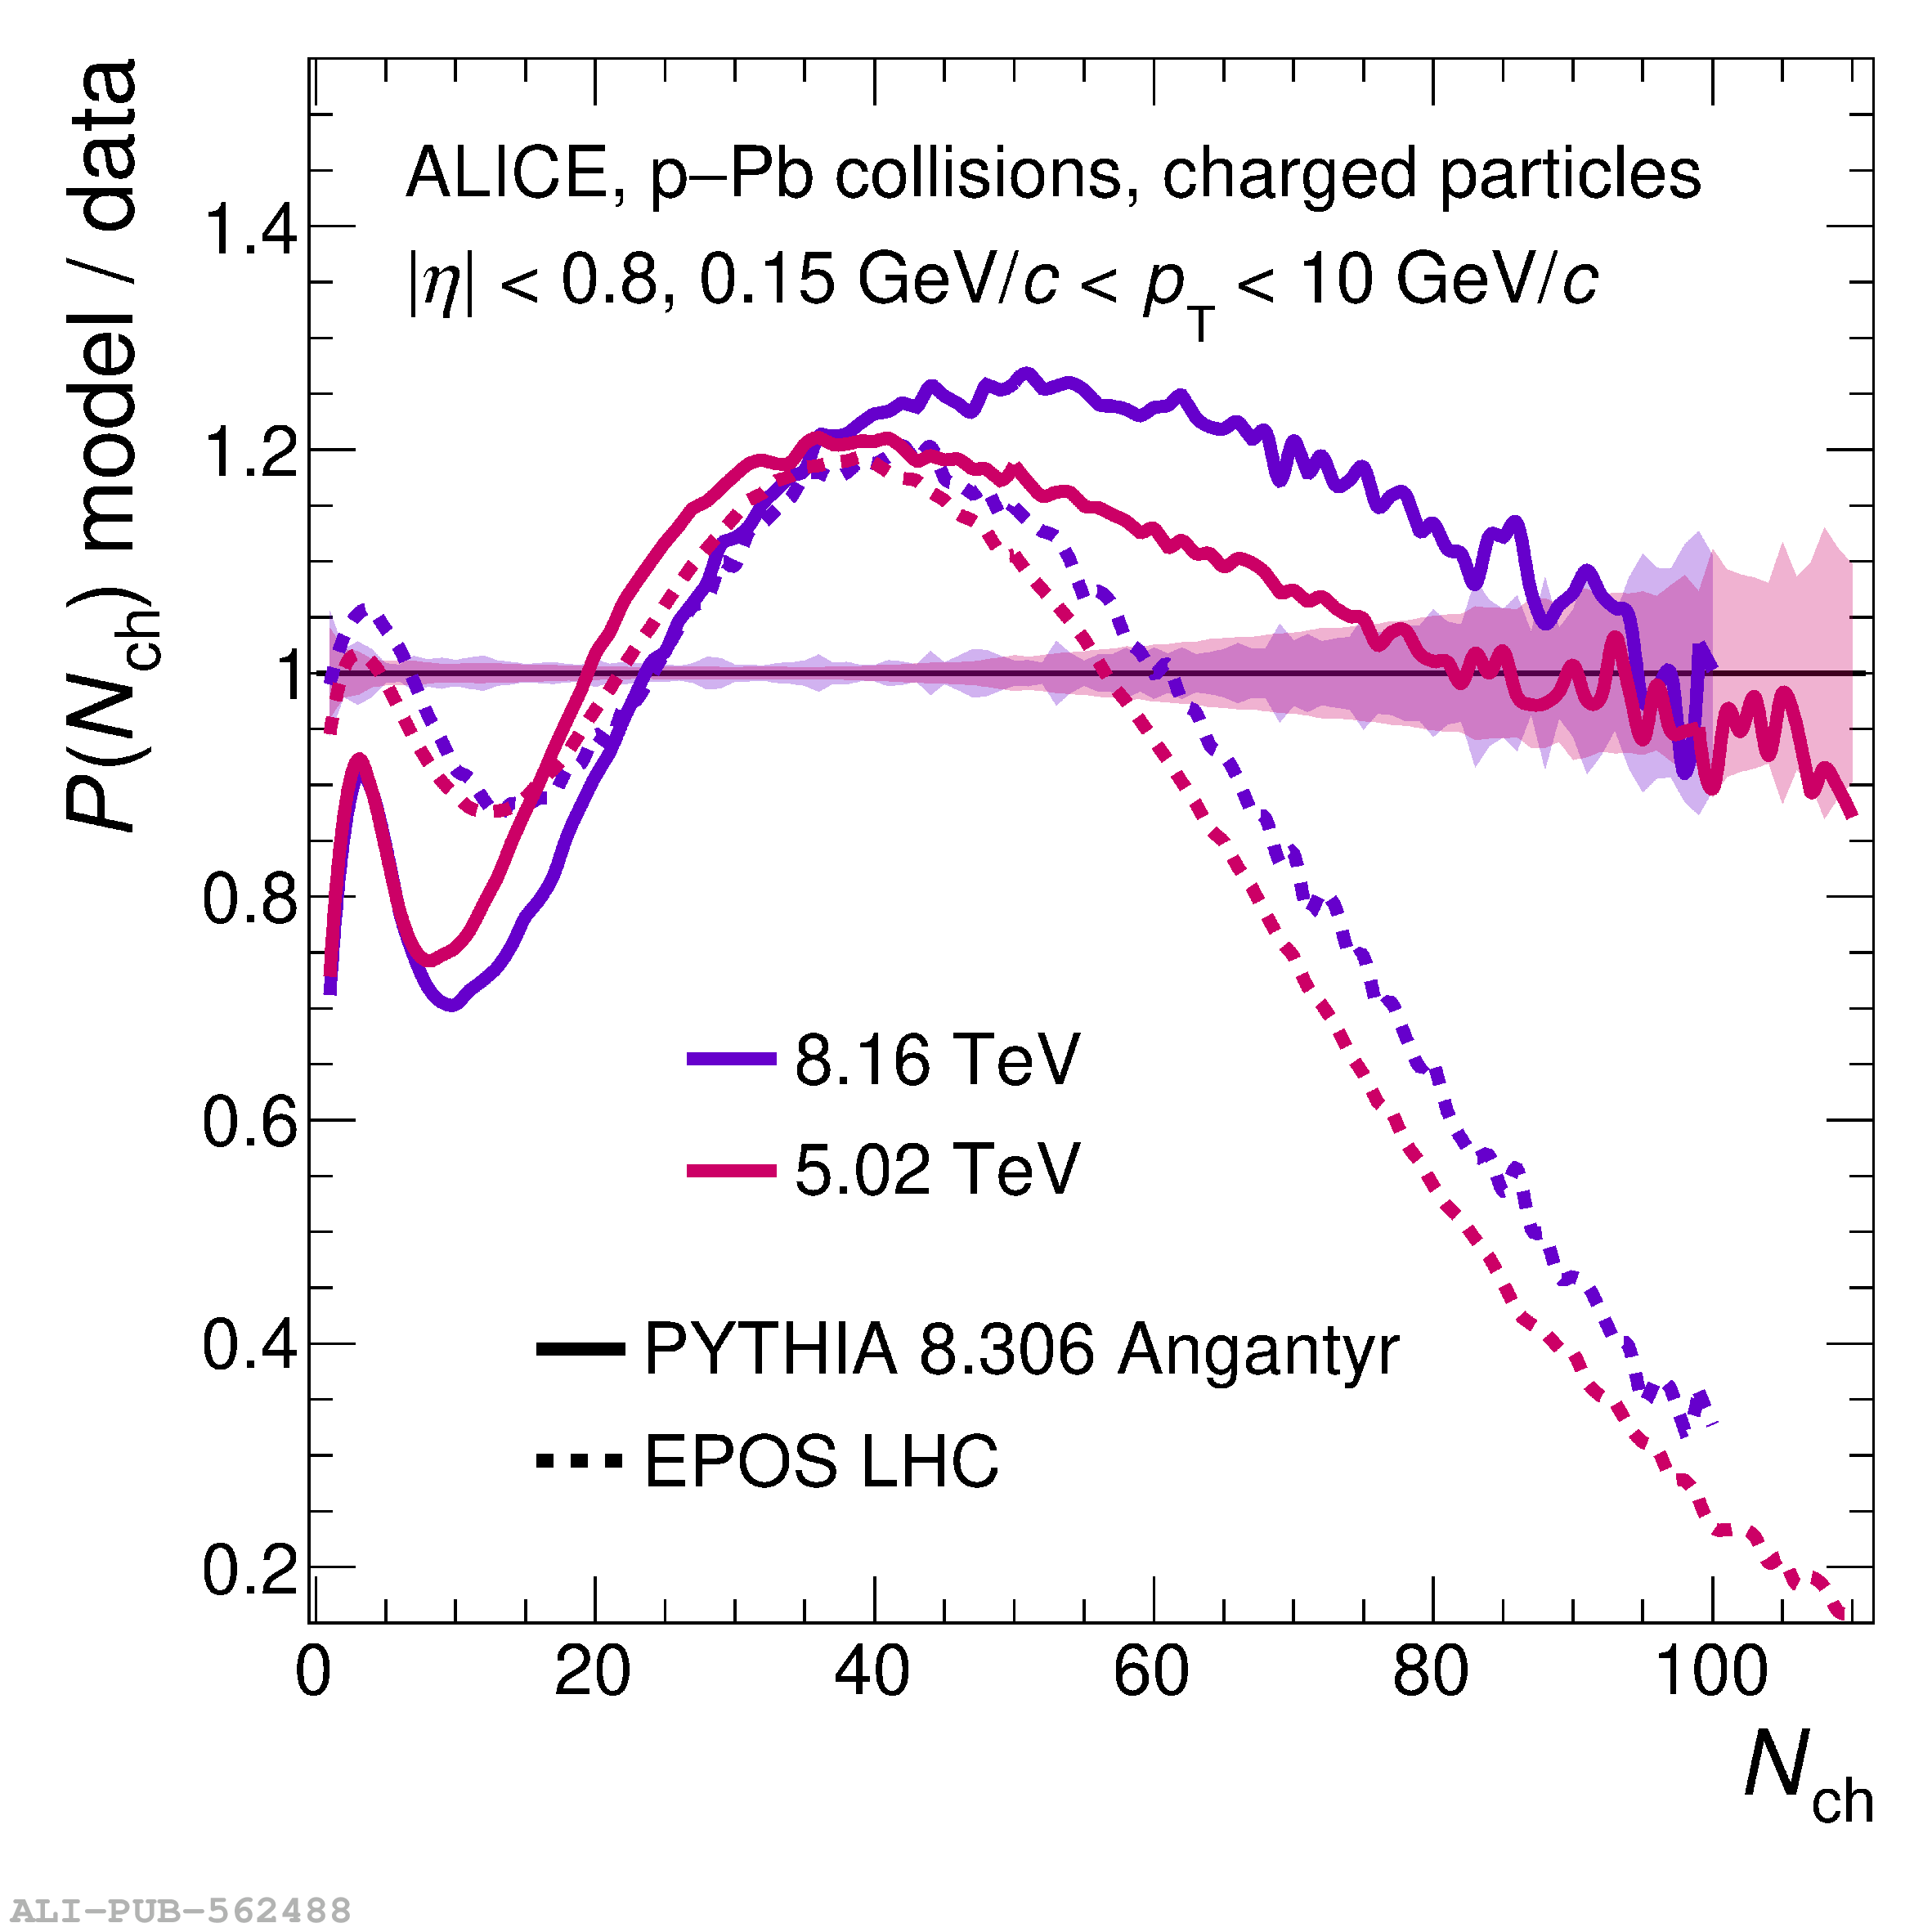 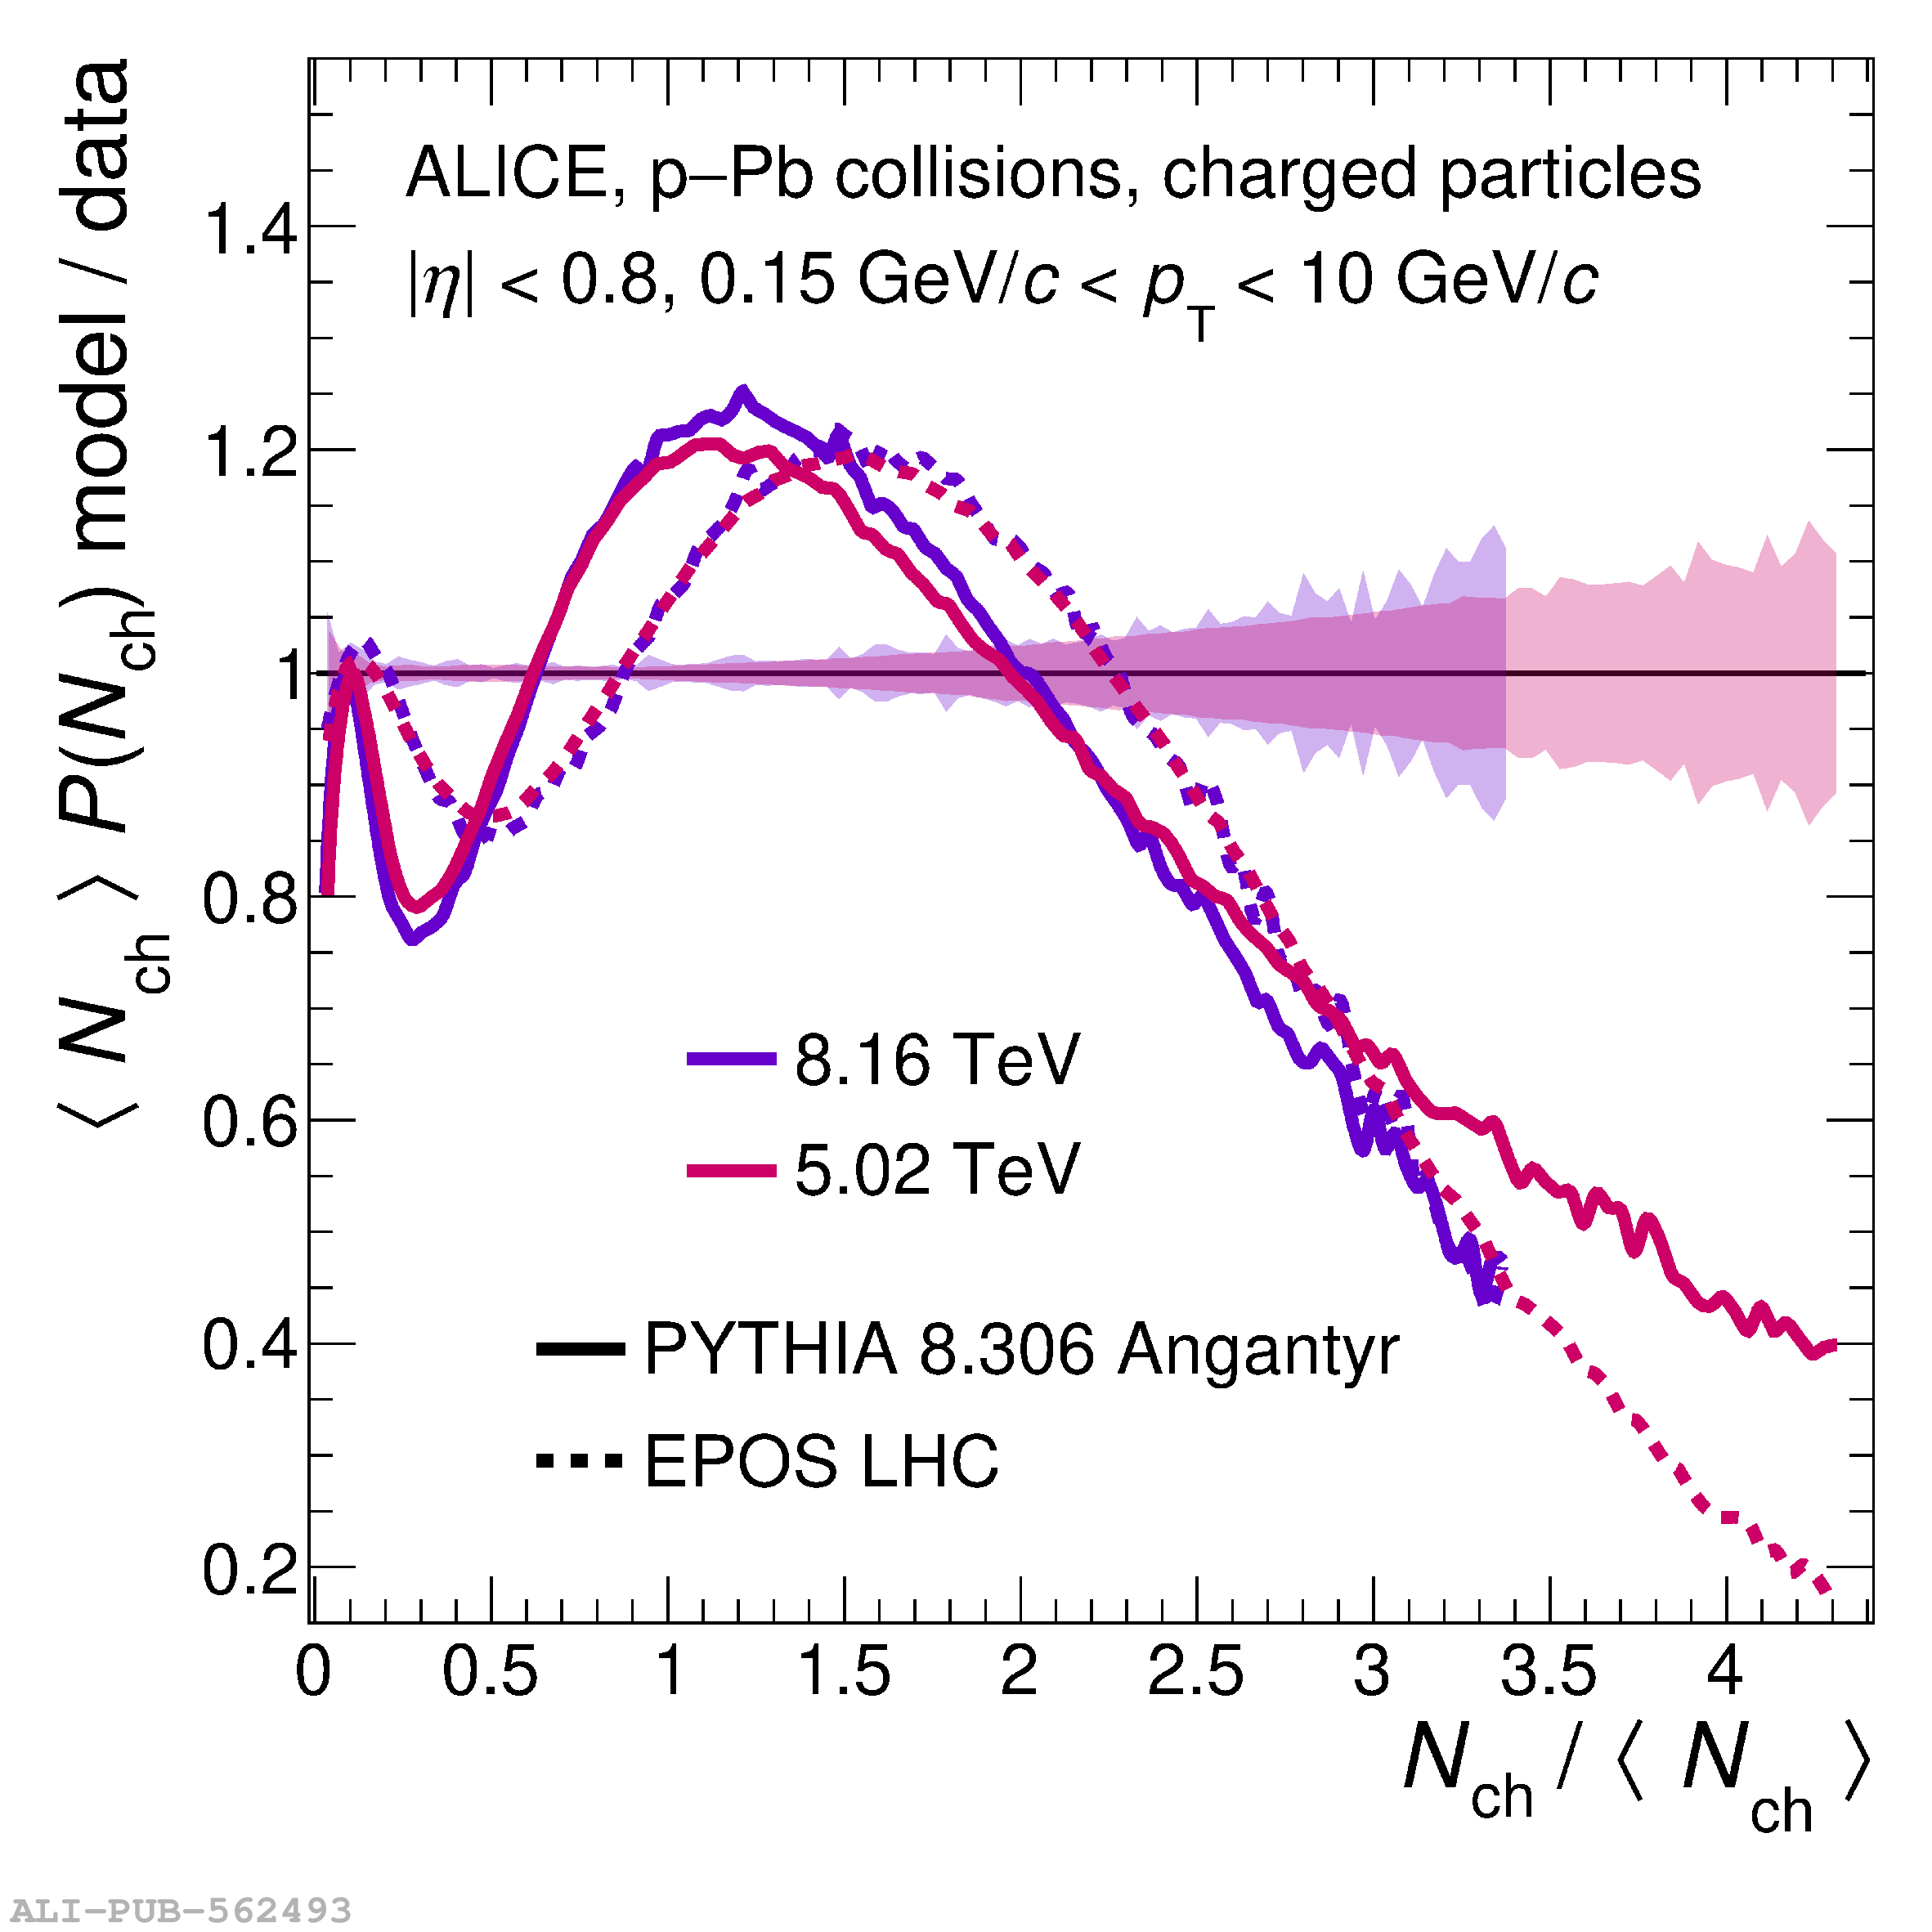  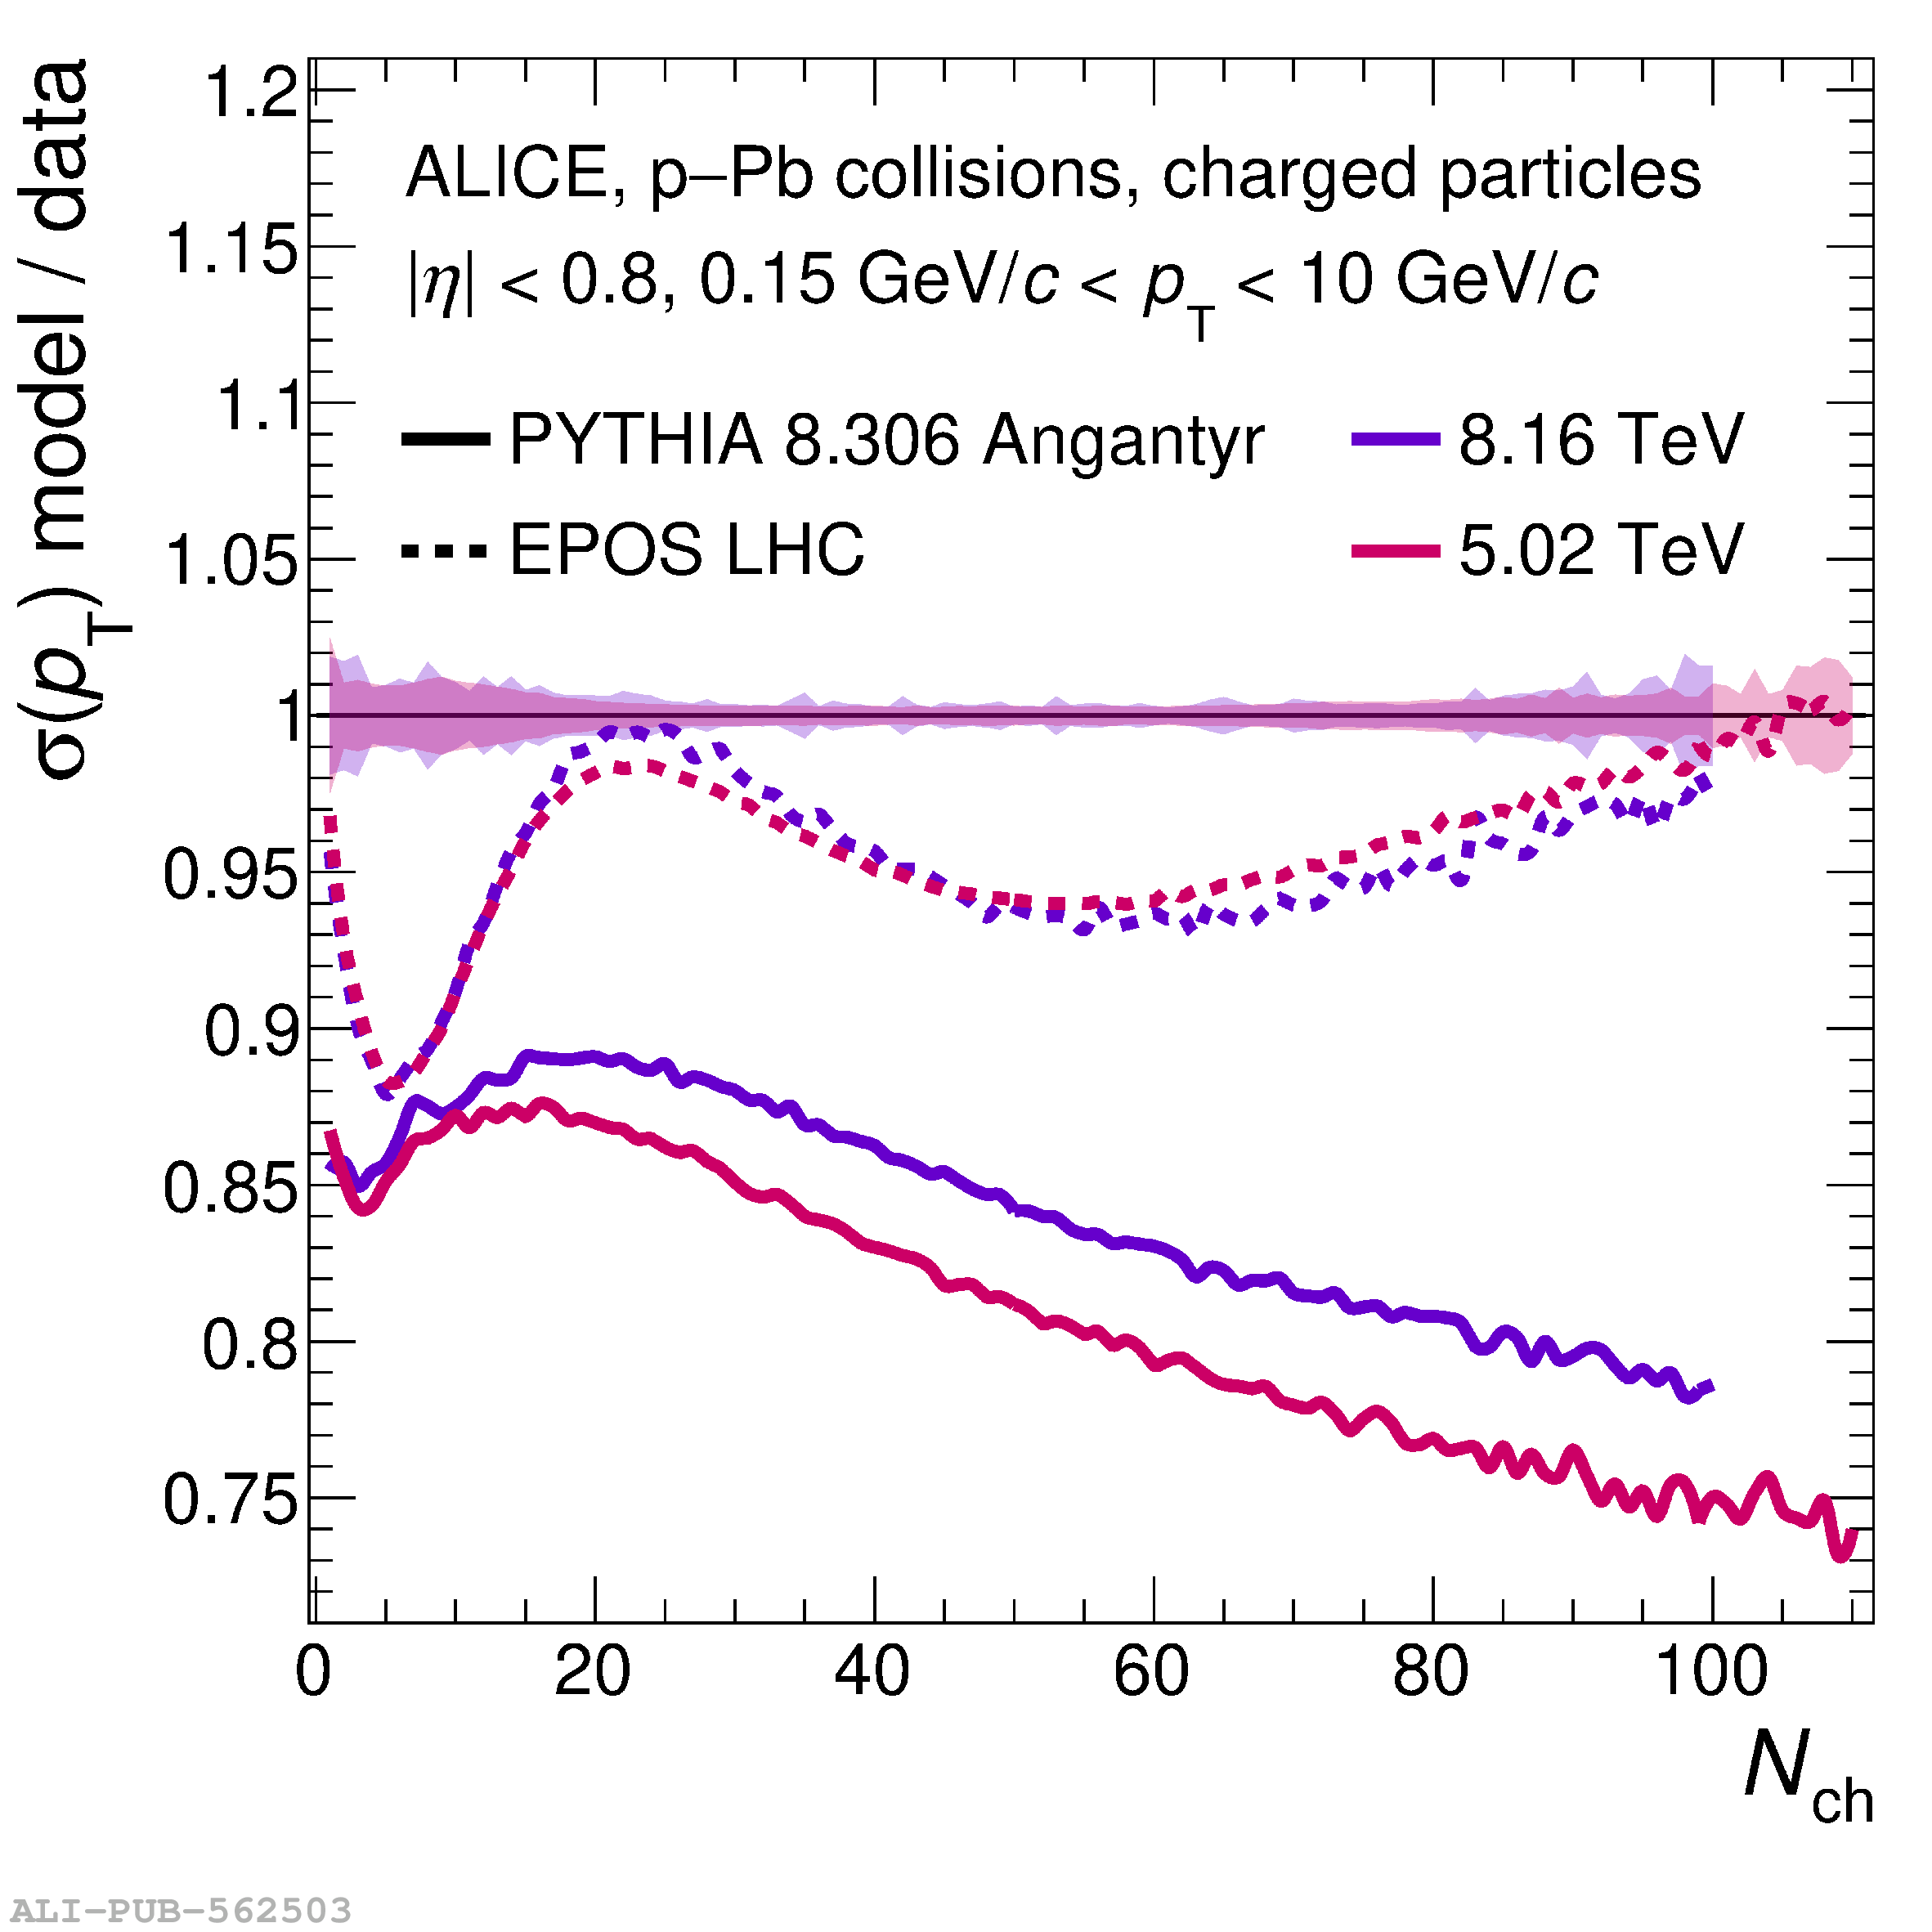 |
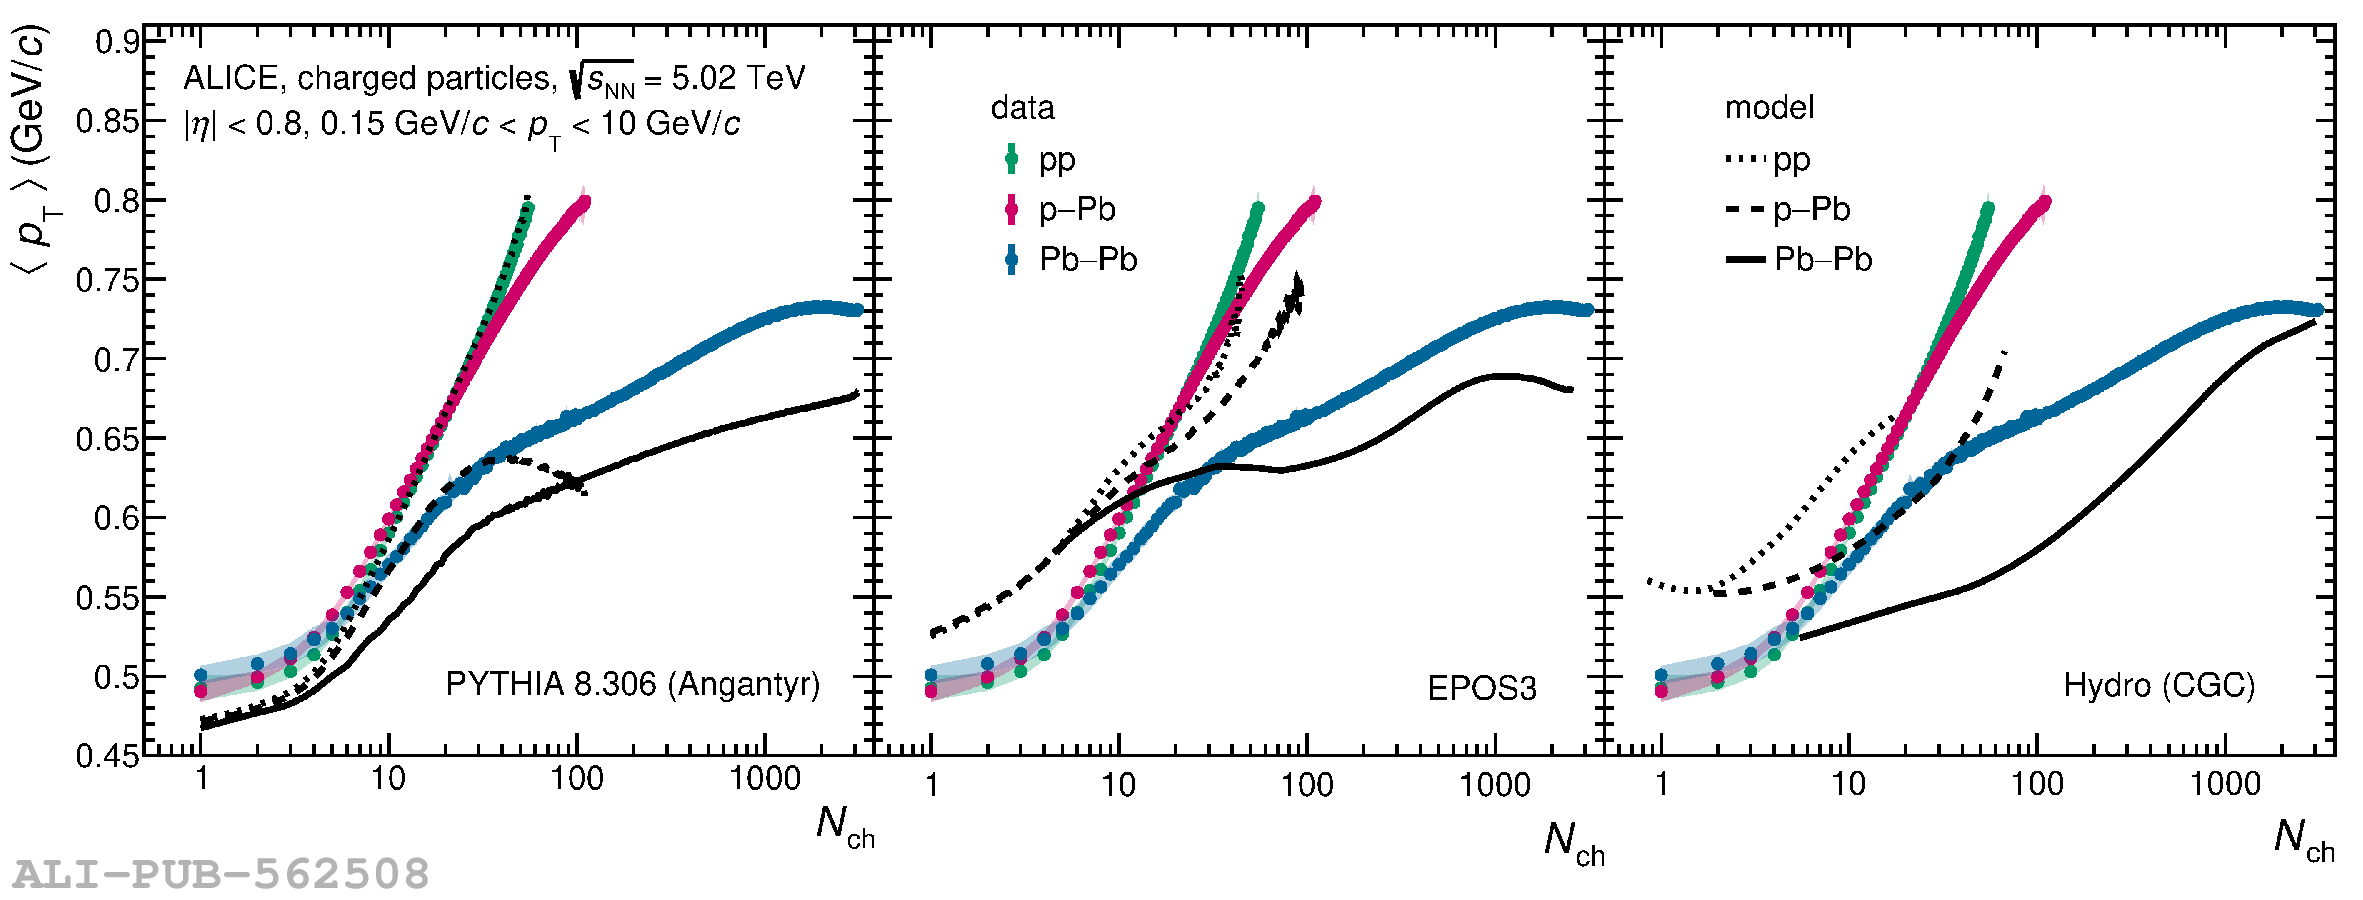
Figure 13
Average transverse momentum $\langle \pt \rangle$ as a function of the scaling variable $(W/W_0)^{\lambda/(\lambda + 2)} \sqrt{\nch / S_\textrm{T}}$ for pp and p$-$Pb collisions at various energies (left) and the ratio of all data sets to that in pp collisions at 13 TeV (right). The reference energy $W_0$ corresponds to $\sqrt{s}$ = 7 TeV for pp and $\sqrt{s_{\rm NN}}$ = 5.02 TeV for p$-$Pb collisions. Statistical and systematic uncertainties are shown as bars and semi-transparent bands, respectively. | 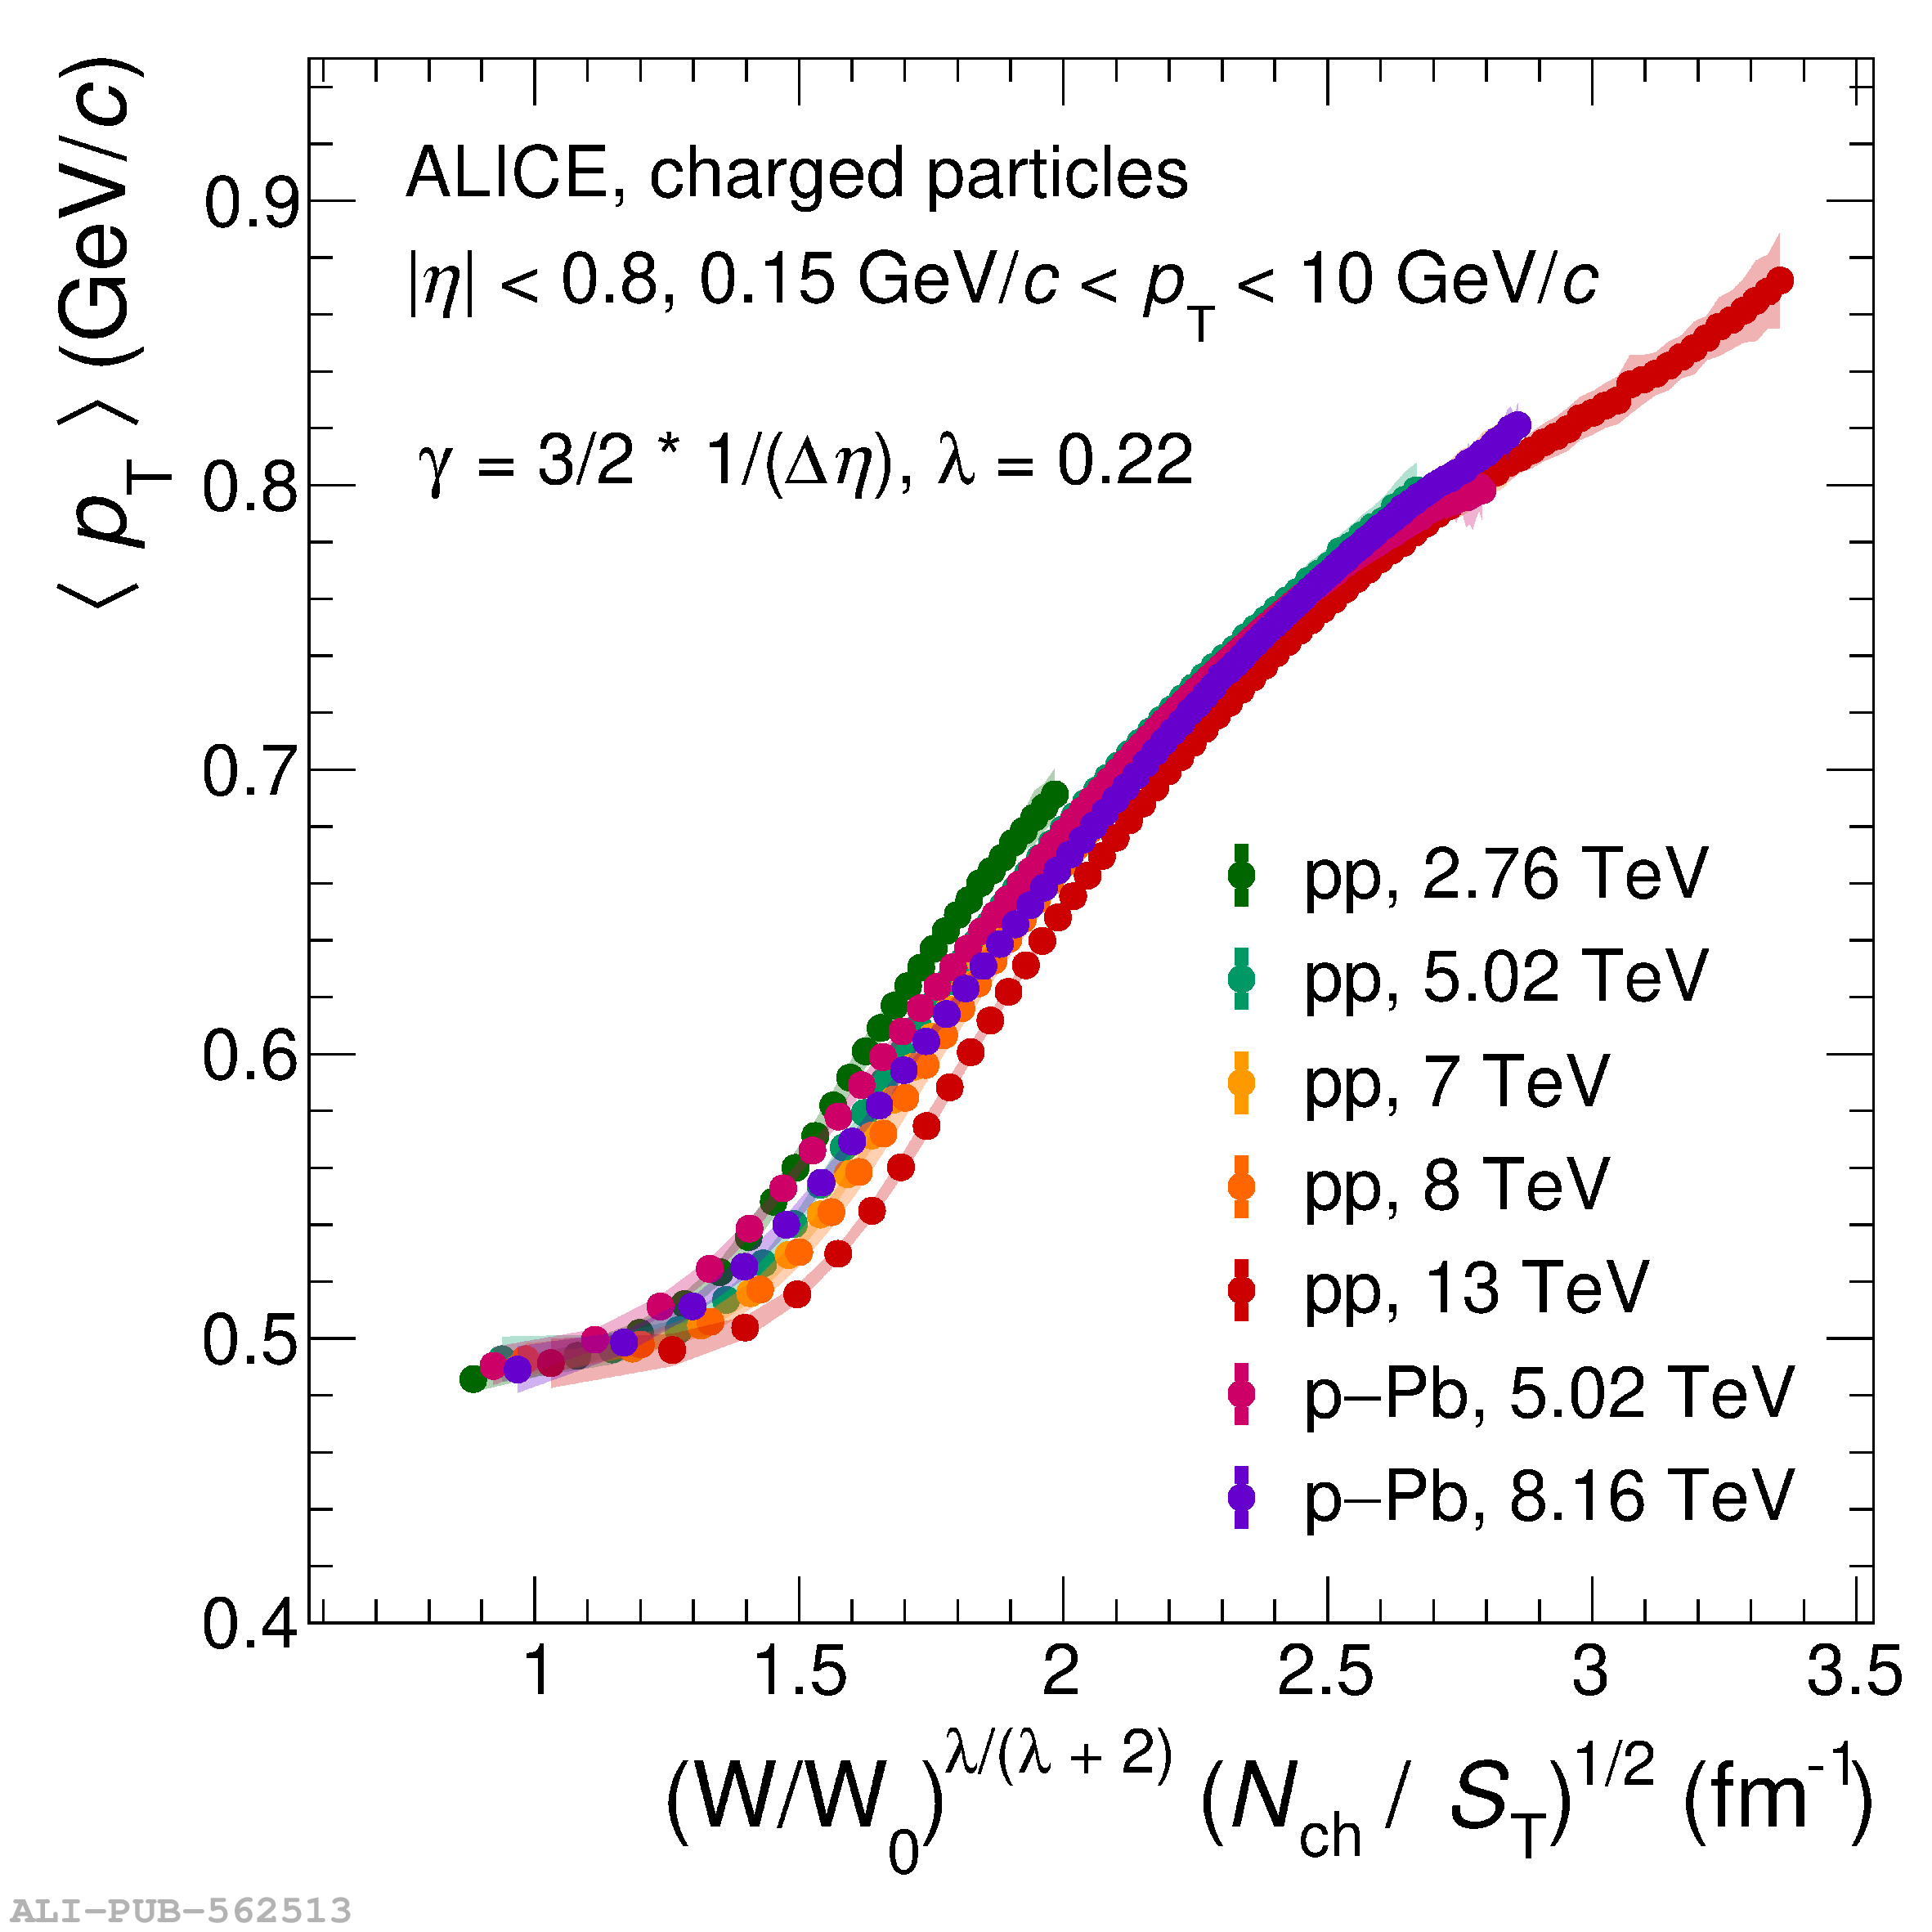 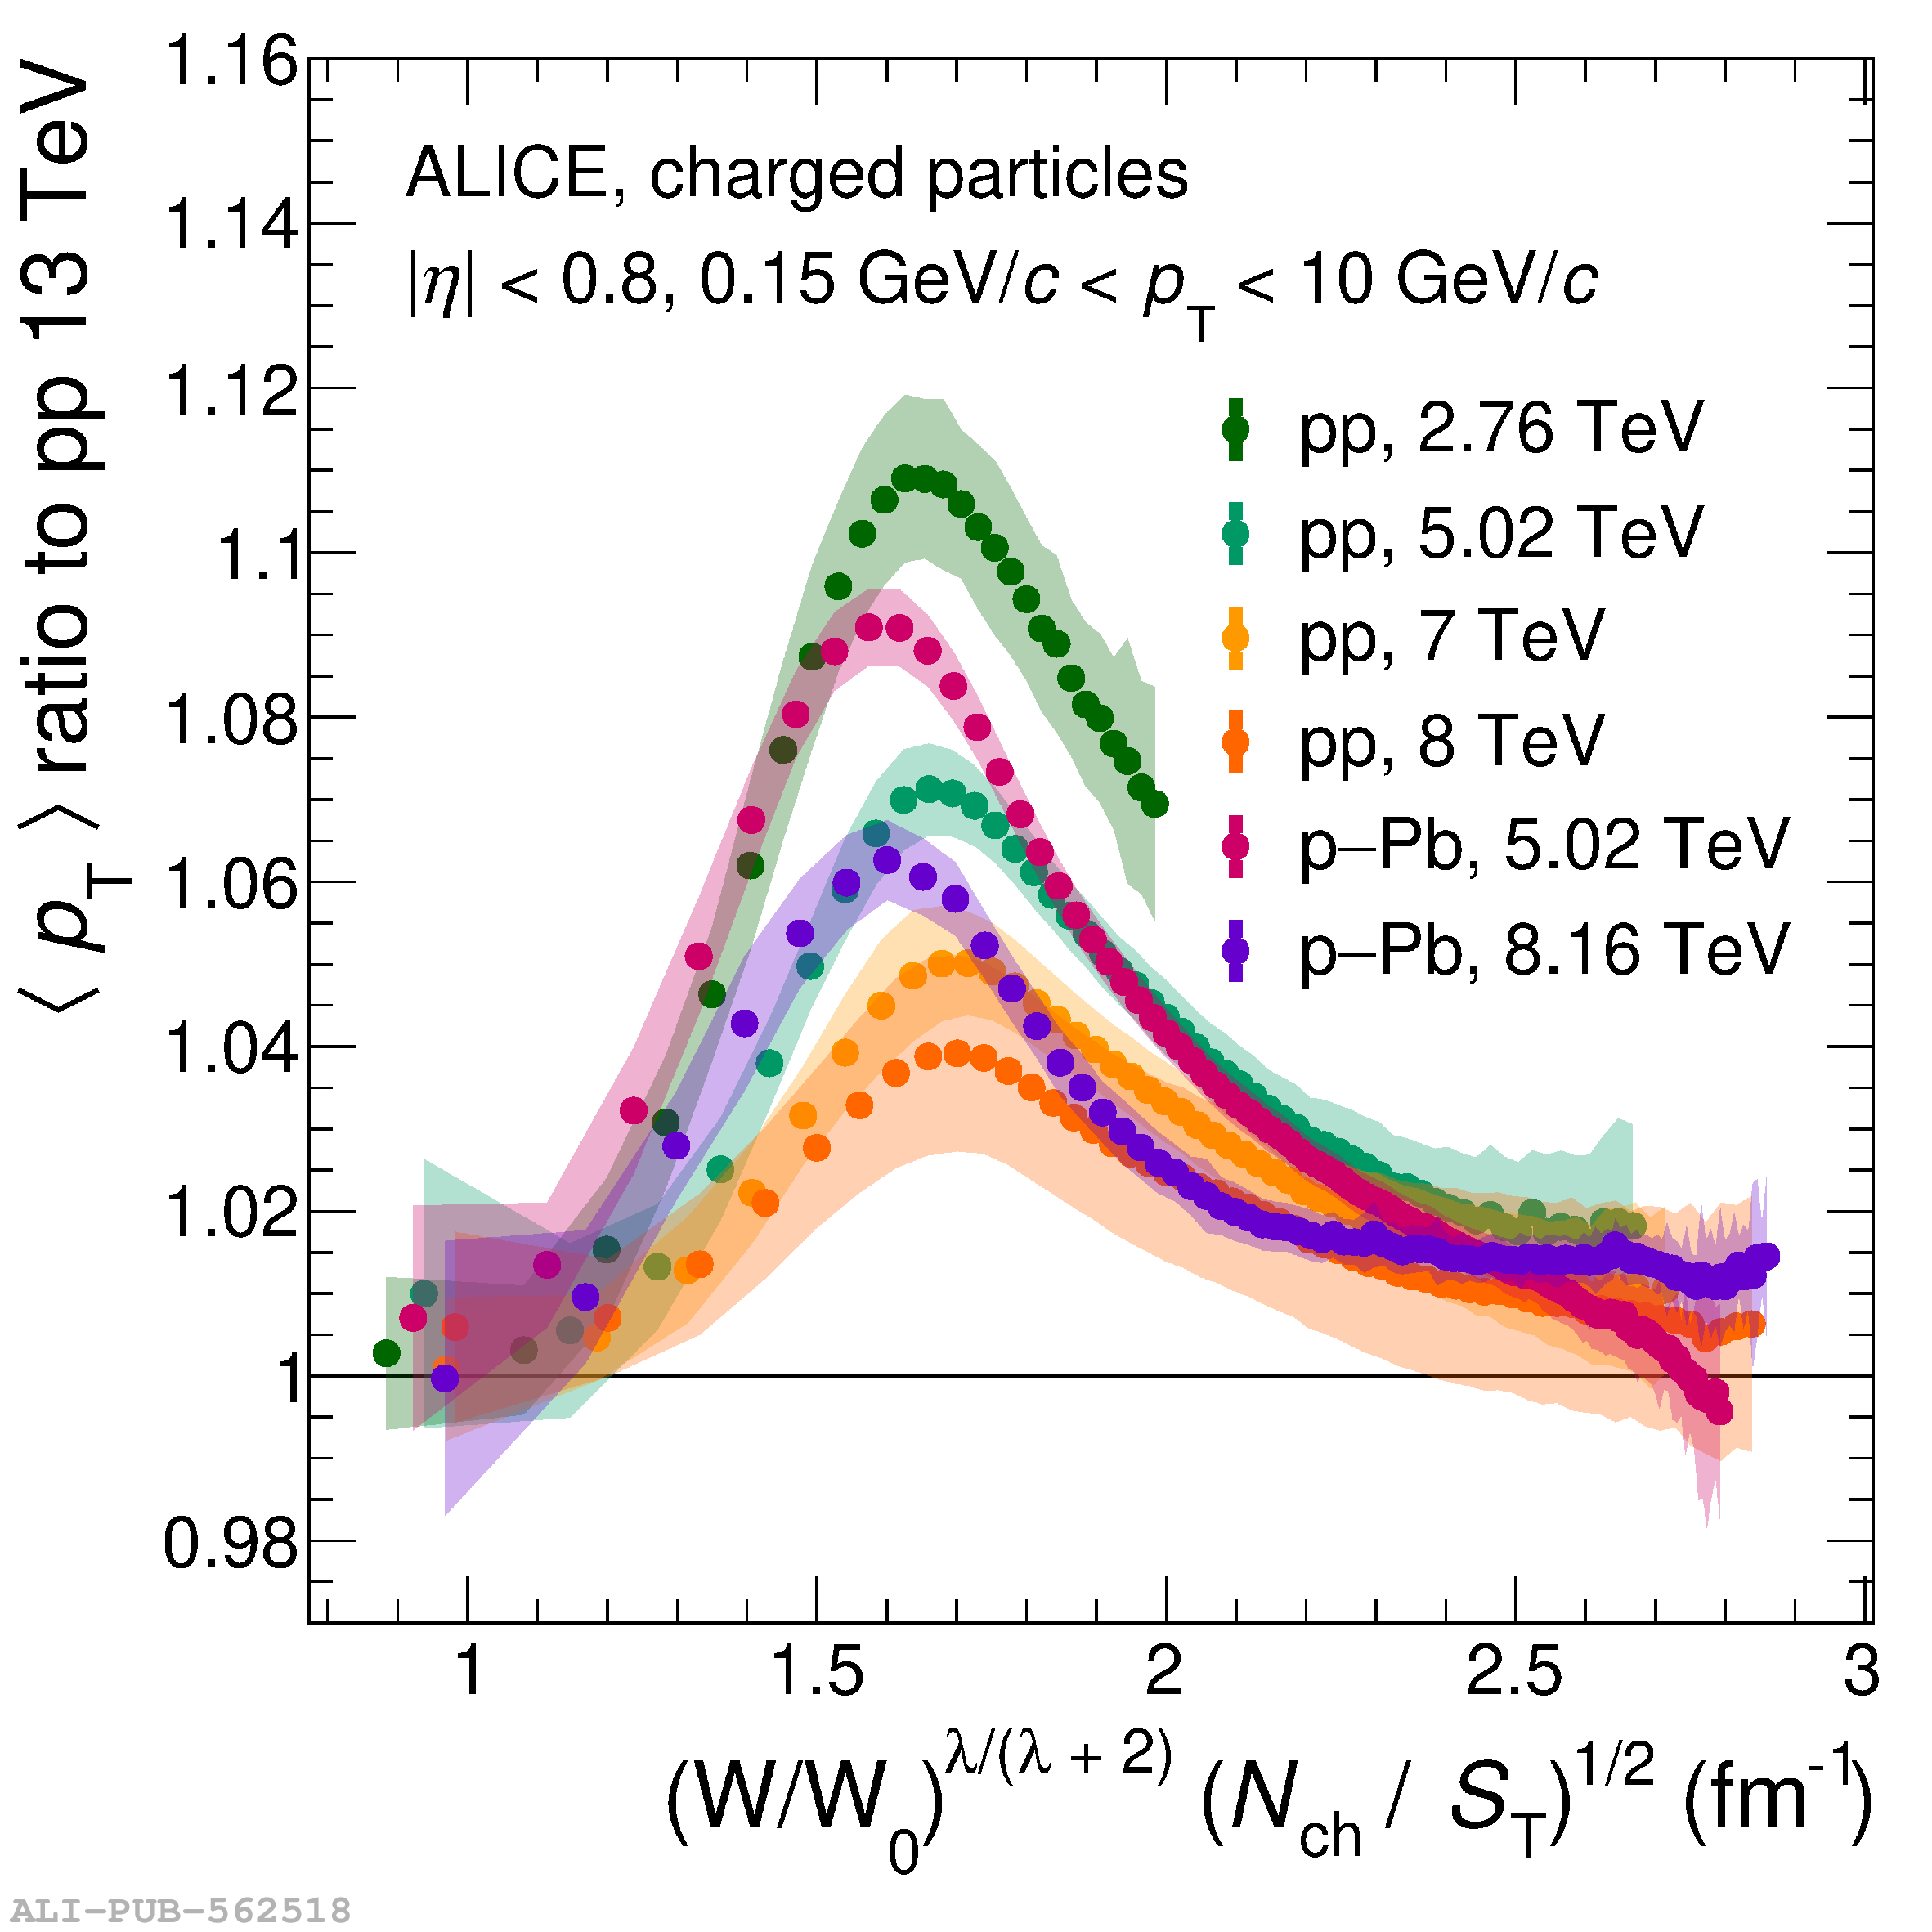 |