Mean (left) and standard deviation (right) of the charged-particle transverse momentum spectra as a function of the charged-particle multiplicity for pp (top), p$-$Pb (middle), and AA (bottom) collisions at different centre-of-mass energies per nucleon pair. Statistical and systematic uncertainties are shown as bars and semi-transparent bands, respectively. | 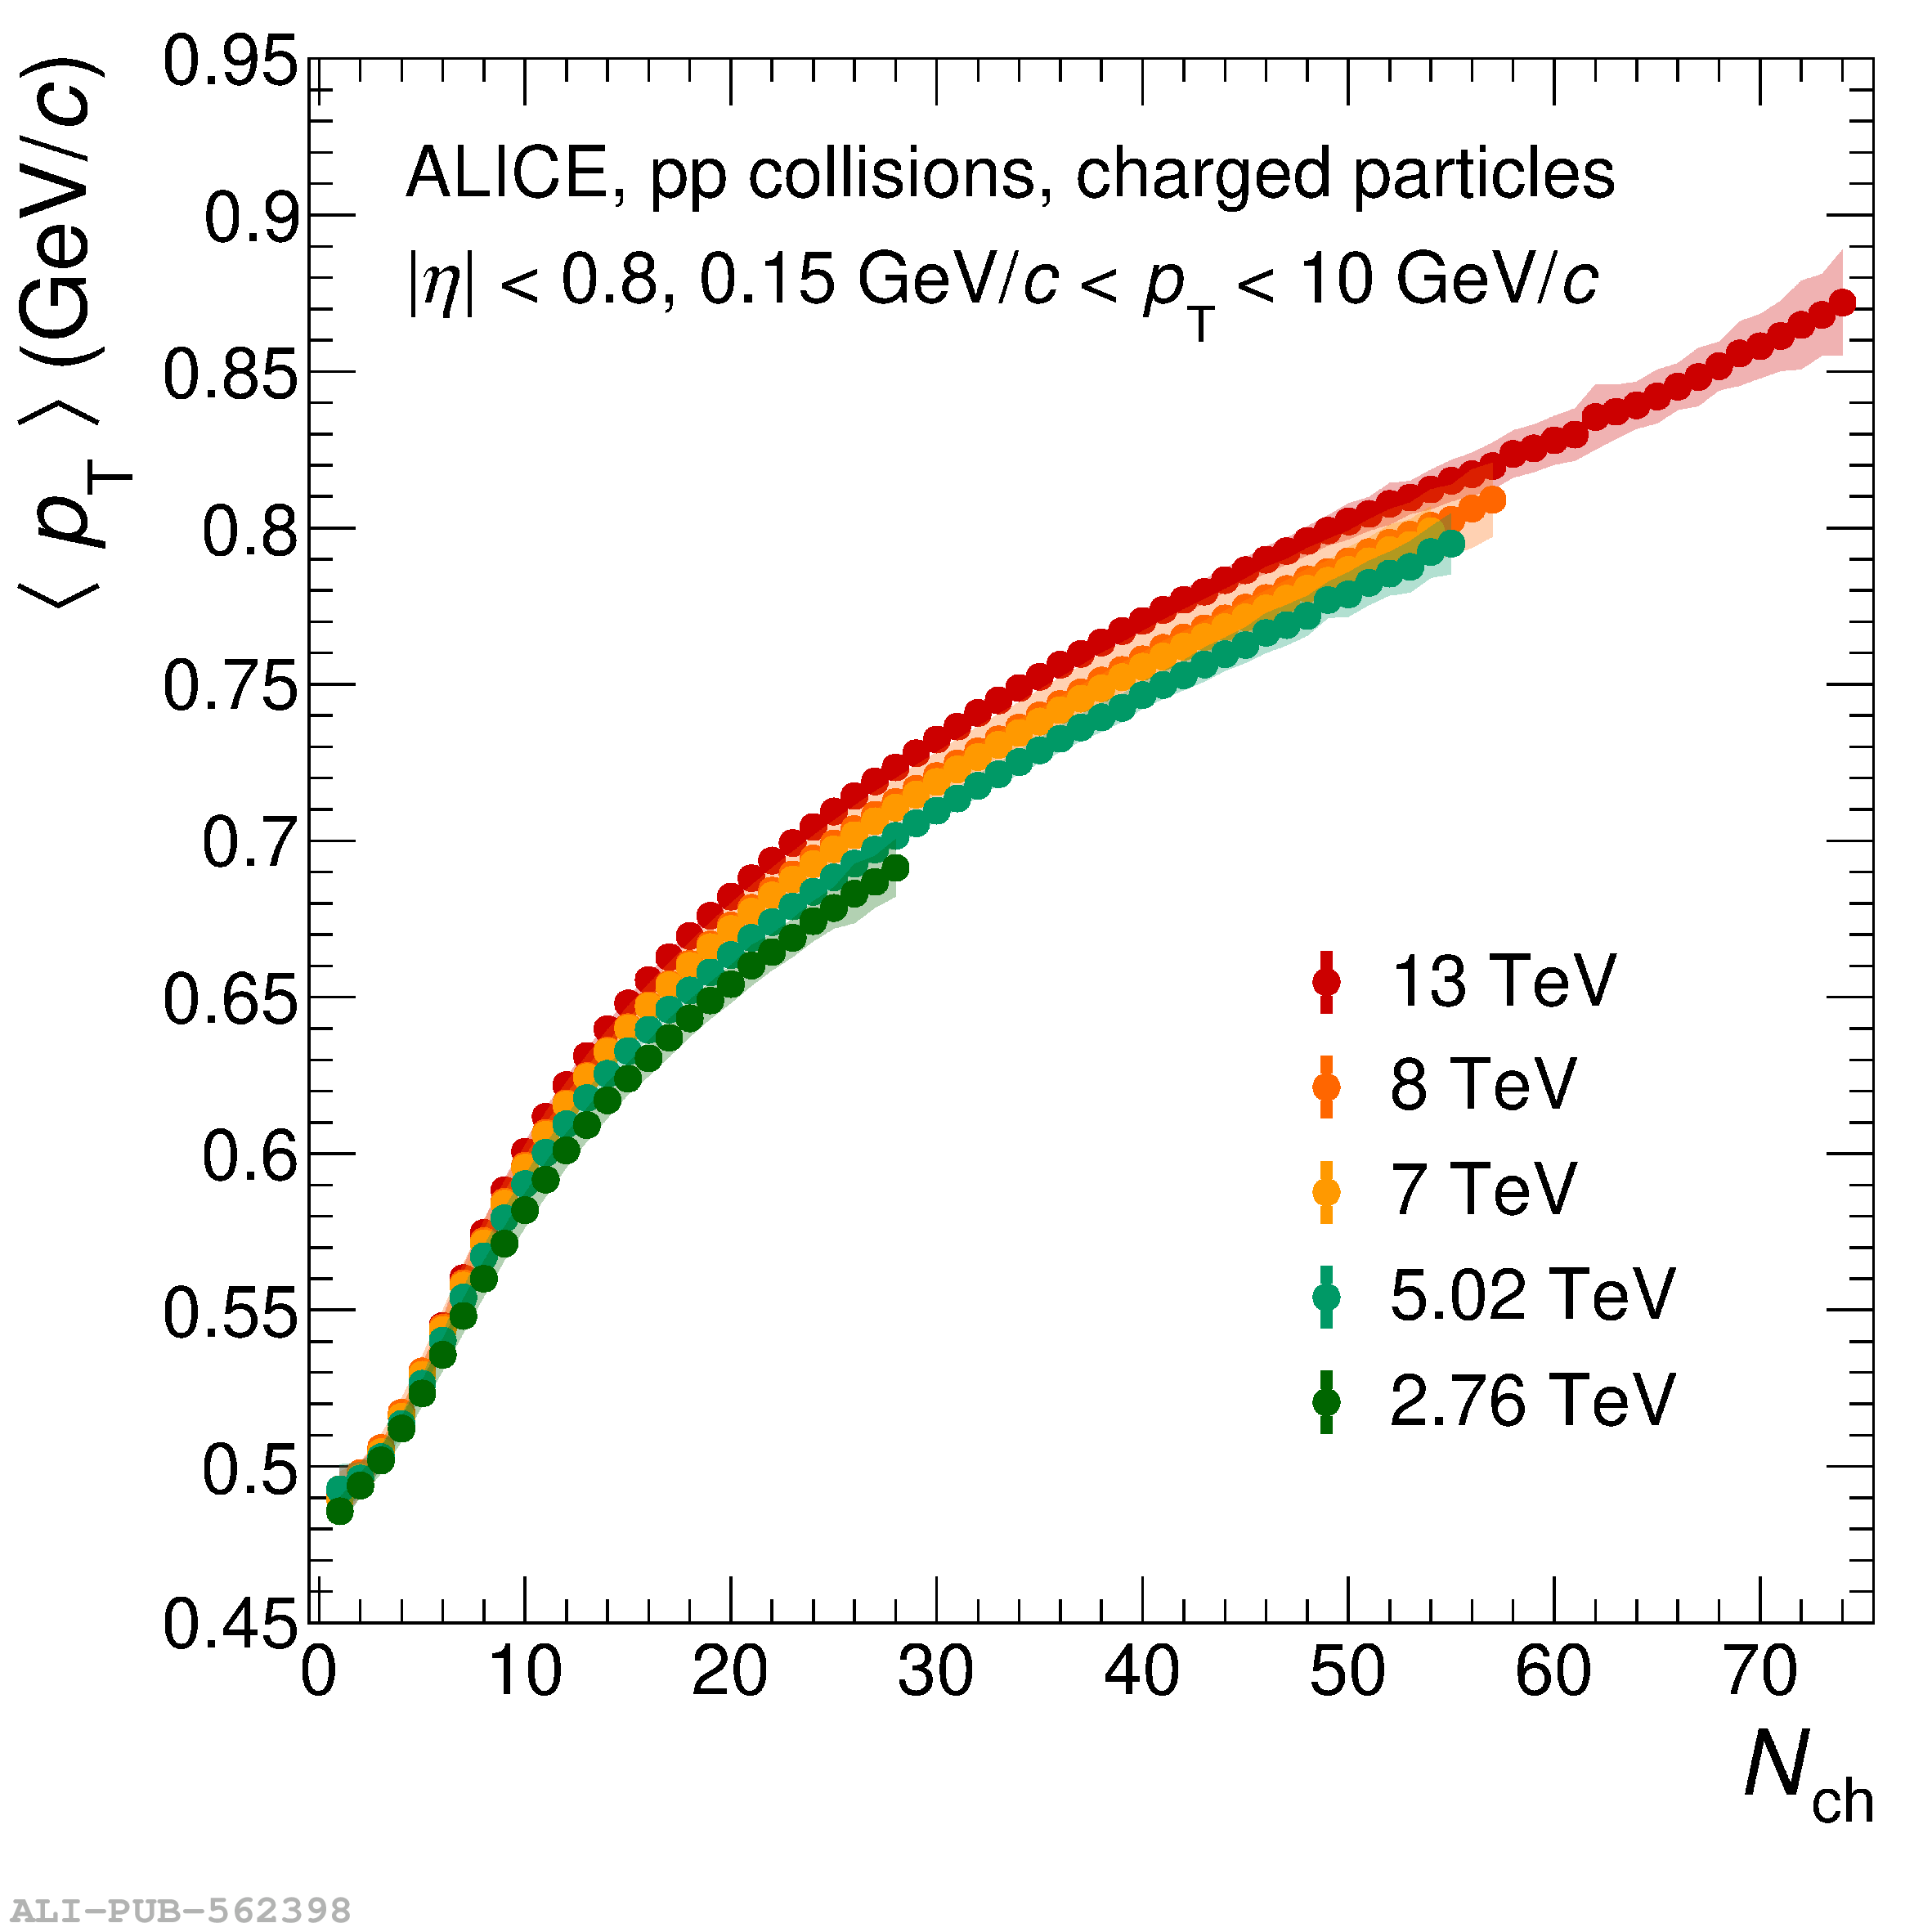 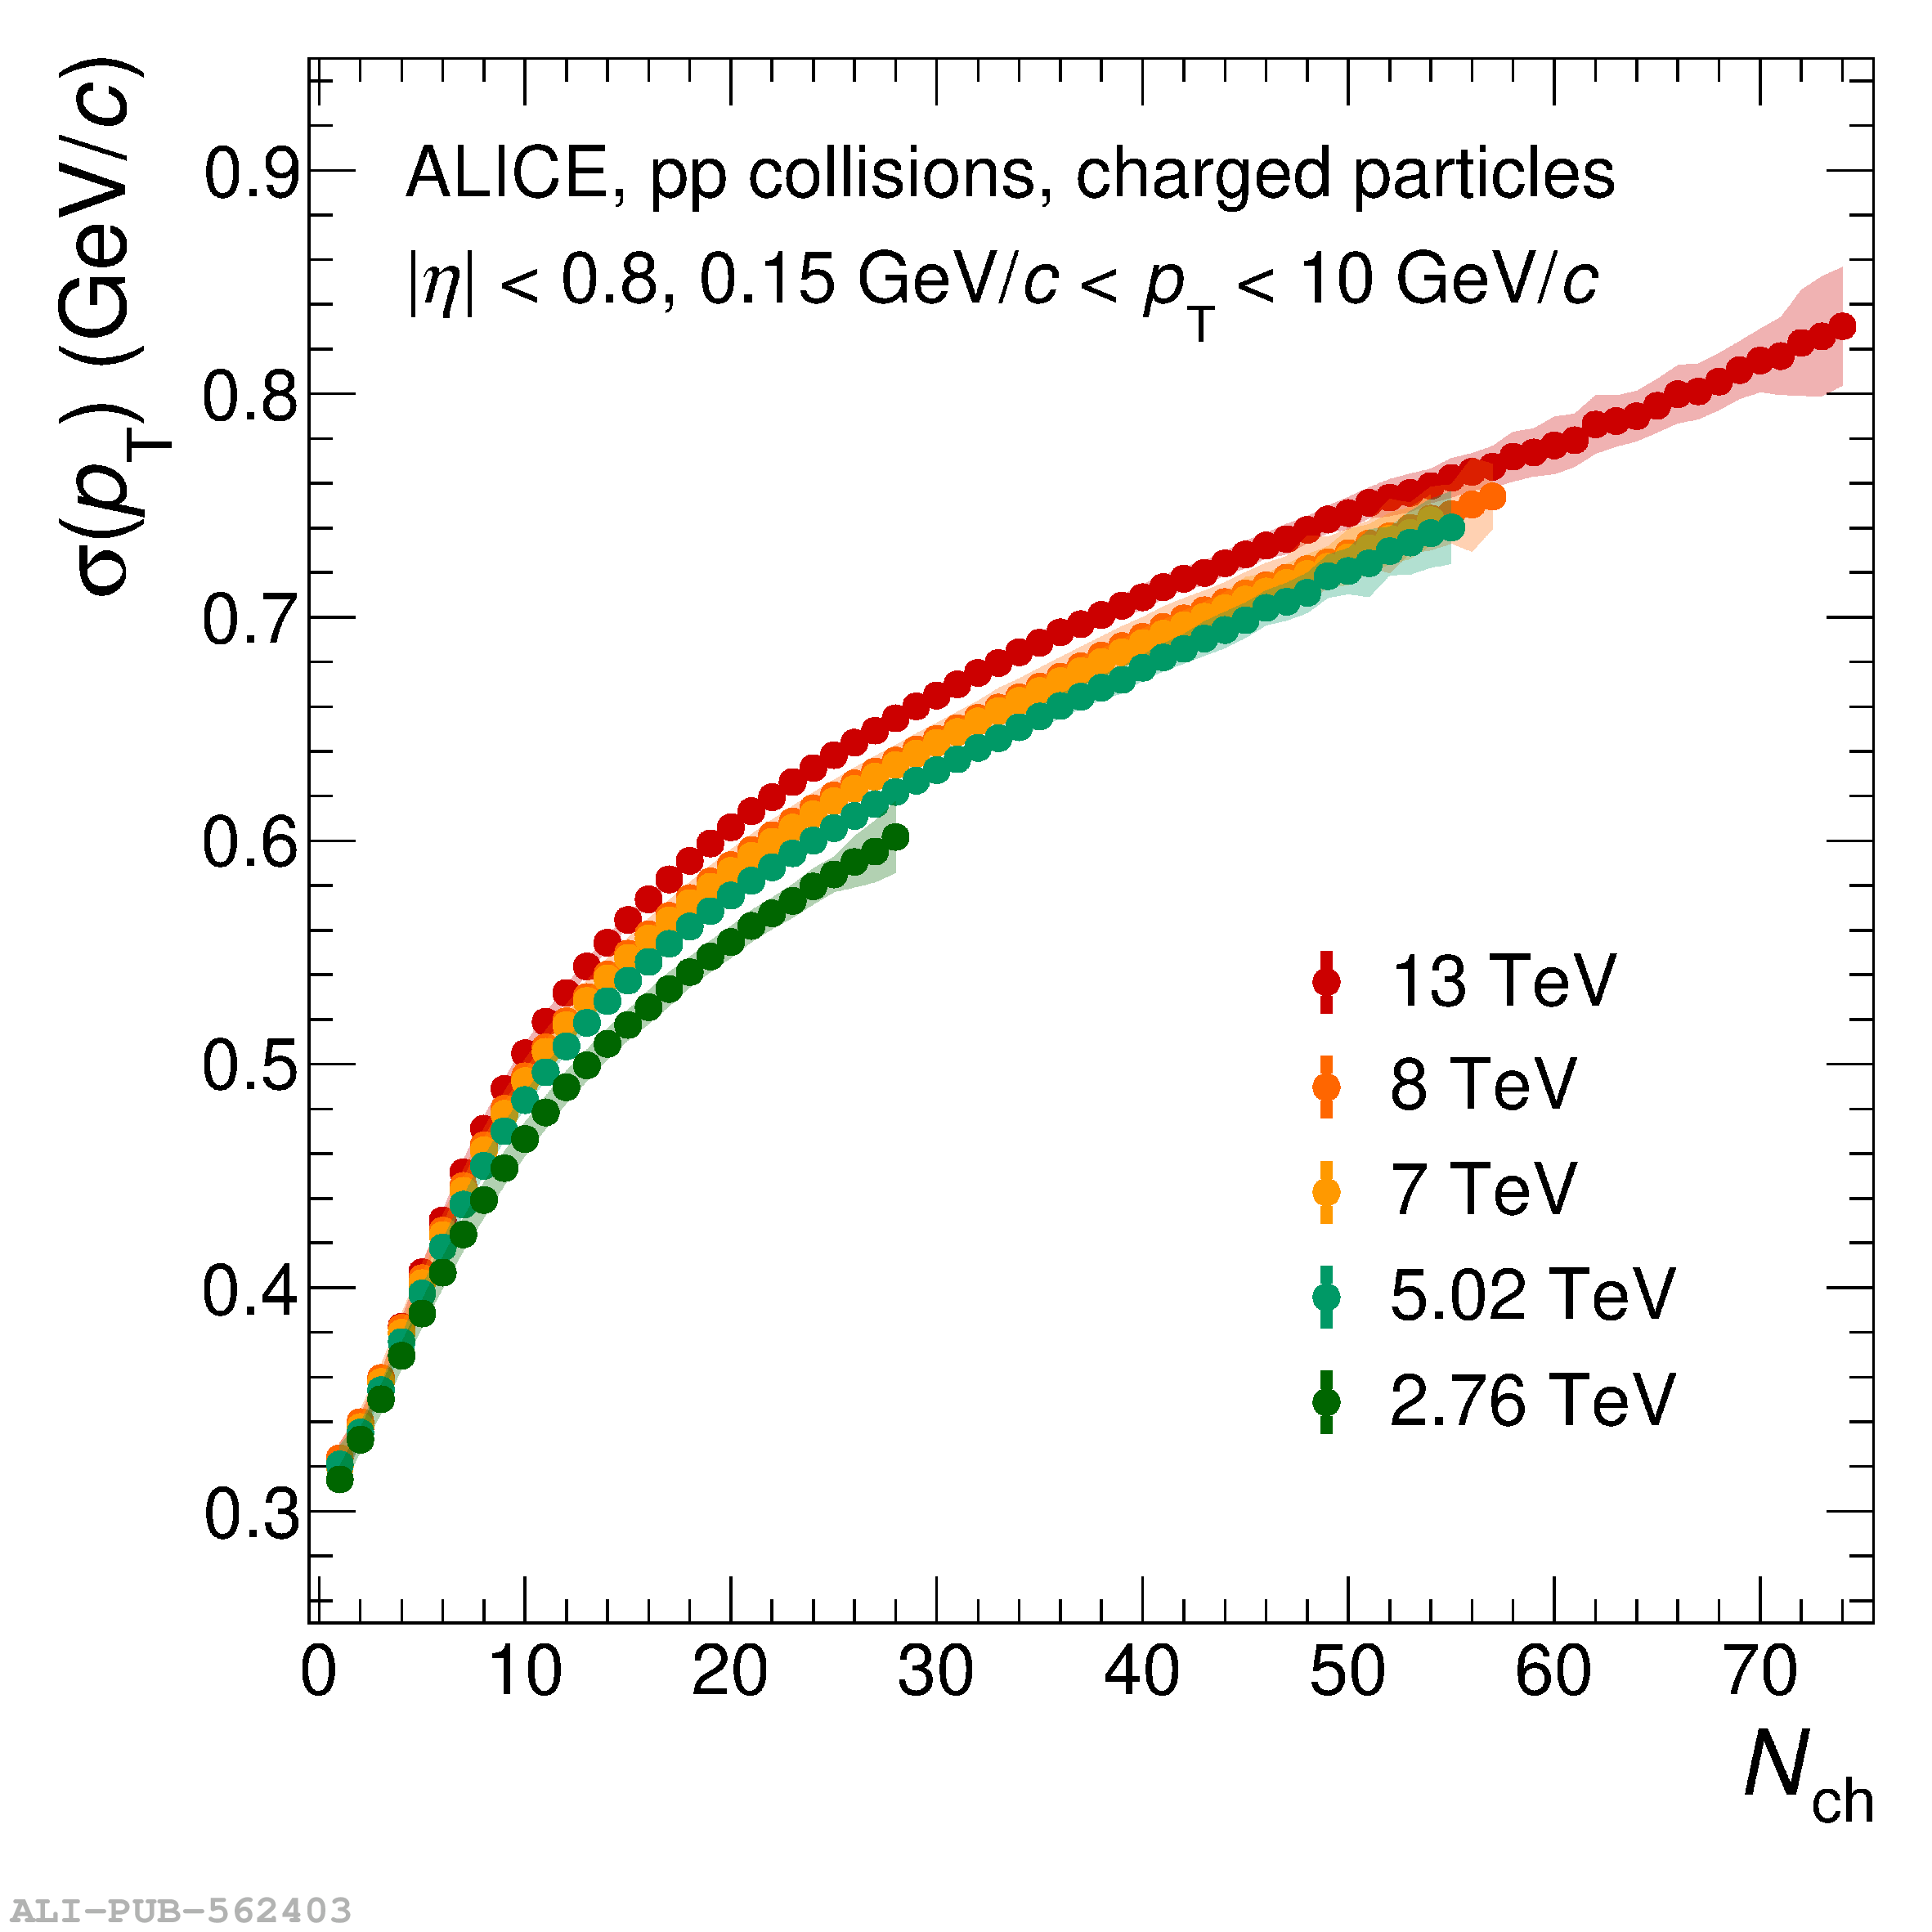 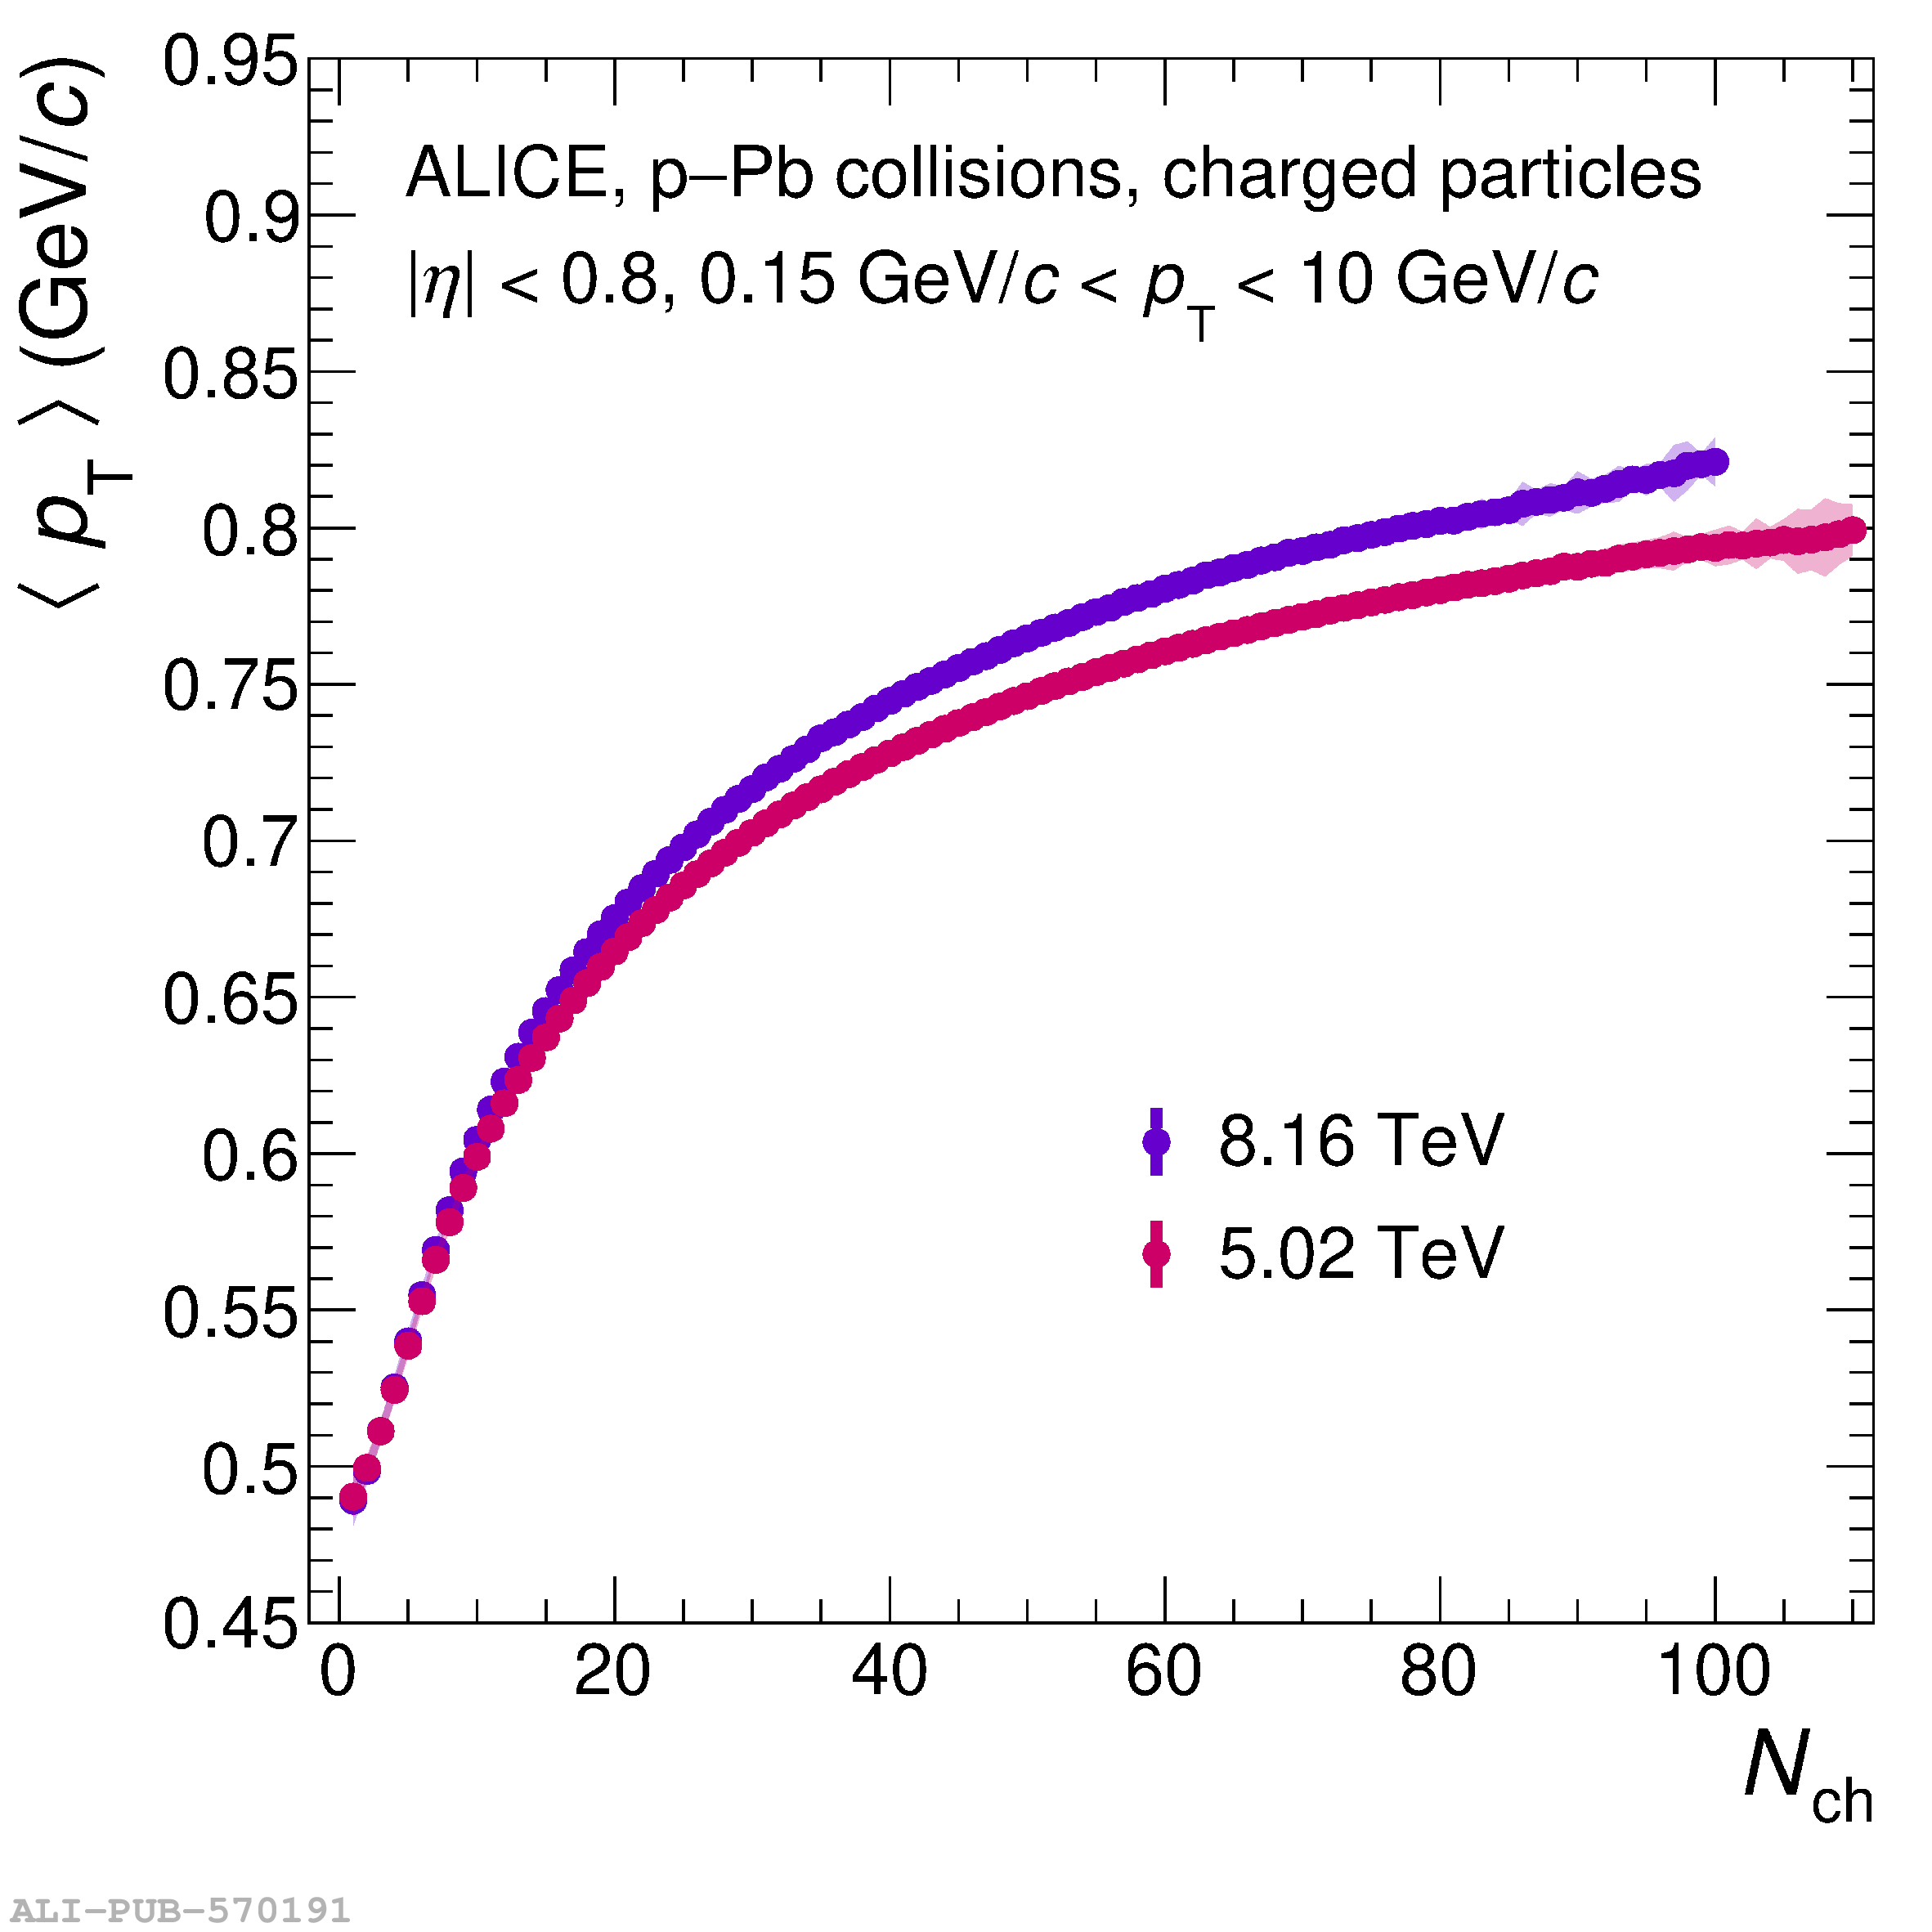 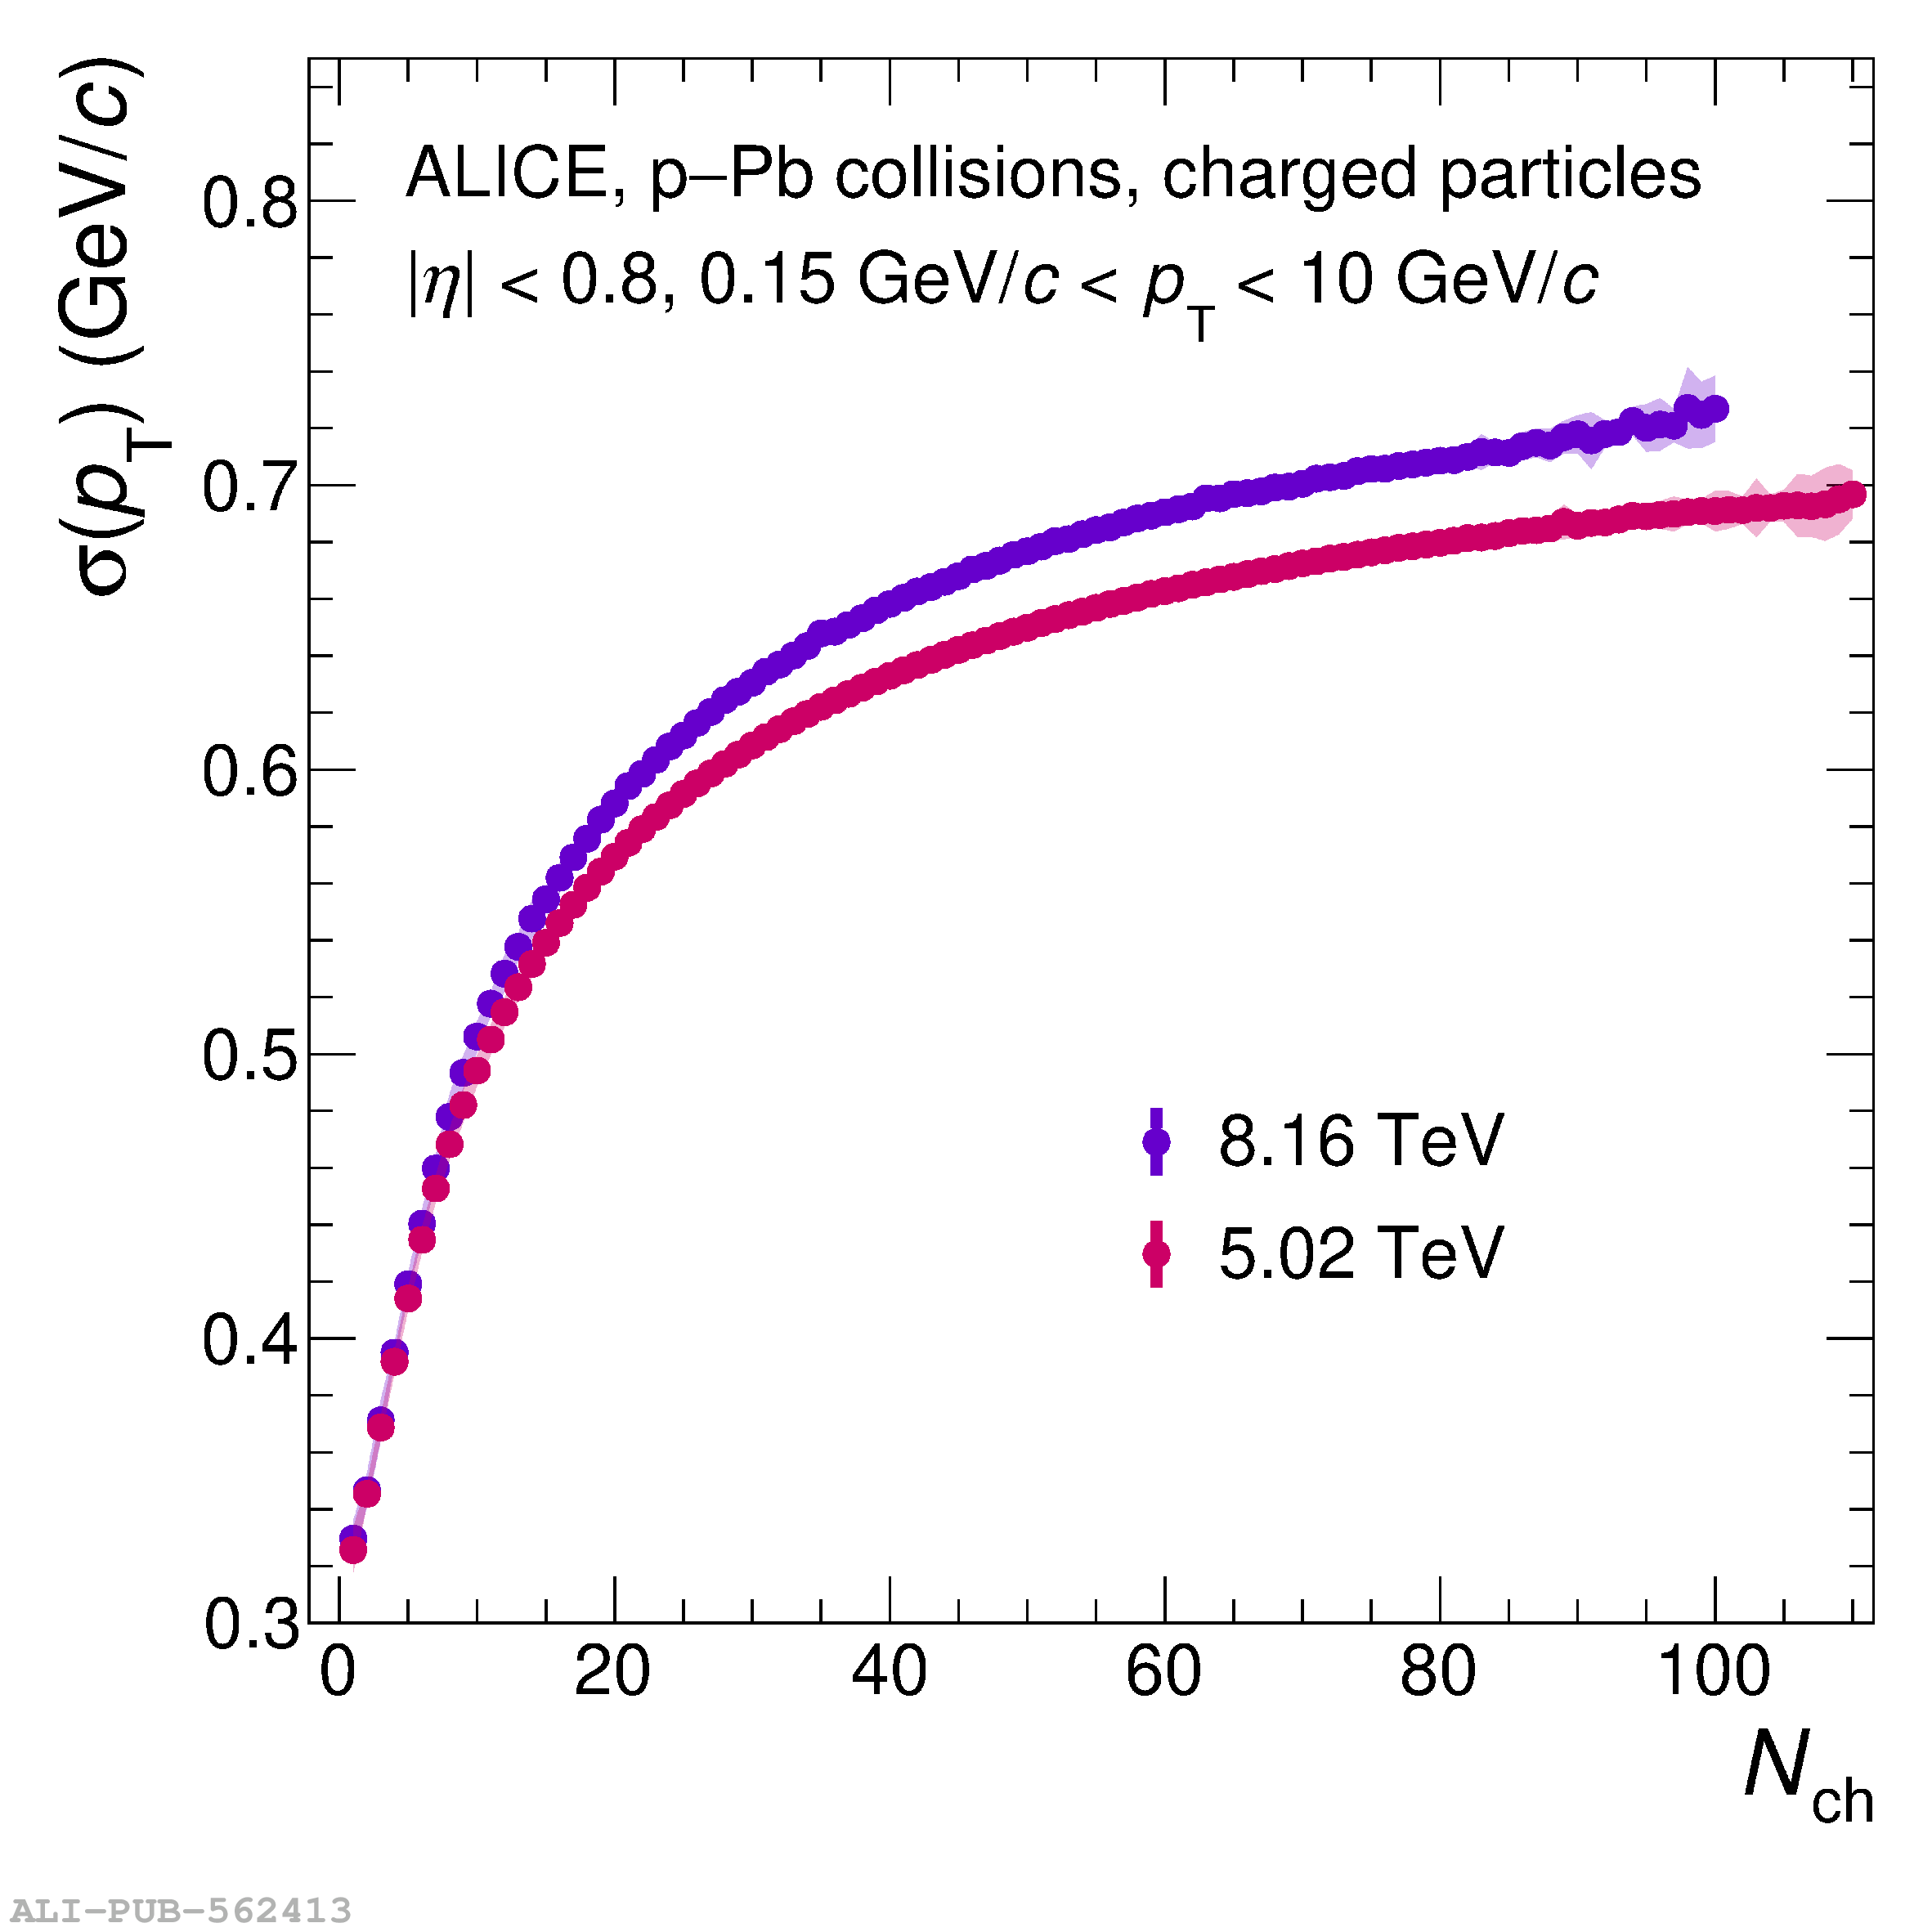  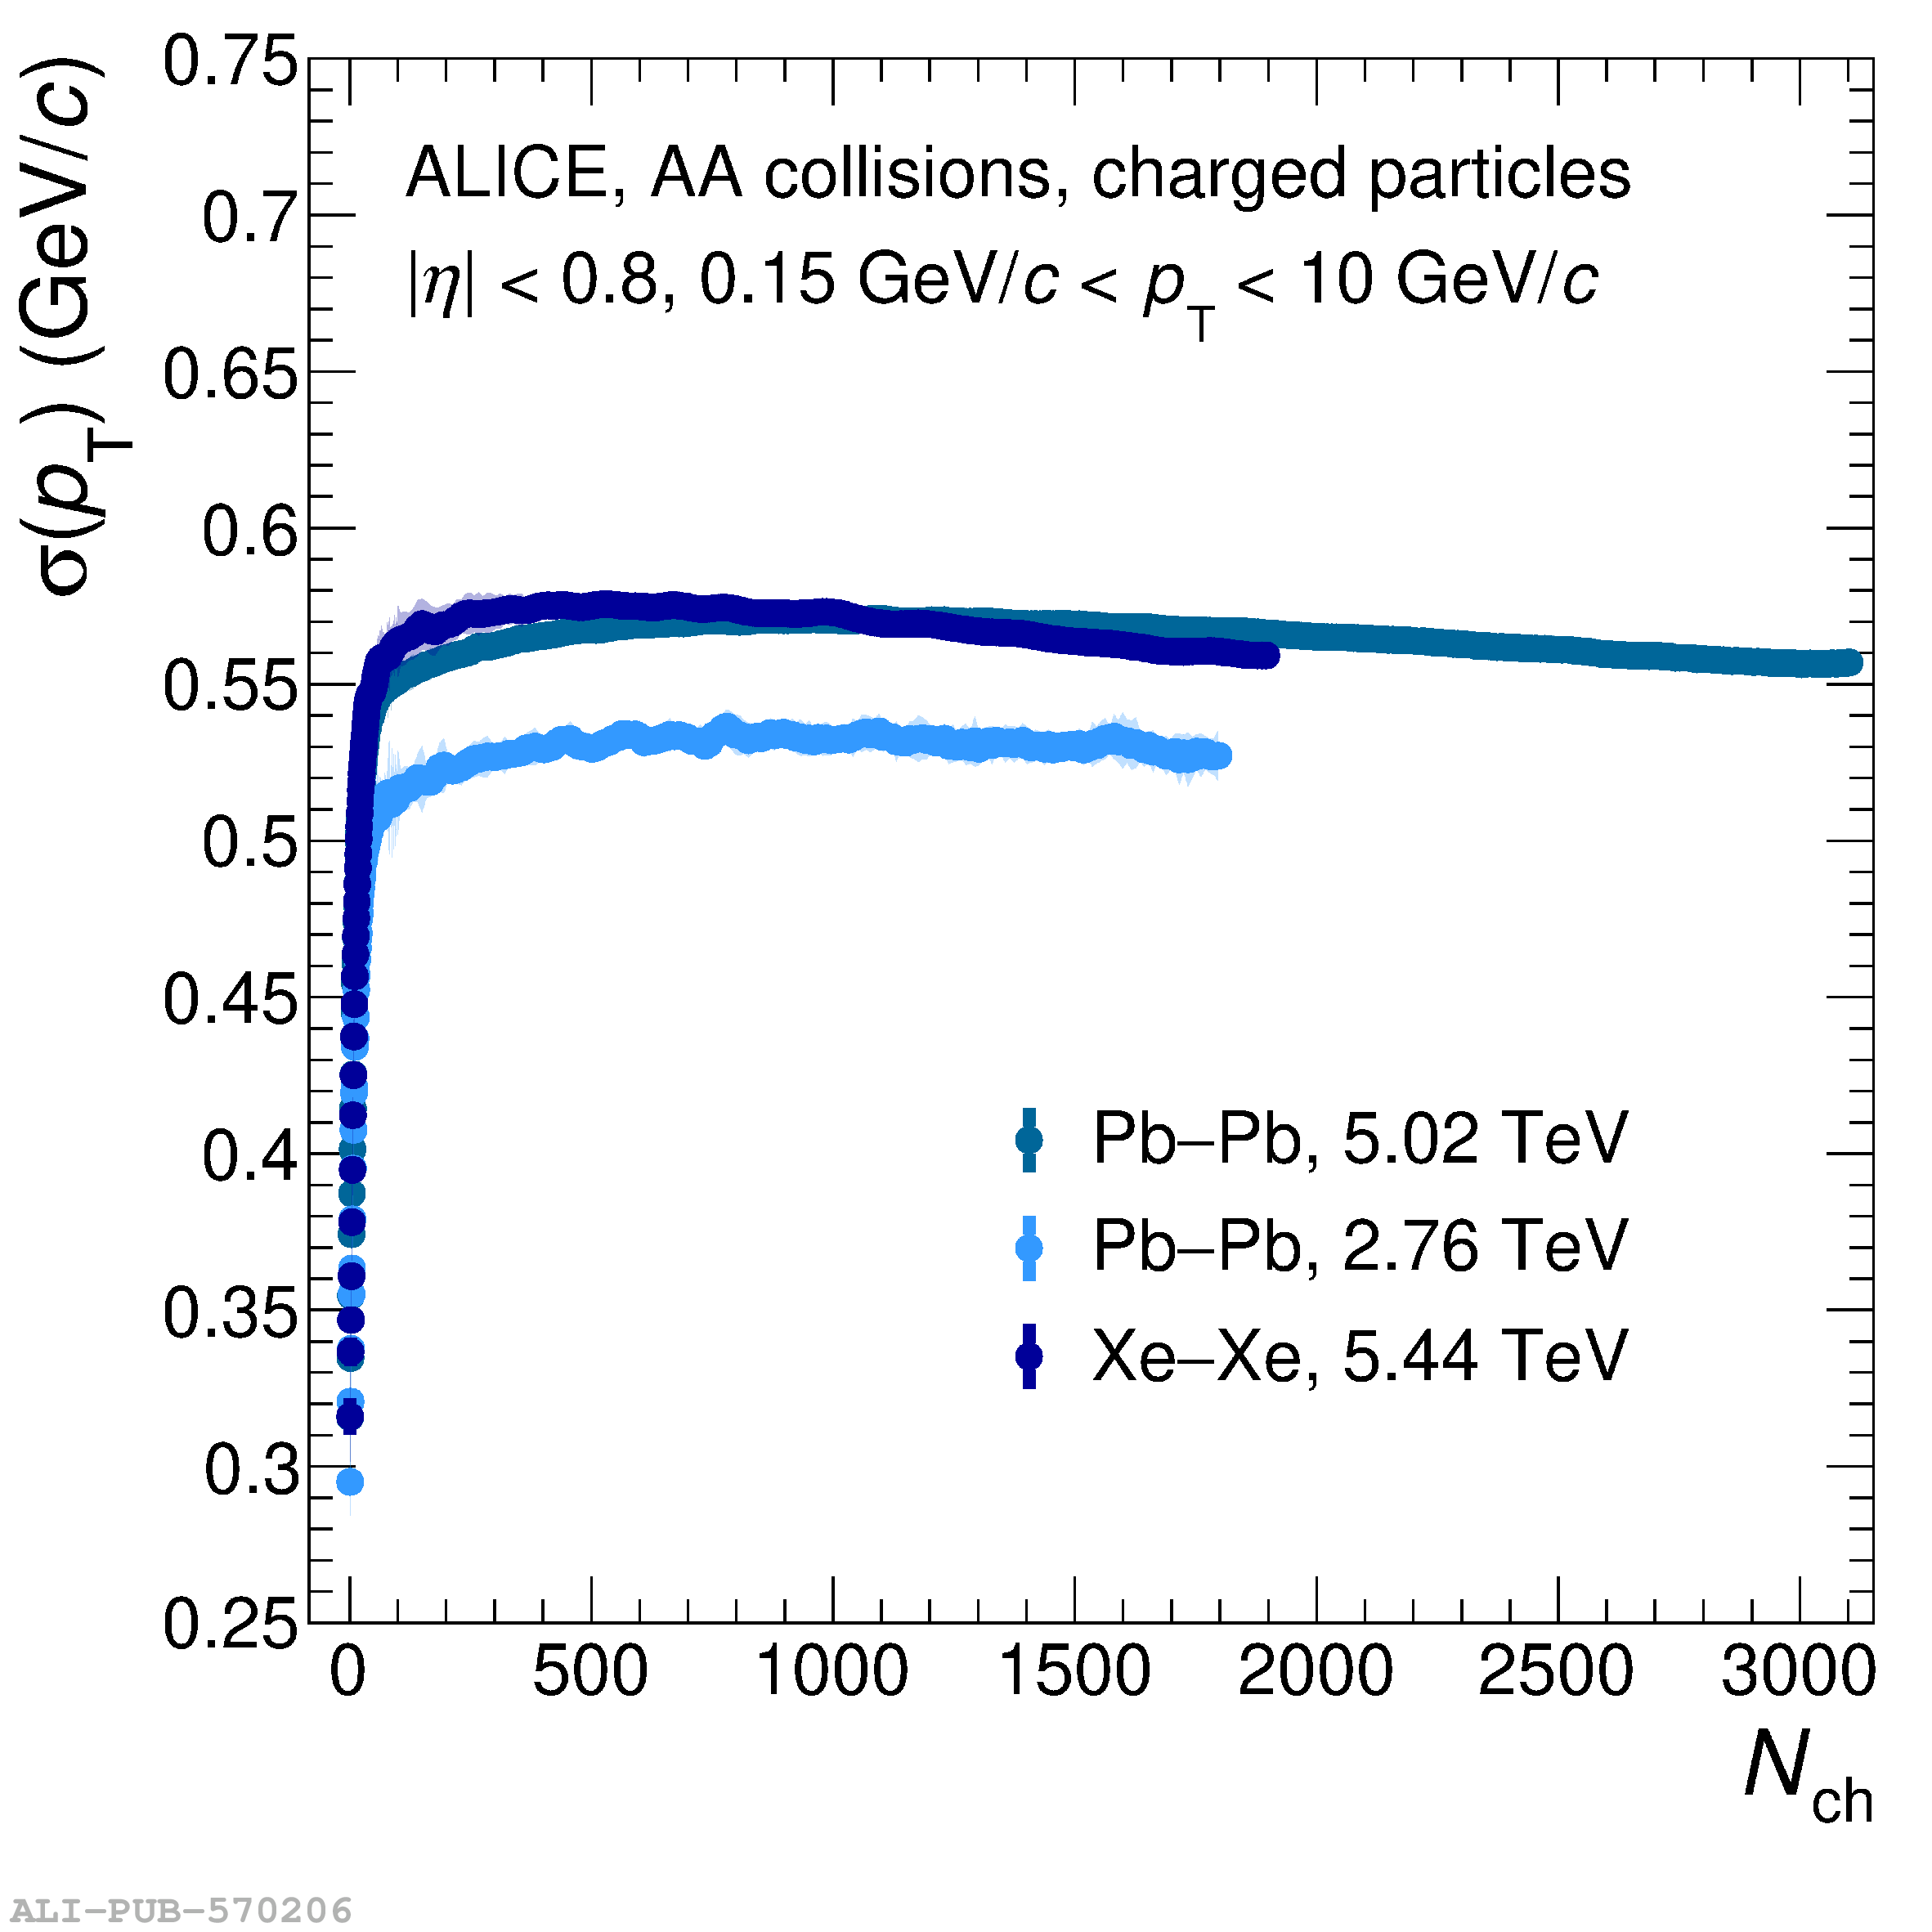 |