Pressure, energy density and entropy density normalised to the 4$^{\rm th}$ (3$^{\rm rd}$ for the latter) power of the temperature, from the Lattice QCD calculations of the HotQCD Collaboration, see Ref. . The dark lines show the prediction of the Hadron Resonance Gas model, the horizontal line corresponds to the ideal gas limit for the energy density. The vertical band indicates the cross-over transition region. Corresponding results from the Wuppertal-Budapest Collaboration can be found in Ref. . |  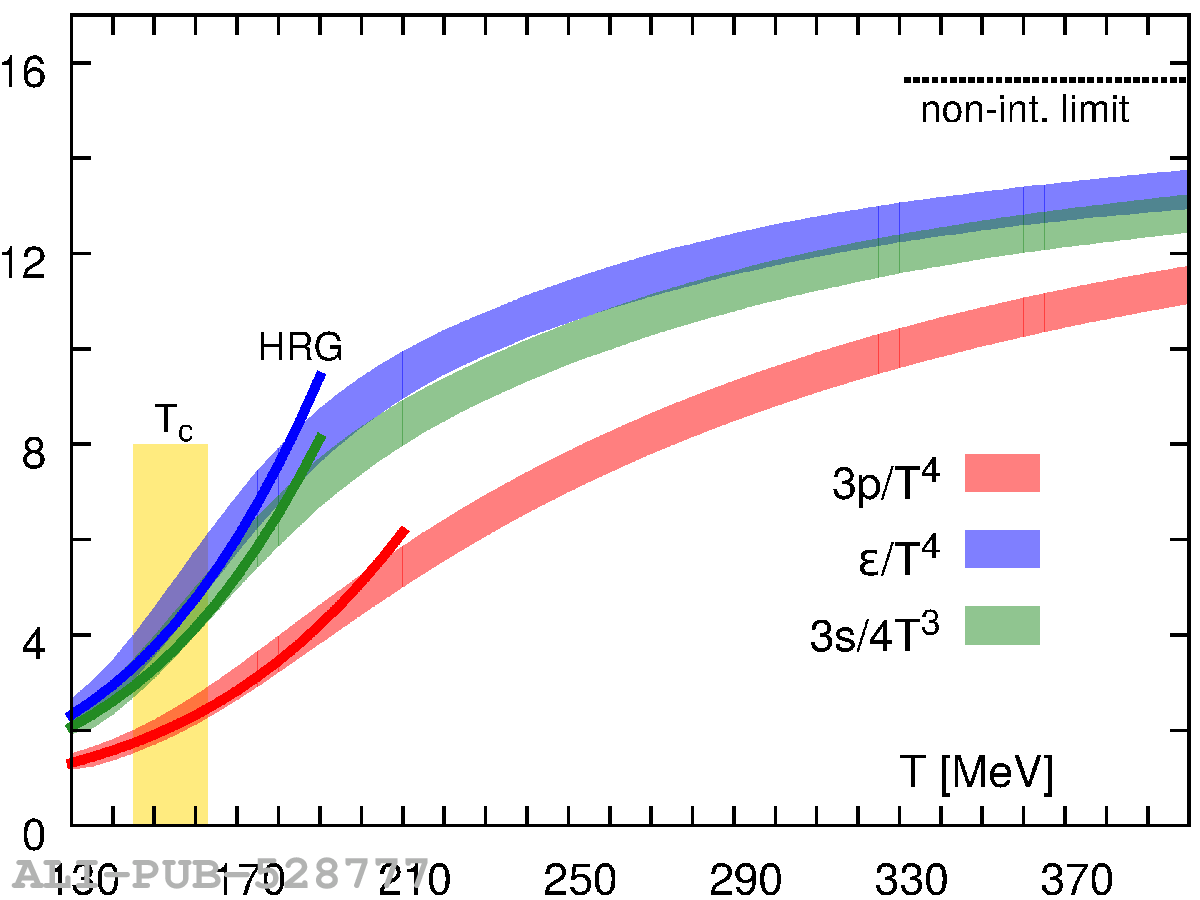 |