This work aims to differentiate strangeness produced from hard processes (jet-like) and softer processes (underlying event) by measuring the angular correlation between a high-momentum trigger hadron (h) acting as a jet-proxy and a produced strange hadron ($\phi(1020)$ meson). Measuring h$-\phi$ correlations at midrapidity in p$-$Pb collisions at $\sqrt{s_{\rm NN}}$ = 5.02 TeV as a function of event multiplicity provides insight into the microscopic origin of strangeness enhancement in small collision systems. The jet-like and the underlying-event-like strangeness production are investigated as a function of event multiplicity. They are also compared between a lower and higher momentum region. The evolutions of the per-trigger yields within the near-side (aligned with the trigger hadron) and away-side (in the opposite direction of the trigger hadron) jets are studied separately, allowing for the characterization of two distinct jet-like production regimes. Furthermore, the h$-\phi$ correlations within the underlying event give access to a production regime dominated by soft production processes, which can be compared directly to the in-jet production. Comparisons between h$-\phi$ and dihadron correlations show that the observed strangeness enhancement is largely driven by the underlying event, where the $\phi/\mathrm{h}$ ratio is significantly larger than within the jet regions. As multiplicity increases, the fraction of the total $\phi(1020)$ yield coming from jets decreases compared to the underlying event production, leading to high-multiplicity events being dominated by the increased strangeness production from the underlying event.
Phys. Rev. C 110 (2024) 064912
HEP Data
e-Print: arXiv:2405.14491 | PDF | inSPIRE
CERN-EP-2024-142
Figure group
Figure 1
(a) Invariant-mass distribution of unlike-sign (US) kaon pairs (black), with the scaled like-sign (LS) pair distribution (red) used to approximate the combinatorial background (BG). (b) Background subtracted invariant-mass distribution of unlike-sign kaon pairs (black). The $\phi$(1020) mass peak is fit (blue dashed line) by a sum of a Voigt function and a first-order polynomial, which accounts for the residual background. This linear fit of the residual background is shown as a red line. Statistical uncertainties are plotted as bars, but are too small to be visible here. |   |
Figure 2
Per-trigger h--$\phi$ $\Delta\varphi$ angular correlations integrated over the range $|\Delta\eta| < 1.2$ for the lower $p_{\rm T}$ range of associated $\phi$(1020), $1.5 < p_{\rm T} < 2.5$ GeV/$c$ (top), and the higher $p_{\rm T}$ range of associated $\phi$(1020), $2.5 < p_{\rm T} < 4.0$ GeV/$c$ (bottom). The three multiplicity classes are plotted in increasing order from left to right. All plots for a given associated particle $p_{\rm T}$ have the same axis scale, with offsets set to their respective underlying background estimation. Statistical uncertainties are represented as error bars, while systematic uncertainties are marked with open rectangles. The grey band shows the systematic range for the different background estimation methods. The long dashed line shows the flat background assumption, while the short dotted line shows the alternative background with non-zero $v_2$ (used as systematic for pair yields). |   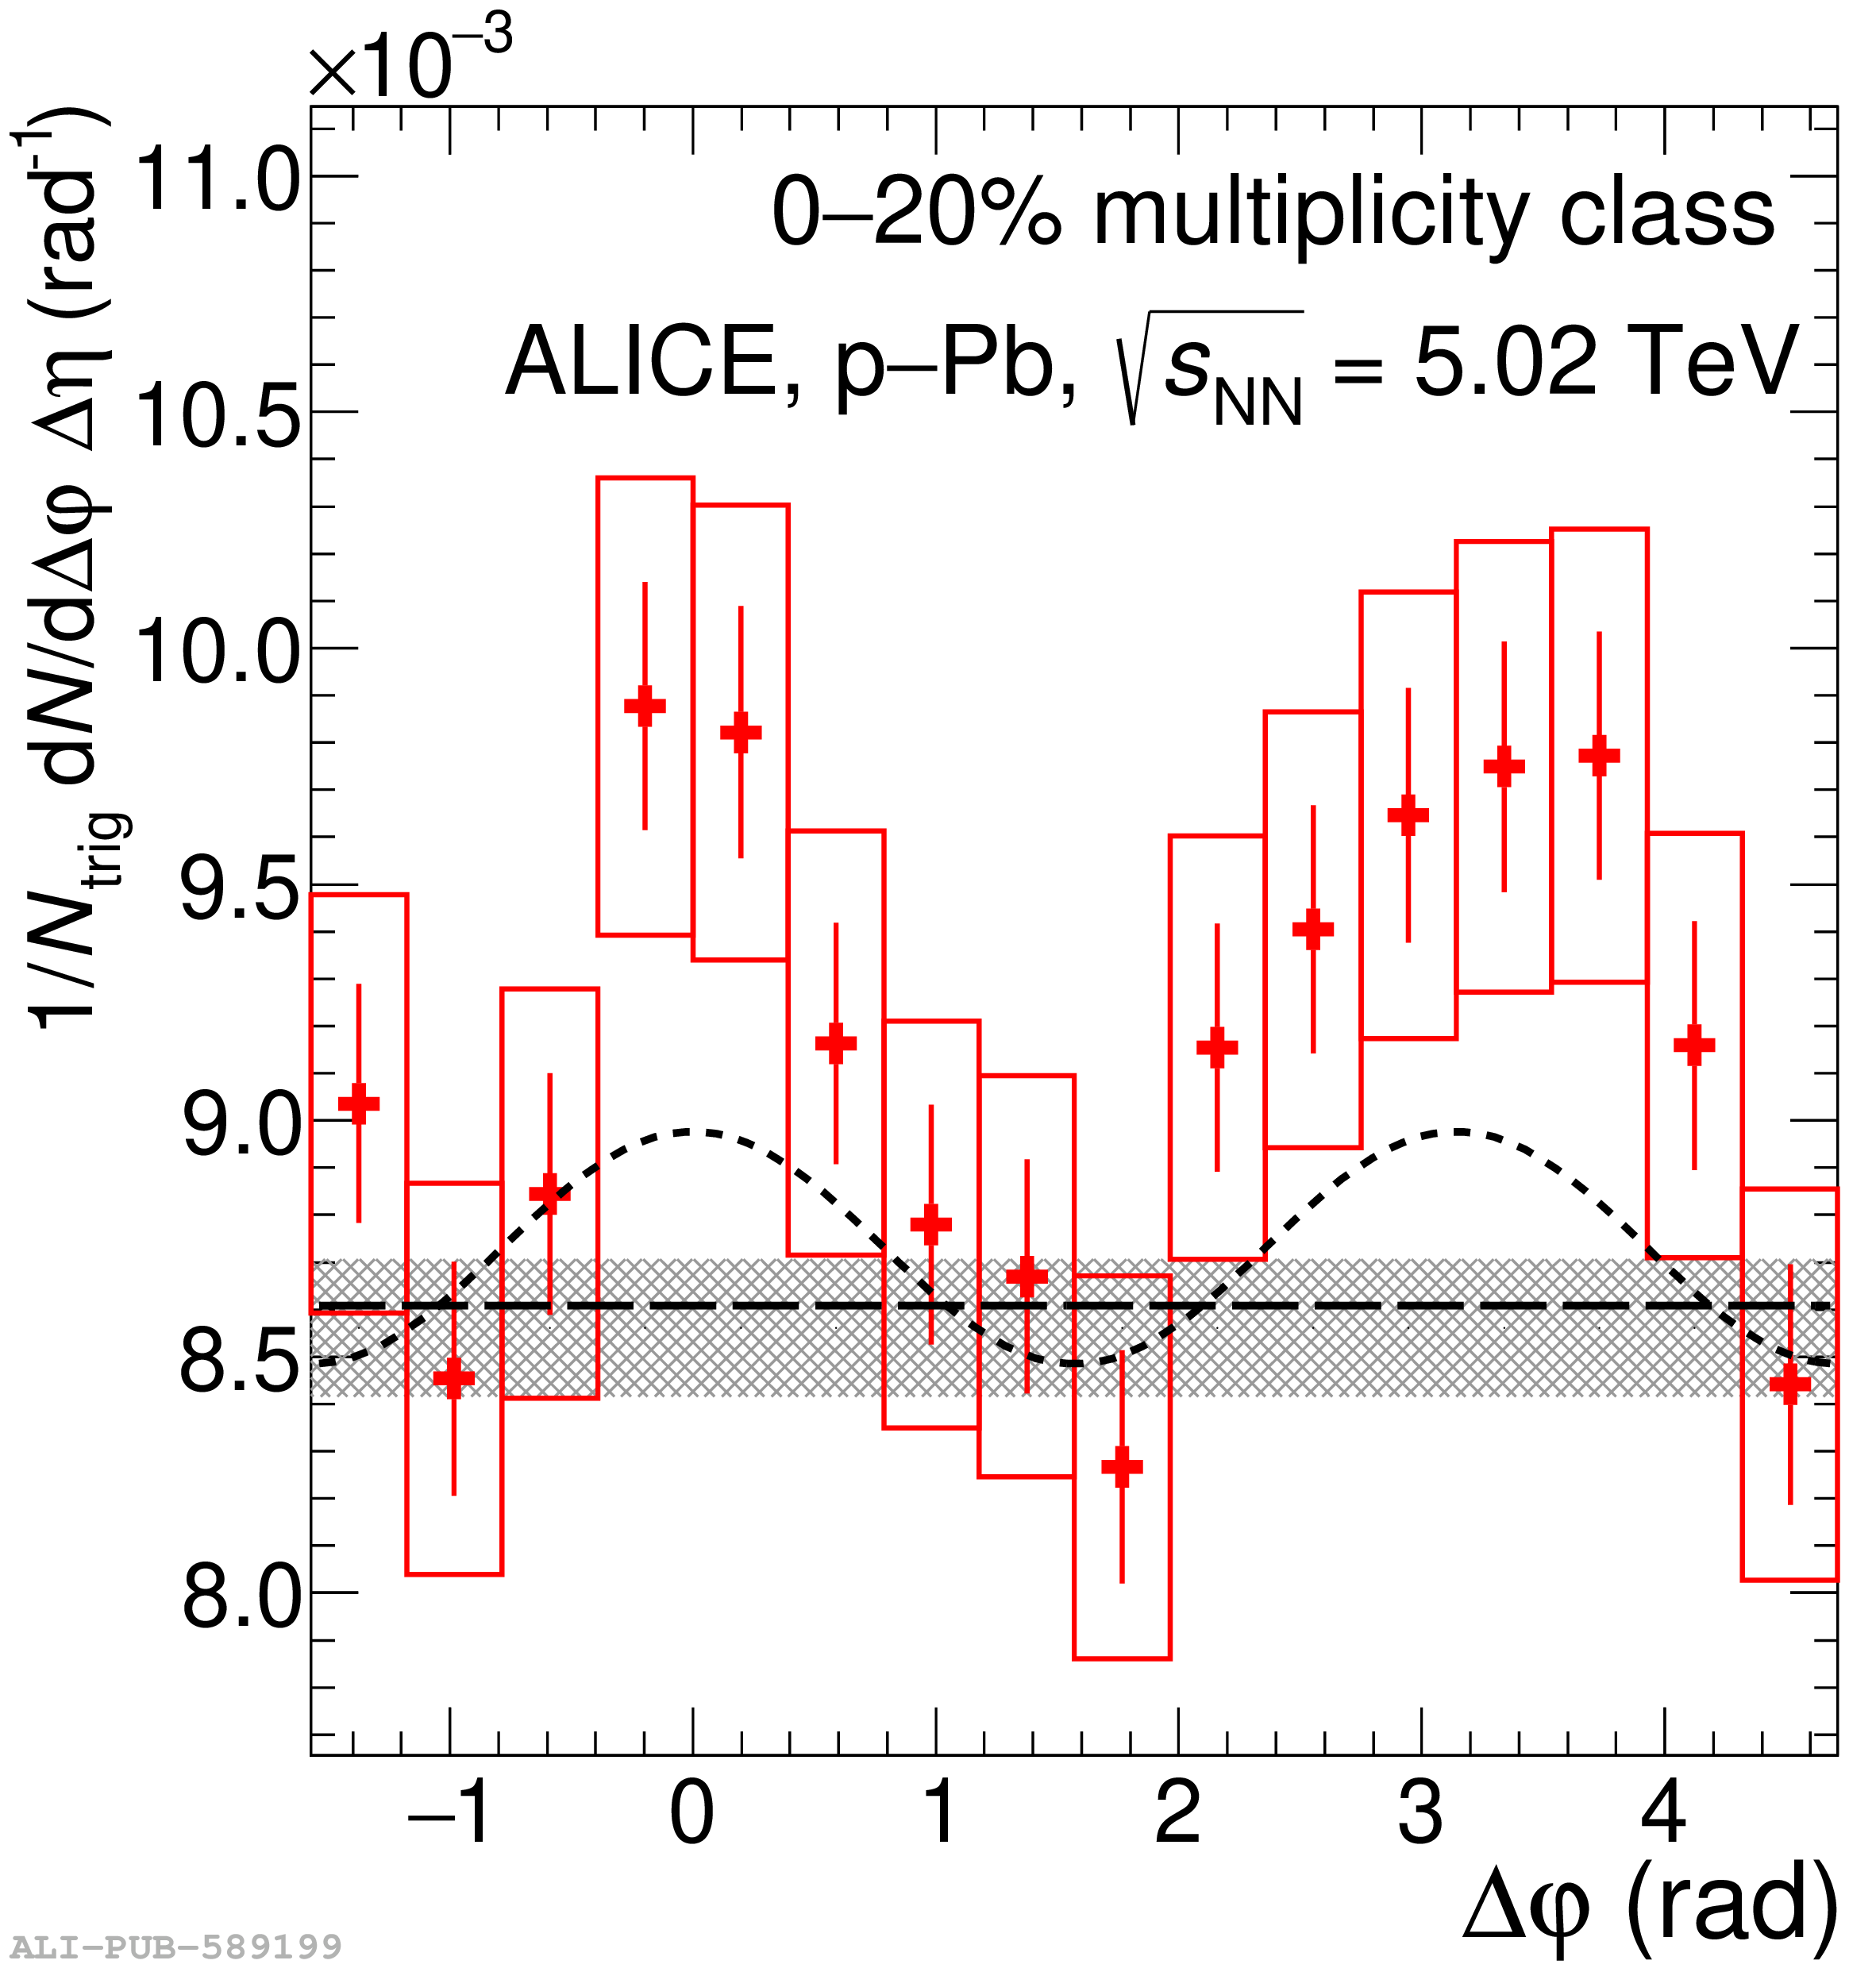  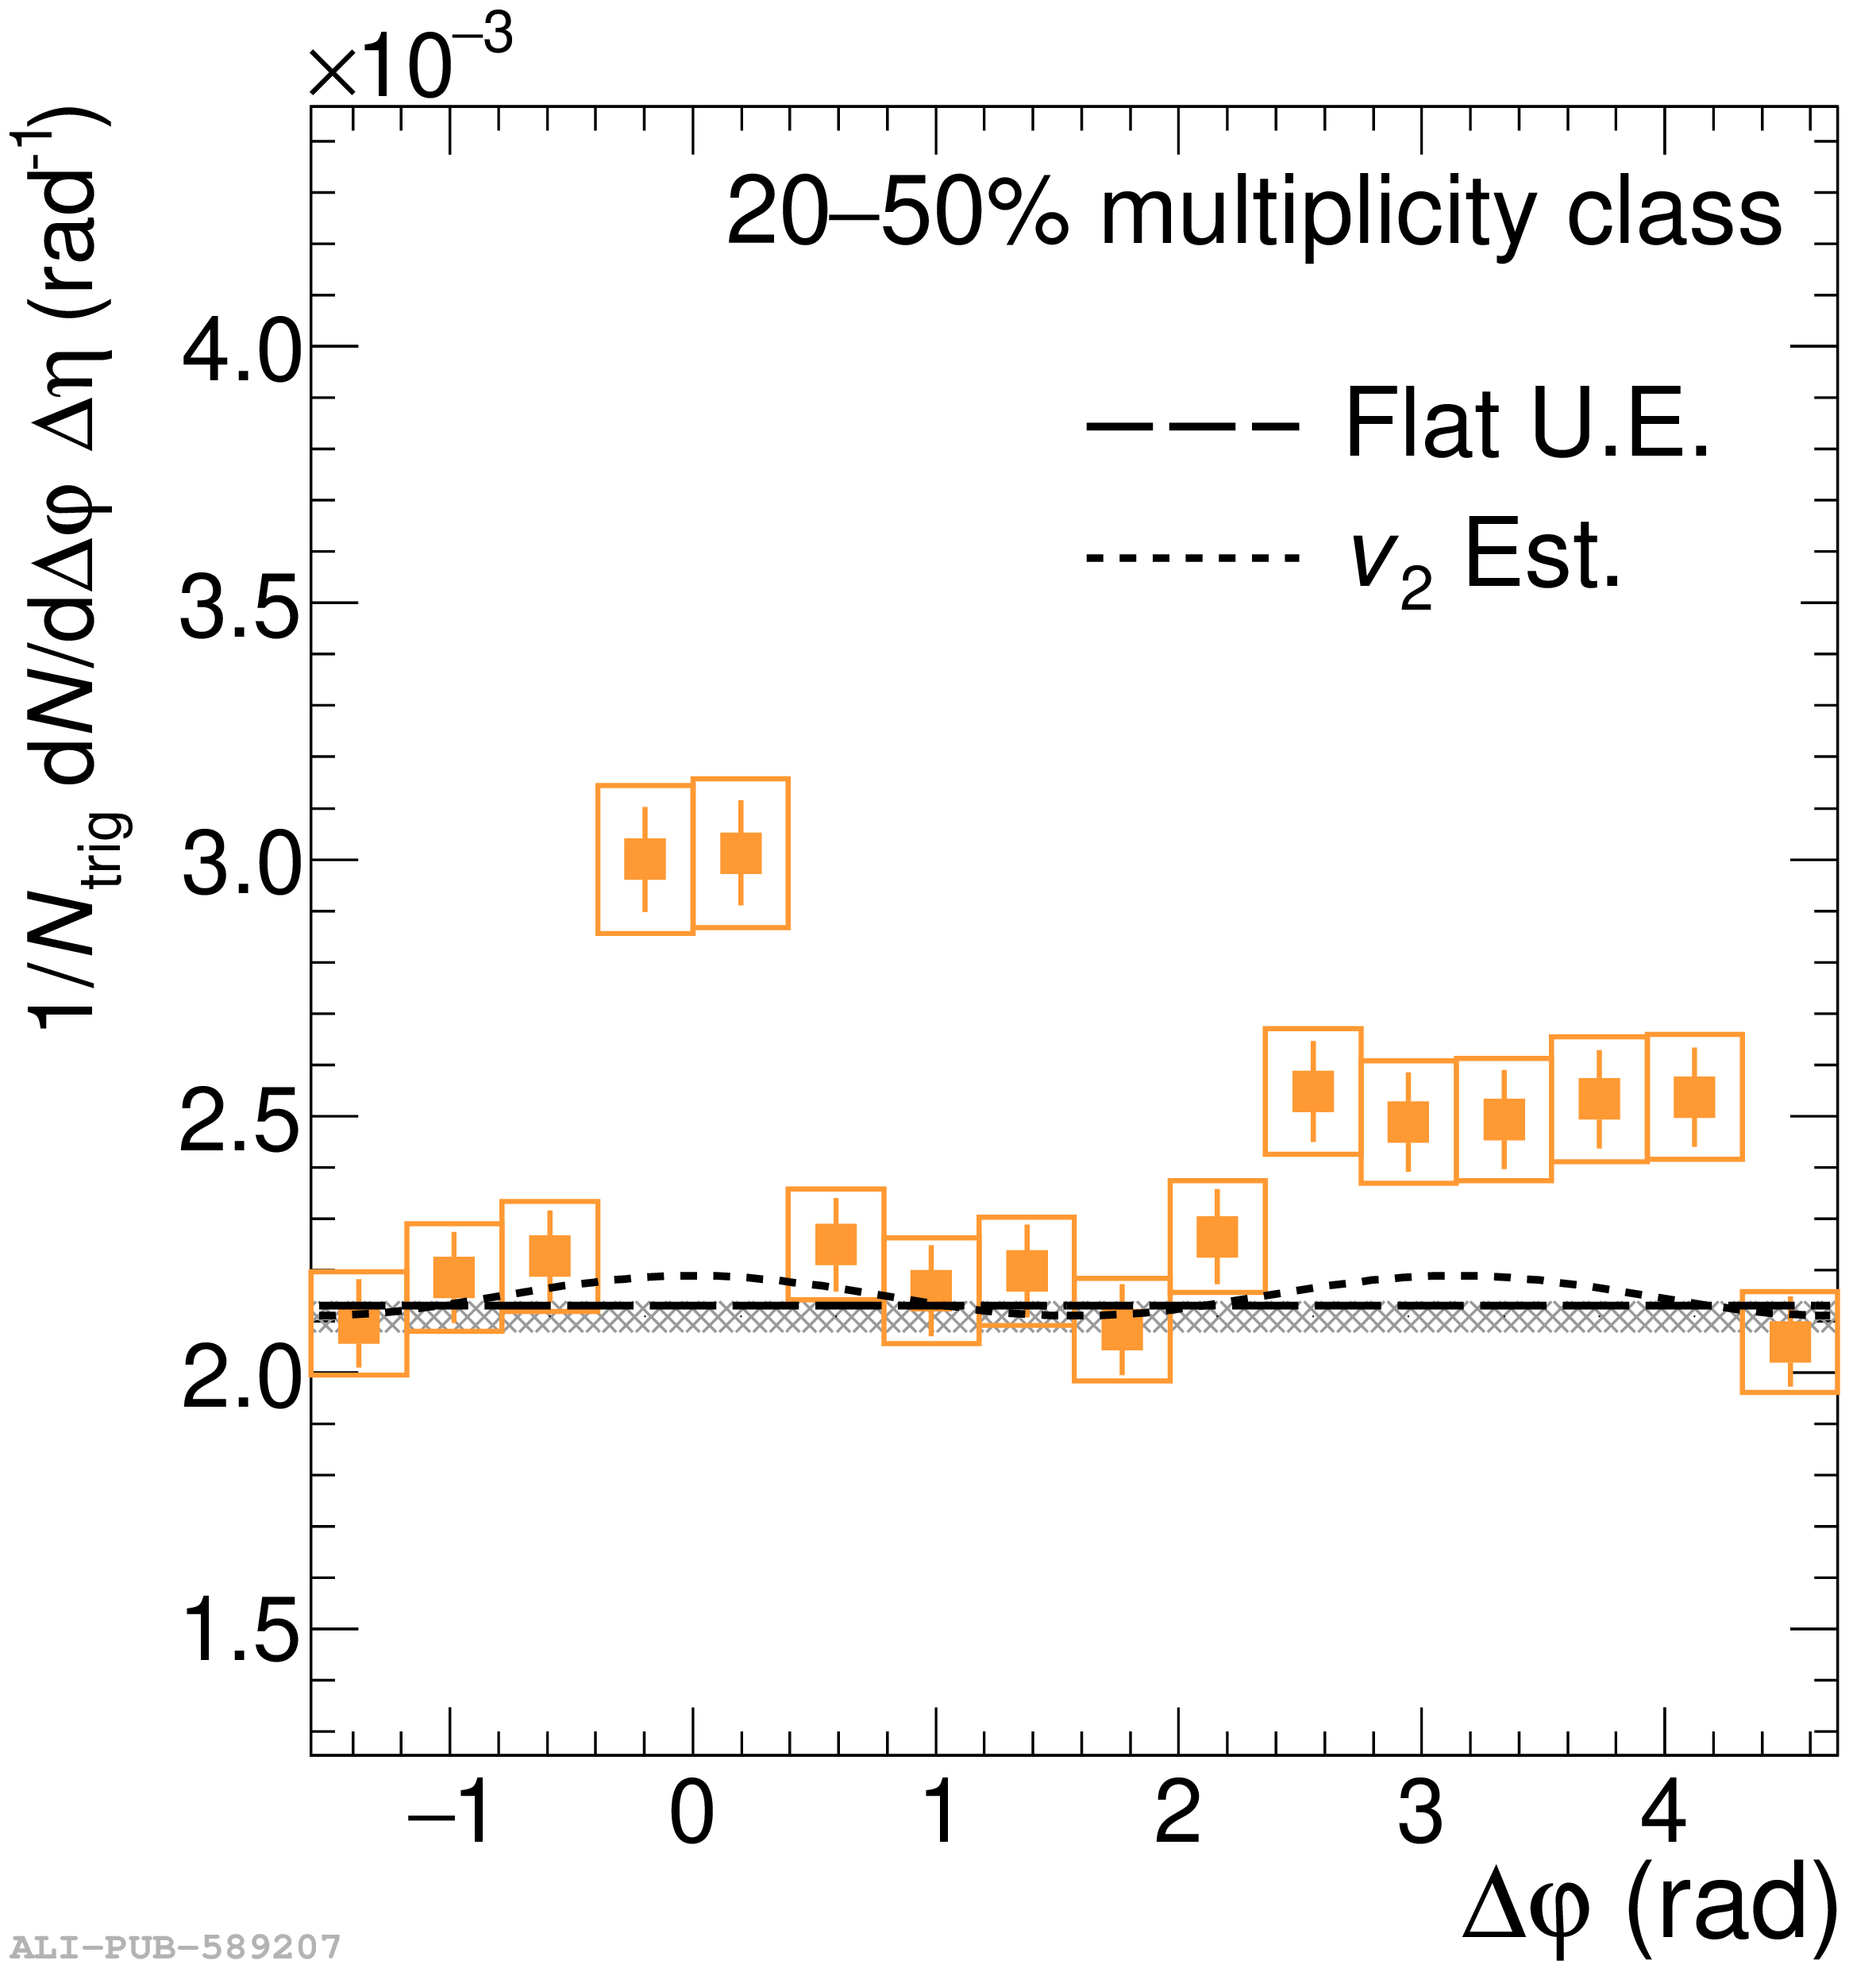  |
Figure 3
Per-trigger dihadron $\Delta\varphi$ angular correlations integrated over the range $|\Delta\eta| < 1.2$ for the lower $p_{\rm T}$ range of associated hadrons, $1.5 < p_{\rm T} < 2.5$ GeV/$c$ (top), and the higher $p_{\rm T}$ range of associated hadrons, $2.5 < p_{\rm T} < 4.0$ GeV/$c$ (bottom). The three multiplicity classes are plotted in increasing order from left to right. All plots for a given associated particle $p_{\rm T}$ have the same axis scale, with offsets set to their respective underlying background estimation. Statistical uncertainties are represented as error bars, while systematic uncertainties are marked as open rectangles. |       |
Figure 4
Per-trigger pair yields within the near- and away-side jet peaks as a function of charged-particle multiplicity, for the low (left) and high (right) associated momentum bins. The shaded regions represent the deviation in the yields from using a non-zero $v_2$ when estimating the underlying-event background. Closed points are the jet yields from the h--$\phi$ correlations, while open points are the jet yields from the dihadron correlation. Only statistical uncertainties are shown. Systematic uncertainties are on the order of 10% (15%) of the near-side (away-side) associated $\phi$(1020) yields. As these uncertainties are correlated across multiplicity and between the near- and away-side yields, they are not plotted here. | 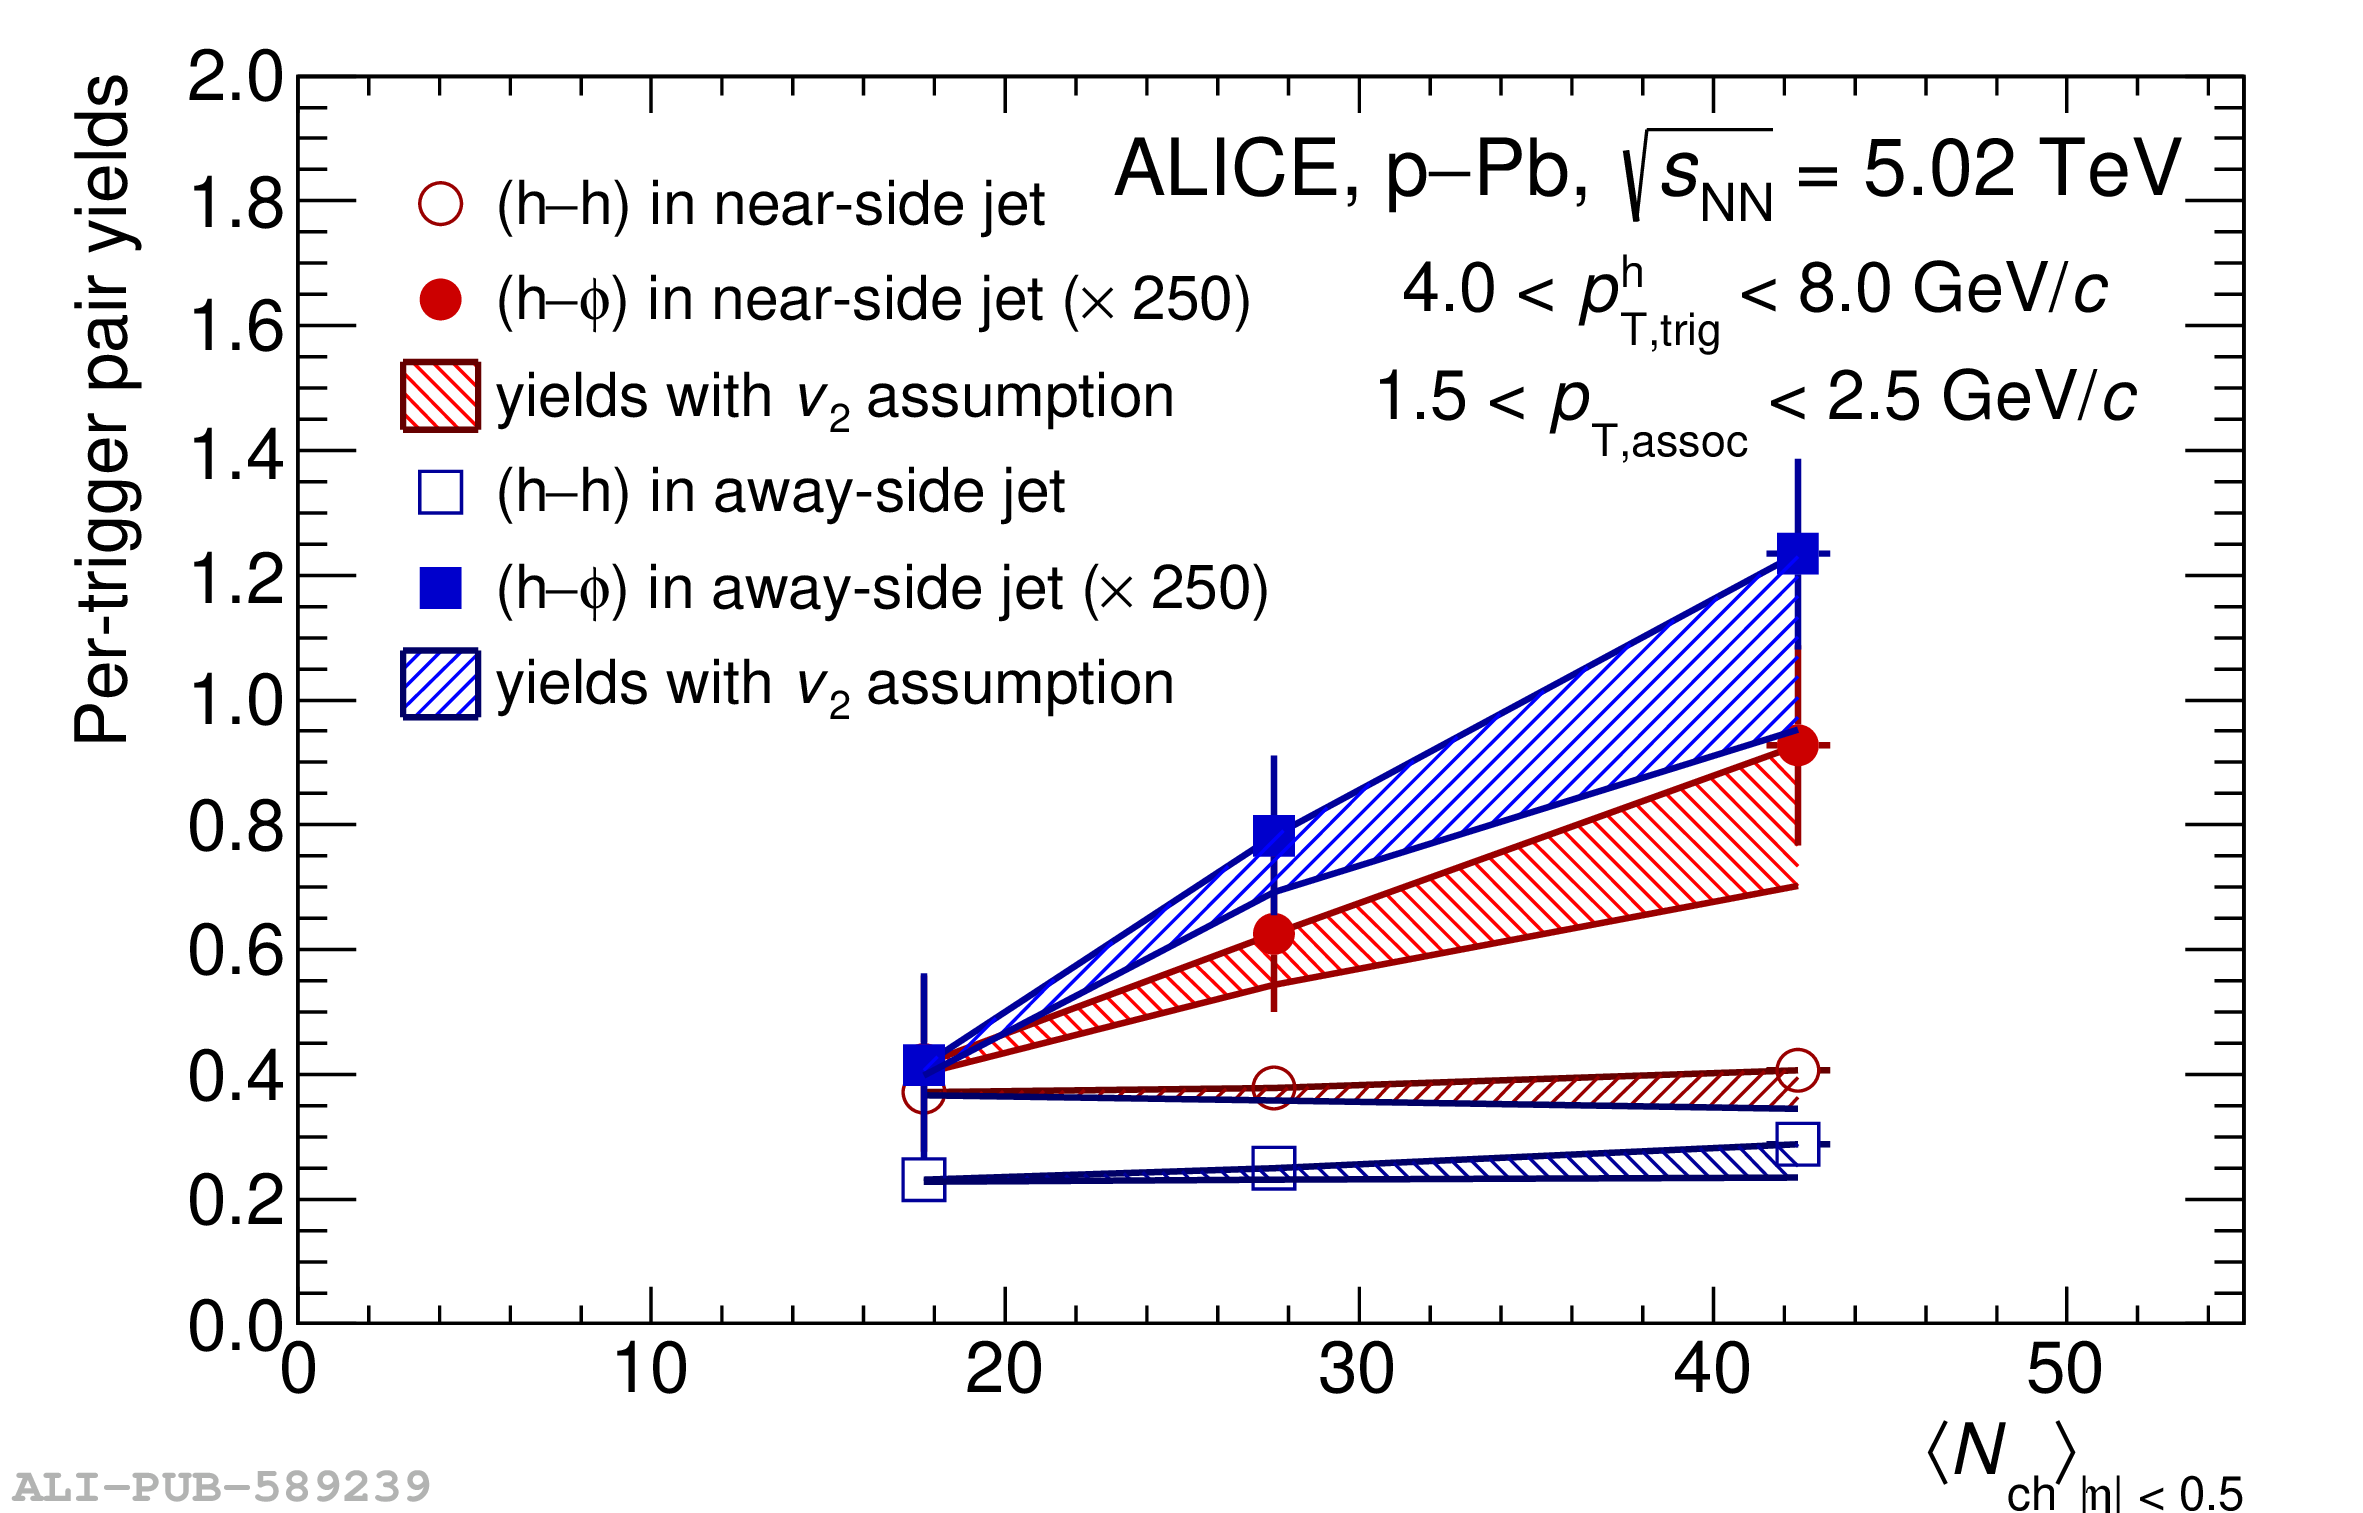  |
Figure 5
Pairwise (h--$\phi$)/(h--h) ratio vs $\langle N_{\mathrm{ch}} \rangle$ for the lower associated momentum range, $1.5 < p_{\rm T} < 2.5$ GeV/$c$ (top), and higher associated momentum range, $2.5 < p_{\rm T} < 4.0$ GeV/$c$ (bottom). Statistical uncertainties are presented as error bars, while systematic uncertainties, including uncertainties on the calculated $\langle N_{\mathrm{ch}} \rangle$ value, are shown as open boxes. The additional uncertainty in the ratio due to a non-zero $v_2$ in the underlying-event background estimation is depicted as a gray band. Systematic uncertainties for the (h--h) and (h--$\phi$) yields are treated as uncorrelated when calculating the uncertainty on the ratio. Ratios from p--Pb data are depicted as solid points, while ratios from PYTHIA 8 simulations of pp events are depicted as open points. | 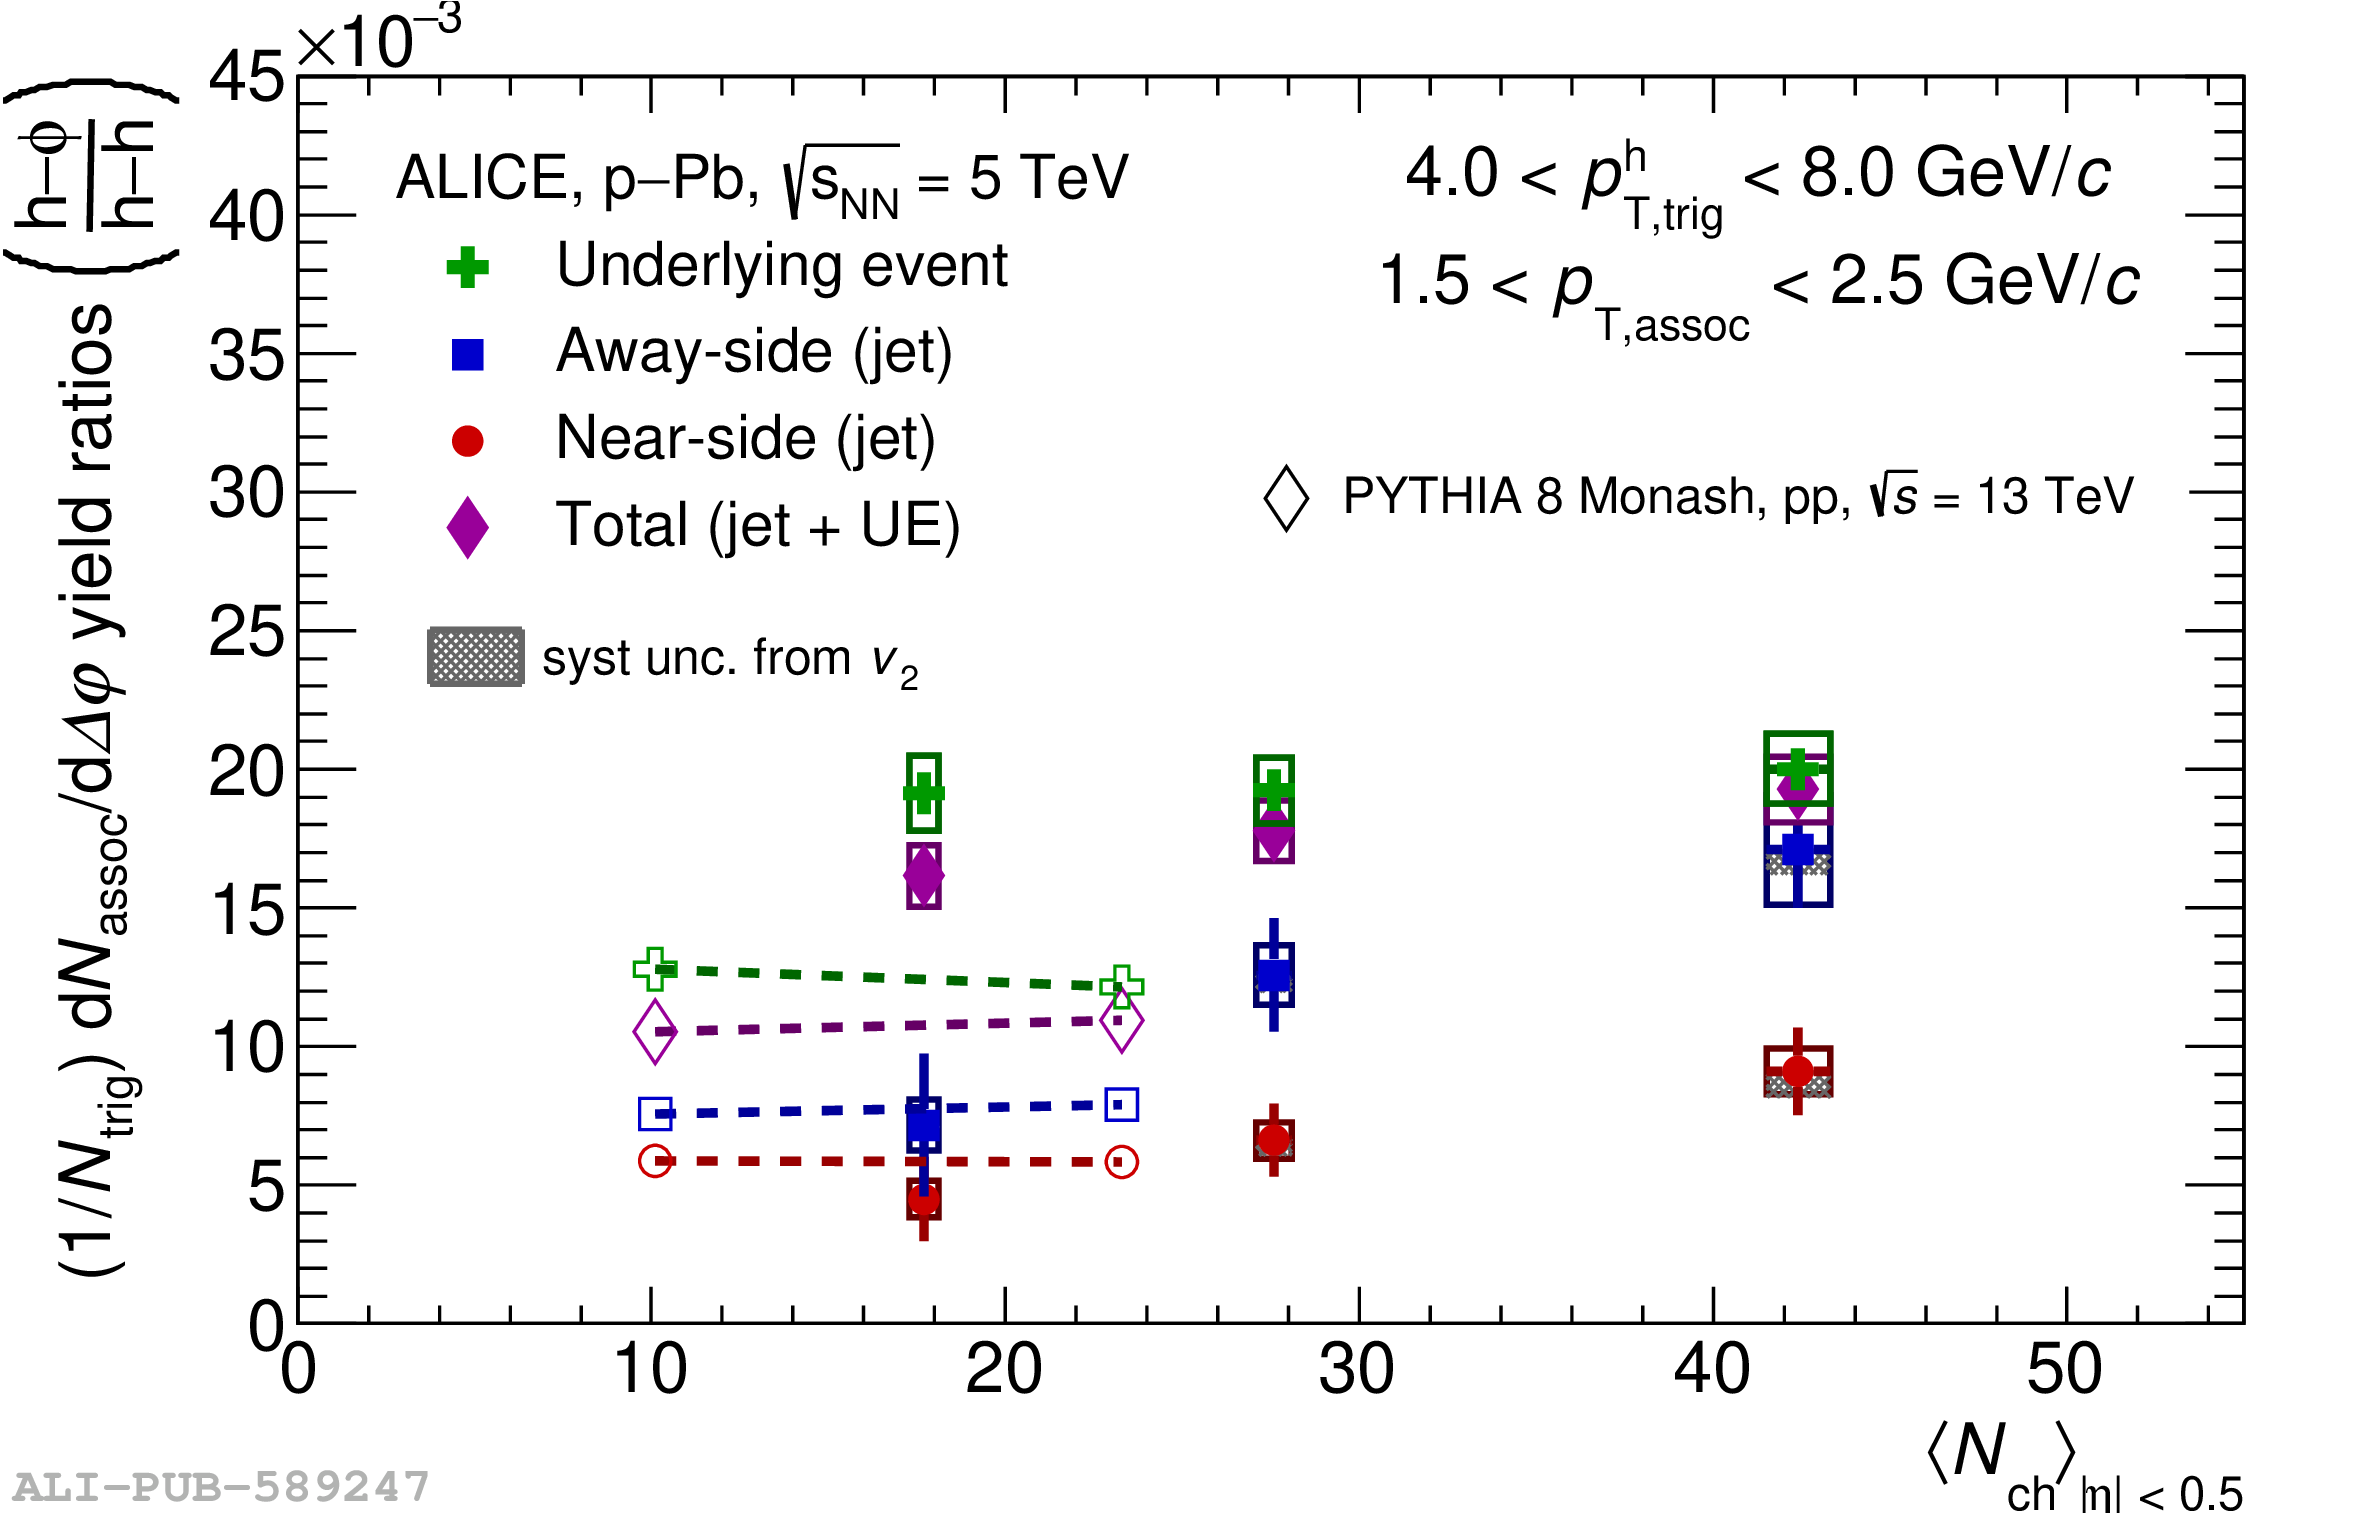  |